WAVES Price Analysis: Corrections following a strong Q4 2018

Following a period of strong price performance from late November to mid-December, the price of WAVES has steadily declined as sentiment has corrected in 2019. While the direction of the token's next short term movement is unclear, medium-to-long term prospects are buffered by recent network updates which have significantly upgraded token issuance and smart contract possibilities on the network.
Waves (WAVES) is a public blockchain characterized by its simple, clean and streamlined user experience. The main value and appeal of the platform is derived from the Custom Application Token (CAT) process This lets users create a custom token directly using the easy-to-navigate Waves Lite client, which can run as a Desktop App or on Mobile with Android or iOS.
The WAVES token currently has utility as the within ecosystem token of the Waves blockchain. It lets users build and raise funds for new tokens, can be used as a base pair on the Waves DEX, or as a peer-to-peer payment medium. The token’s entire 100 million supply is already circulating. The price of WAVES has risen by ~8% in the last week, most likely benefitting from the recent bullish price activity in large cap markets such as LTC and BTC.
Creating a token costs 1 WAVES (~$2.79). It does not require a user to download the entire Waves blockchain, or have any prior coding knowledge. The Lite client also comes packaged with the popular Waves Decentralized Exchange (DEX) service allowing a user to instantly launch their created token for trading, or trade amongst the numerous already available.
The Waves platform uses the idiosyncratic Waves-ng protocol. The core mechanism of the consensus is to allow multiple blocks on the Waves transaction chain to be verified at the same time, theoretically resulting in increased transaction speeds.
There are 23,459 listed WAVES coins listed on http://dev.pywaves.org vs 166,855 listed Ethereum token contracts as per Etherscan. The most highly traded Ethereum token BNB, does ~$133,756,206 worth of daily trading volume (including off chain transfers on centralized exchanges), while the most popular Waves coin Mercury, handles ~$111,214 worth of 24hr volume.
These metrics show that despite growing interest for building tokens on Waves, the blockchain’s primary use case as a tool to launch blockchain projects has not achieved scale and has a token development scene that is tame compared to ecosystem leaders like Ethereum.
There have, however, been recent signals of a shift in momentum for the WAVES token ecosystem. The Vostok project, a major blockchain initiative designed to help governments and enterprises decentralize IT systems, announced that it would be launching the platform’s VST token (Vostok System Tokens) over the Waves blockchain. Additionally, 3% of VST’s total supply will be airdropped to WAVES holders through the Waves internal client.
The Vostok announcement has created buzz and positive speculative momentum for a few reasons. The project raised $120 million through private and institutional investors, a validation of the scale and reach of the project. Vostok has also clarified, that legal conditions withstanding the entire public sale will be held exclusively for WAVES holders.
The Waves platform has earned mainstream recognition through a partnership with international audit giant Deloitte, to help provide a compliant legal framework for ICO projects choosing to launch on WAVES. It is likely the partnership was design with deals like the Vostok launch specifically in mind.
The initial Vostok announcement on December 17th had an immediate impact on price. In the 48 hours that followed, the price of WAVES rose over 60%, from ~$2.5 to just over $4.
There was another Vostok pump on the 17th of January when following the release of details on how to participate in the VST public airdrop, the price of WAVES rose ~20% over a week.
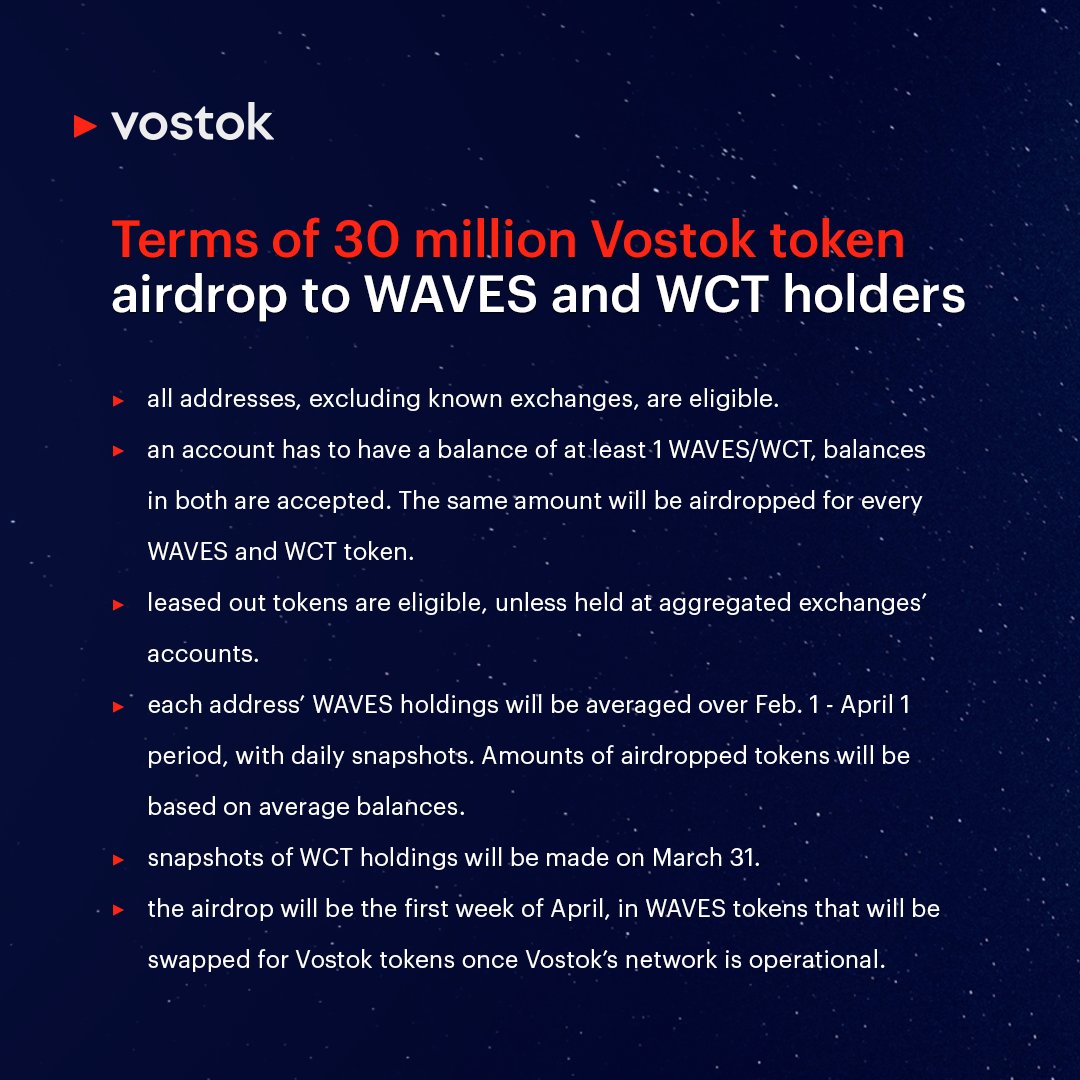
Historical context considered, there is likely to be some price action around late-March early April due to FOMO buying surrounding the end of the VST snapshot. WAVES is also the primary base pair to access WCT (the alternative VST access medium) and this may also create buying pressure for the token.
Other recent technical development have also aided in the Waves ecosystem creating short term speculative momentum. Smart Asset Protocols were launched for the Waves blockchain on January 1st 2019, and they will add significant functionality to new tokens being issued on top of the platform.
The new smart assets on Waves will have added feature for issuers such as multi-signature transactions (requires more than one user to sign transactions before it is broadcast to the network), The ability to whitelist/blacklist specific addresses, the management of trading pairs (block token from interacting in specific pairs), and asset freezing. These features make Waves smart assets more directly comparable to similarly multi-faceted Ethereum based ERC-20 tokens.
A new decentralized, Waves smart contract powered game Fhloston paradise (a reference to the cult 1997 French science-fiction film, the Fifth Element) has gained some popularity and has been a recent source of network activity. It is a simple gambling game which uses some unique blockchain based gameplay features.
In order to win the jackpot (total WAVES potted in the game is currently worth ~$11,334) a user must ensure that theirs is the only transaction recorded on the game for a 60 block period, or ~60 minutes (1 minute per block), every new transaction resets the timer and sets up a new potential winner. Each ticket is worth 1.1 WAVES or ~$3 and the clear temptation to play on the expectation that interest in the game has waned has enticed a few users into dumping WAVES into the game.

As part of its new smart asset and game/DApp functionality Waves will also release a native Blockchain scripting language, called RIDE. The language is designed with a fixed fee model, very different from the variable fee GAS model of Ethereum, this limits the functionality of the Waves smart contract but is still a significant upgrade to current operation capability. The Waves project appears committed to retaining its simple, easy to access characterization.
The Waves internal client has also had a recent update, now on version 1.0.36. New features include faster chart synchronization with trades on the Waves dex and new asset searching capabilities.
Exchanges and trading pairs
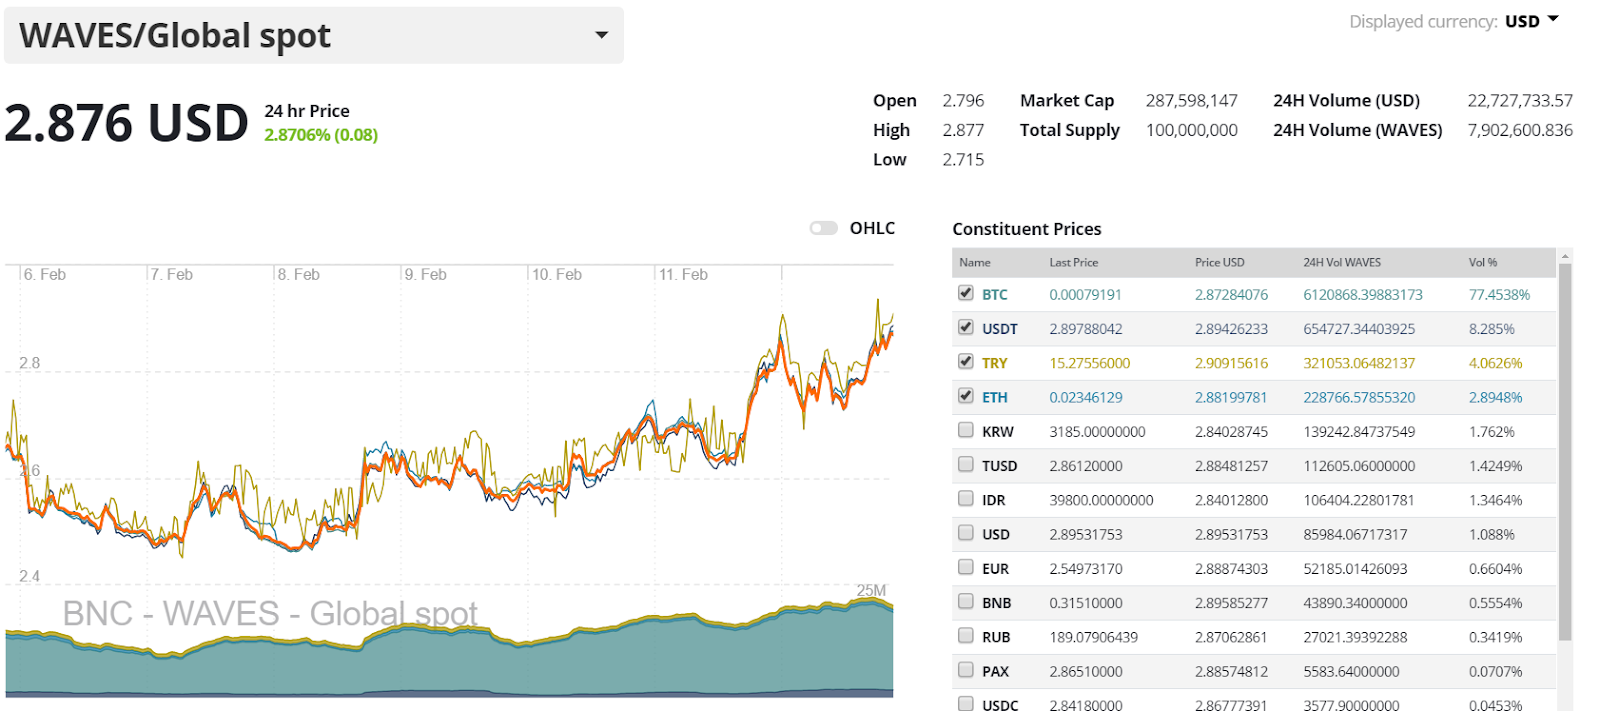
7 day-WAVES price and volume chart. Orange line represents an index price comprising of the 5 most popular REP markets, which are listed on the table to the right.
The most popular pairs for WAVES are the crypto-to-crypto WAVES/BTC and WAVES/USDT pairs which respectively account for over 77% and 8% of the WAVES market and together make up over 85% of total WAVES exchange trading volume.
The USD value of the daily trading volume for the WAVES/BTC market is worth just over ~$17.5 million. The most popular fiat trading option for WAVES is the Turkish Lira.
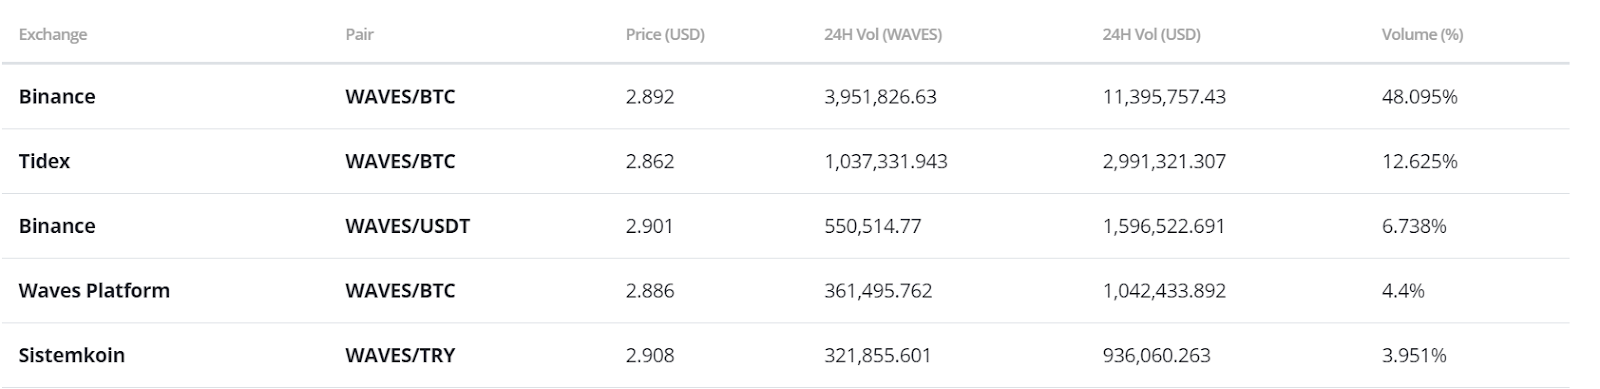
The most popular place to trade WAVES, is the ecosystem’s most voluminous exchange Binance. Both the most WAVES/BTC & WAVES/USDT are liquid and popular markets. Also notable is the popularity of Tidex, a Waves-integrated exchange which also lists a number of Waves-hosted tokens such as WCT and MER.
Onchain metrics
NVT signal

WAVES NVT signal and price. NVT signal calculated with data from Coinmetrics.io. Adjusted onchain transaction volume used for NVT signal
Derived from the NVT ratio, the NVT signal is a responsive blockchain valuation metric developed by Willy Woo and Dmitriy Kalichkin. Crypto markets are prone to bubbles of speculative purchasing, not backed up by underlying network performance and activity. The NVT signal provides some insight into at what stage of this price cycle a token may be.
A high NVT signal is indicative of a network that is going through one of these bubble periods, and may move towards a position of becoming overbought/overvalued, because of the market’s speculative assessments running out of steam.
Following strong performance towards the end of 2018, the price of WAVES has been in a steady down trend. Since December 19th price is down by ~31%, with little relief offered by events like mid-January’s VST announcement. At the same time, however, the WAVES NVT signal began reversing upwards from an oversold inflection point and has possibly put a check on downward price pressure with some forward fundamental support.
Given this, any potential ‘event based’ price pumps such as one that may come with FOMO buying before the end of the VST snapshot, or perhaps because of favourable conditions in the wider crypto ecosystem, will push price higher than under normal market conditions, given the current oversold indications.
PMR signal
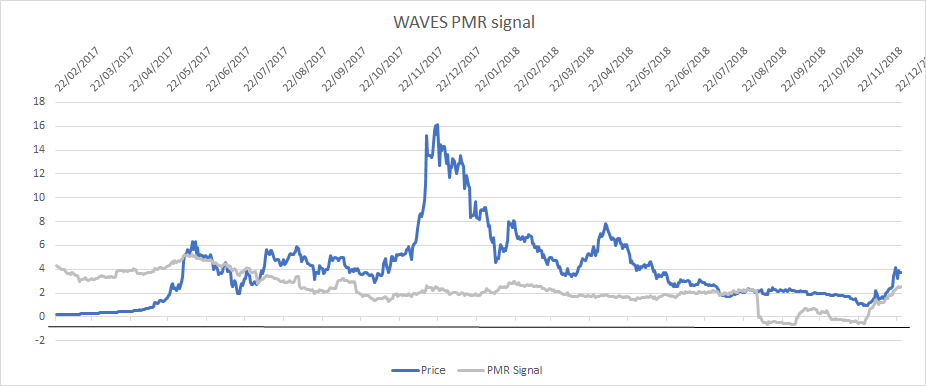
_WAVES Kalichkin PMR and price. PMR calculated with data from Coinmetrics.io. _
Metcalfe’s law is a measure of connections in a network, as established by Robert Metcalfe the founder of Ethernet. It has subsequently been used to analyze the true value of network-based financial products like Facebook and Bitcoin, and by comparing it to price, can provide a useful tool to assess whether a token is over or undervalued.
It is also a more straightforward metric to implement versus onchain transaction volume, which can be challenging to measure accurately in USD terms. Addresses are measured as the number of unique sending and receiving addresses participating in transactions daily.
This makes it a relatively transparent metric as compared to onchain volume. However, there may be a question of the granularity of the data, and who controls these addresses. In the past the Waves network has exaggerated active address numbers through events like Airdrops (creating many new addresses that likely add little real value).
PMR signal tells quite a different from NVT signal and suggests that WAVES may be approaching an overbought inflection and further downward price movements, in spite of a difficult near-3 month period of price corrections. If this is the case, then WAVES may flirt with new long term bottoms because based on PMR, WAVES may still be short term overvalued based on number of active addresses.
Drivers of active addresses in the short term, may be new DApp based games launched on the blockchain using new Wave’s ‘Smart’ capabilities of and new users on the Waves DEX hoping to participate in new trading markets for upcoming ICO releases.
TAAR
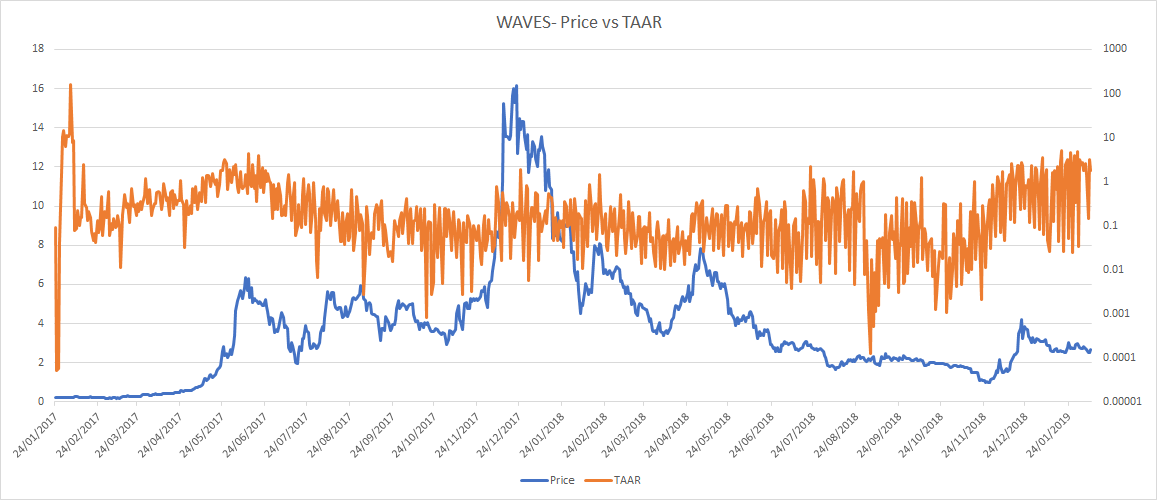
_WAVES TAAR and price. TAAR calculated with data from Coinmetrics.io. _
Network transaction volume to active addresses ratio or TAAR, is a recently developed equilibrium valuation metric from Pugilist Ventures’ Christopher Brookins. TAAR combines ”quantity and quality” of network activity into a single metric.
Fundamental expectations would suggest that when TAAR and price are closely distributed, price (valuation) and fundamentals are aligned in equilibrium.
The general pattern for WAVES’s TAAR compared to price since early-mid 2018 is that ‘quality’ dominates ‘quantity’. Or, that onchain volume is a greater driver of WAVES’s fundamental value as compared to the number of daily active addresses on the network.
This matches with NVT and PMR patterns, and suggest the relative immaturity of the Waves blockchain, given that network value and fundamentals are not aligned. This also suggests that speculative factors will be a greater driver of token value, versus network activity in the short run.
Technical Analysis
Moving Averages and Long Term Trends
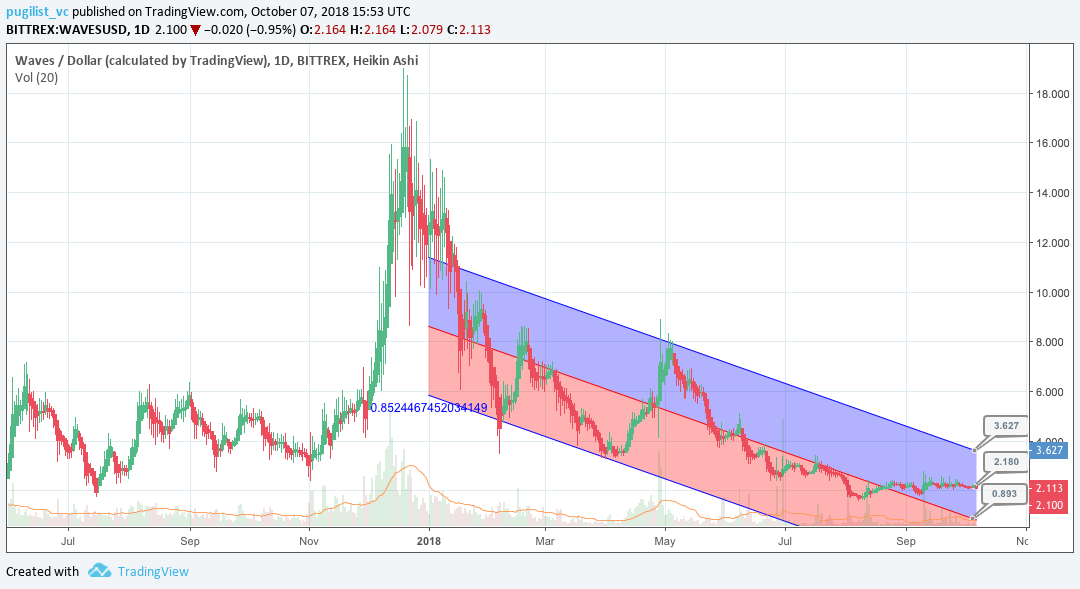
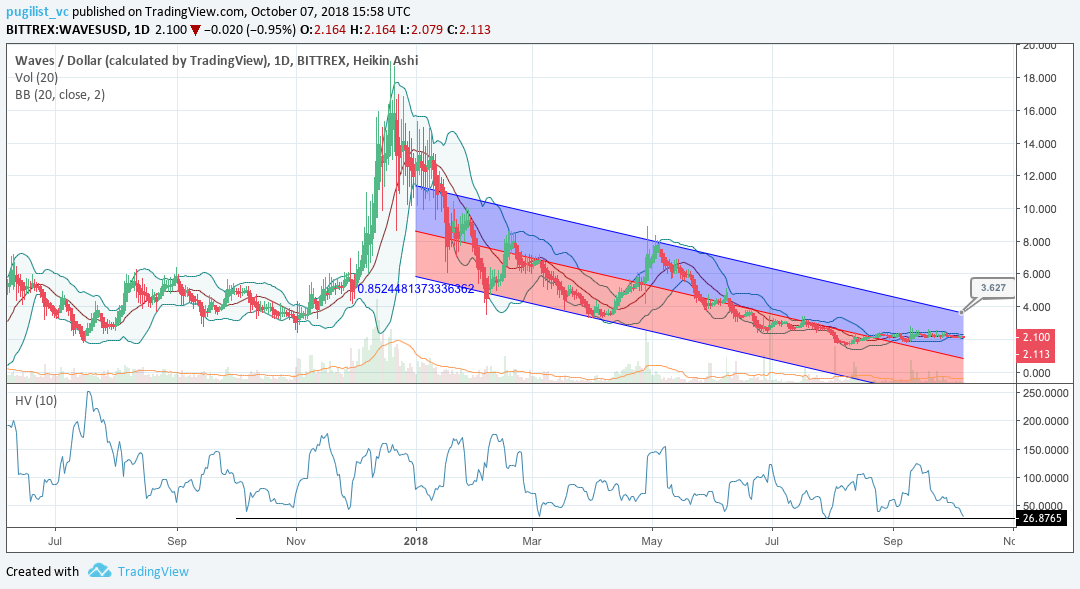
On the 1D chart, the golden cross, using the 50 and 200 day EMAs, has recently occurred, and both EMAs are currently acting as support near $2.73. Since the beginning of 2018, the price of WAVES has been contained within a negative linear price trend with a Pearson’s R Correlation between time and price of ~0.77 (not shown).
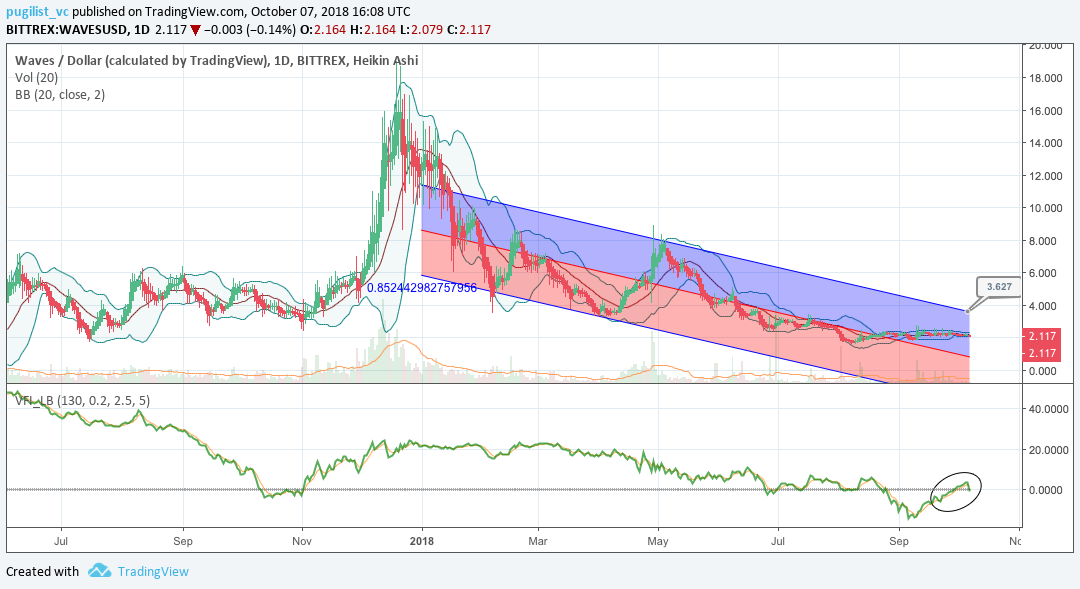
Additionally, the faster (15 period) and slower (30 period) TRIX oscillators both show positive momentum since late November with the slower TRIX still above 0 and faster TRIX plateauing near 0. Also, this positive price momentum can be seen in the volume flow indicator (VFI), which is currently holding above 0 level and slightly increasing. The VFI interpretation is a value above 0 is bullish and below 0 is bearish, with divergences between price and oscillator being high probability signals.
Lastly, price has bounced twice off of the 0.618 fibonacci retracement level, which might produce a double bottom. If so, price will need to break above the 0.5 fibonacci retracement level of $3.07 to continue with its uptrend back towards the $5.00 level.
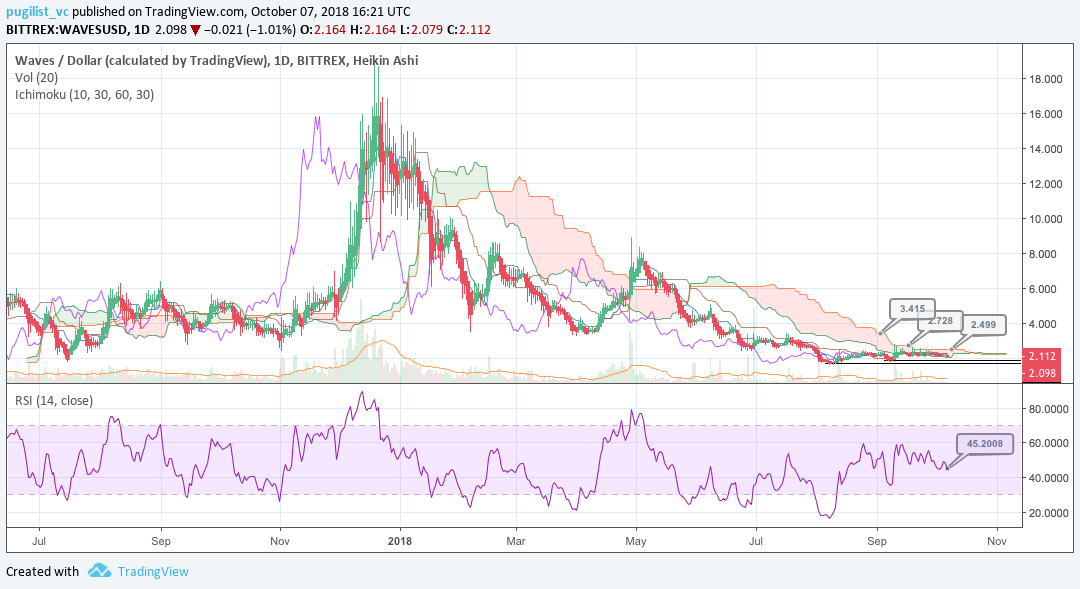
Ichimoku Clouds with Relative Strength Indicator (RSI)
The Ichimoku Cloud uses four metrics to determine if a trend exists; the current price in relation to the Cloud, the color of the Cloud (red for bearish, green for bullish), the Tenkan (T) and Kijun (K) cross, Lagging Span (Chikou), and Senkou Span (A & B).
The status of the current Cloud metrics on the 1D frame with singled settings (10/30/60/30) for quicker signals is mixed; price is below the Cloud, Cloud is bearish, the TK cross is bearish, and the Lagging Span is above the Cloud and touching price.
A traditional long entry would occur with a price break above the Cloud, known as a Kumo breakout, with price holding above the Cloud. From there, the trader would use either the Tenkan, Kijun, or Senkou A as their trailing stop.
On December 15, 2019, WAVES completed a Kumo breakout. Since then, price has fallen back beneath the Cloud. Currently, price has a 50/50 shot of re-completing a Kumo breakout given the RSI is not overbought (56) while holding near Senkou B resistance of $3.03. If price can break above Senkou B resistance, the price targets are $3.73, $4.00, and $4.65, while support levels are $2.50, $2.25, and $2.00
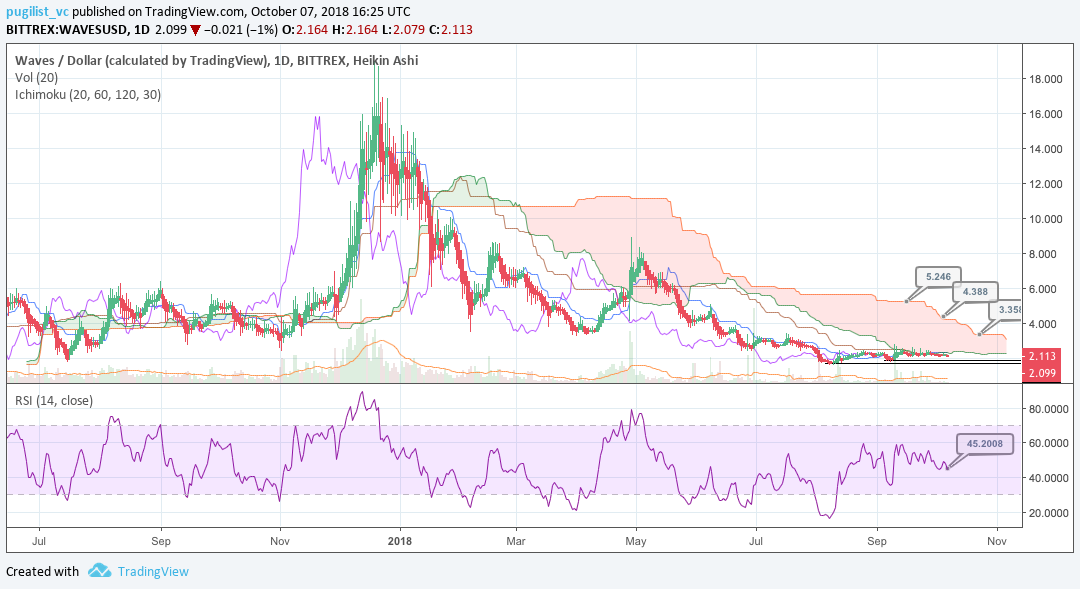
The status of the current Cloud metrics on the 1D time frame with doubled settings (20/60/120/30) for more accurate signals is mixed; price is below the Cloud, Cloud is bullish, the TK cross is bearish, and the Lagging Span is above the Cloud and touching price.
Using the slower settings, the technicals are almost identical to the faster settings.
Conclusion
Following an excellent Q4 2018, there have been ongoing price corrections in WAVES markets, with the price of the asset falling ~14% since the 1st of January. The long term growth of onchain transaction volume against token value, however, is a positive, emerging trend, and indicative of the growing fundamental value being built within the Waves ecosystem.
In the short term, value is likely to be driven by market speculation surrounding upcoming events such as the end of the ongoing VST token airdrop snapshot and exchange listings. There are some fundamental indications that WAVES may be oversold, which may also help the prices rise higher than expected if there is a wider ecosystem sentiment movements because of rising BTC prices and major news events like the Litecoin Mimblewimble integration.
The current technicals for WAVES are mixed and awaiting a breakout in either direction. Both, the prudent short term trader (10/30/60/30) and longer term trader (20/60/120/30), on the 1D chart, will await a positive TK cross and Kumo breakout above $3.03, before entering a long position. Both trader’s price targets and support levels are $3.73, $4.00, and $4.65, and $2.50, $2.25, and $2.00, respectively.
 Planning your 2024 crypto-media spend? Brave New Coin’s combined website, podcast, newsletters and YouTube channel deliver over 500,000 brand impressions a month to engaged crypto fans worldwide.
Don’t miss out – Find out more today


