Bitcoin Price Analysis — Calm before the storm
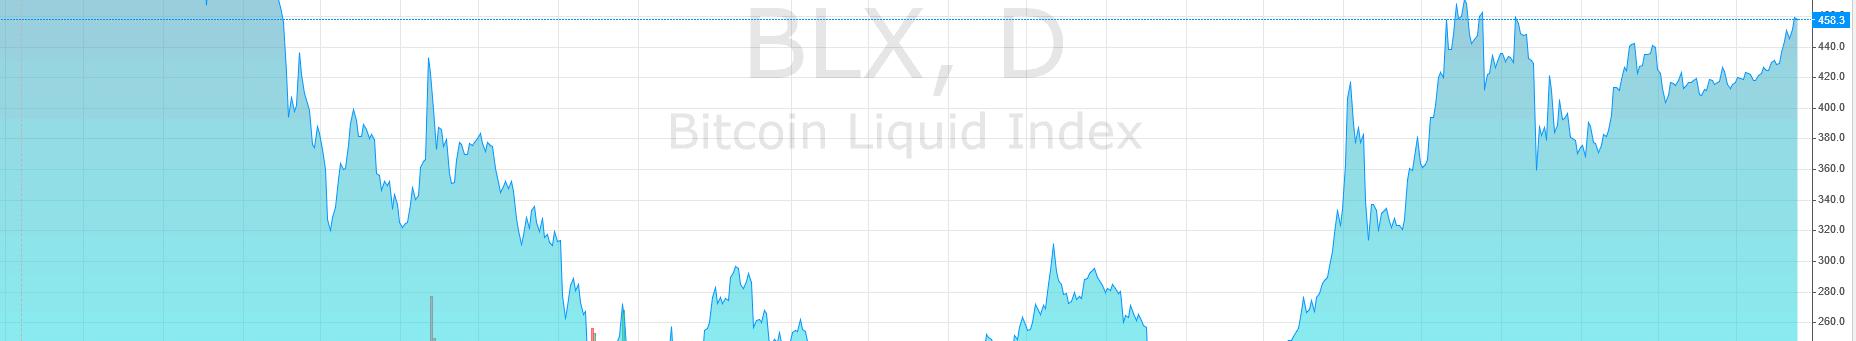
The technical setups posted below use simple trend detection, support and resistance, channels, pattern and candle analysis. We aim for high-probability trade setups on BTCUSD and use very few indicators. All charts use BNC’s Bitcoin Liquid Index for maximum accuracy.
The timeframe for trades is 1 to 7 days, so we’ll use 4h candlesticks. Bitcoin is best traded as a purely speculative commodity on 4h+ timeframes.
The technical setups posted below use simple trend detection, support and resistance, channels, pattern and candle analysis. We aim for high-probability trade setups on BTCUSD and use very few indicators. All charts use BNC’s Bitcoin Liquid Index API for maximum accuracy.
The timeframe for trades is 1 to 7 days, so we’ll use 4h candlesticks. Bitcoin is best traded as a purely speculative commodity on 4h+ timeframes.
Market Sentiment
This section is based on internal (anonymized) Whaleclub trading data and is published exclusively on BNC.
Current Active Long vs Short Volume Ratio: 5.15:1
Average Active Long vs Short Volume Ratio: 2.6:1
We have a major excess in active long volume relative to the average. Market sentiment is overwhelmingly bullish and has been so for a while now, with bulls coming in to sustain and “buy the dip” that occurred between $470 to $435.
The average weighted long entry price is $461.88, which means that on average, active longs are in the red (losing). This entry price is relatively high and indicates that many players are still holding on to the long positions they entered in the top area, around $470. This makes sense as BTCUSD has been range bound for the last week.
As we explain below, this market dynamic presents a perfect long squeeze setup which could fuel further downside.
Traders who are currently long will be left either margin called or forced to close their positions at a loss, triggering a selling cascade. Long position volumes are very high, which signals that the risk of another brutal price dump is higher than average, should those positions be squeezed.
Macro Key Points
This section is an overview of news headlines or events that may affect BTCUSD.
-
Craig Wright coming out as Satoshi dominated news headlines this week. Interestingly, this had little effect on price. The controversy surrounding the “proof” he provided did however catapult bitcoin into the spotlight in the mainstream media.
-
The bitcoin block reward halving is estimated to occur on July 10, 2016, in about 10 weeks. The supply will halve – and assuming demand remains the same, the post-halving value per bitcoin is over $900. Extrapolating this based on the current market price, the present value of one bitcoin is around $230 – an attractive entry price.
Technical Analysis
4h+ Timeframe Setup
Since last week’s strong breakout and subsequent pullback, bitcoin price has been ranging, unsurprisingly. Markets tend to take a “breather” after periods of strong trending. Let’s review the general market setup on the daily.

After price broke over our green resisting trendline, it retouched it and bounced strongly. Since then, it has traded well above our resistance trendline, confirming that it is now serving as price support. This is a bullish sign: bulls who missed the breakout were more than happy to buoy the market by buying around the breakout price, and this buying is ongoing.
This week we also detect the presence of a second supporting trendline (dotted below).

The higher lows we’ve been making over the past few months have resulted in a “pop” in price above not one resistance level, but two. This once again signals that the breakout is strong and likely here to stay (not a “fakeout”).
Our crossing trendlines have formed a market inflection point above which price is trading. Inflection points are generally very strong support (or resistance) areas – and in our case, give us confidence in the solidity of price support.
Now let’s take a look at our horizontal support and resistance levels.

We observe that price is trapped between very strong support and very strong resistance (historically attractive sell prices). As a general rule of thumb, horizontal levels are more influential than non-horizontal trendlines, so it pays to observe these closely. Price is ranging between the $440 and $470 areas.
Now let’s switch to the 4h timeframe to dig a little deeper. Our daily trend lines, support, and resistance levels are preserved.

We observe that post-breakout, price has made higher highs and the bears have failed to bring price down. We also observe a relatively high-volume price pump that retraced half of the pullback from $470.
Although this may seem bullish to some observers, price is still ranging within the $440-$470 band we identified. Until it breaks out from this band, it will be difficult to settle on a trend direction.
Below we outline possible trade ideas.
Trade Ideas

Our multiple support areas would serve to buoy price upwards. Slowly but surely, price builds up the pressure needed to break past historically attractive sell areas: $470, $475, and beyond.

Our bearish scenario involves a measured move that would break below our newly formed inflection point. Measured moves are the single most destructive market structures – almost nothing stands in their way.
The reason they are so strong is because they are based on underlying market dynamics. We want to keep in mind that market players are overwhelmingly long. All these longs can serve as good fuel for such a measured move as additional buying power dries up at these high price levels.
It only takes a few large and smart players to start selling to push price down against a market that is out of buying power. The resulting dumps can be aggressive.

This bearish measured move could have a lasting impact on price. Our supporting inflection point suddenly becomes resisting. The formation of a double top with lower second top at $470 and $460 respectively would result in a standard and reliable bearish formation.
Disclaimer: The information presented in this article is general information only. Information provided on, and available from, this website does not constitute any investment recommendation.
Petar Zivkovski has a Master’s Degree in Mathematics and Computer Science. He spent 10 years trading for BlackRock before assuming his current role as the director of operations at Whaleclub.
 Planning your 2024 crypto-media spend? Brave New Coin’s combined website, podcast, newsletters and YouTube channel deliver over 500,000 brand impressions a month to engaged crypto fans worldwide.
Don’t miss out – Find out more today


