Bitcoin Price Analysis: Week of July 2

The news out of Greece continues to dominate financial headlines and even the mainstream media is starting to pick up the rumors that this default is driving the Bitcoin rally.
Market Thoughts
The news out of Greece continues to dominate financial headlines and even the mainstream media is starting to pick up the rumors that this default is driving the Bitcoin rally. Fox Business, Financial Times and CNN Money have all reported on the connection. The CNN article hits the nail on the head with the following statement:
“First, it’s incredibly difficult to obtain bitcoins. There’s a single Bitcoin ATM in all of Greece — at a bookstore in Athens. And the most common method — buying them in an online marketplace — requires sending a wire transfer from a bank. But banks in Greece are closed.”
In general, bitcoins are difficult to acquire. In order to purchase them at market price, you would have to go through a banking style KYC/AML process. This, in a way, partially defeats any attempt to protect wealth by running to Bitcoin in a time of need. Acquiring bitcoins using cash comes with a hefty anonymity premium, even in some of the most liquid markets like New York or San Francisco. The situation in Greece compounds both of these intricacies with closed banks, restricting transfers to bitcoin exchanges, and capital controls, restricting the cash available for person to person bitcoin transactions.
Articles in the media also mention a large increase in Greeks participating on exchanges like Coinbase in the US, Bitcoin.de in Germany, and Bitcurex in Poland. These values are quoted in percentages, and are not very useful because a baseline of users prior to this crisis is not provided. A 300% relative increase is hard to quantify without the relative starting point.
Looking back on the huge rise in bitcoins price during 2013, coinciding with the Cyprus banking shutdown, it is perfectly understandable that the media is jumping on this apparent correlation once again. There is probably some truth to it, and some Greeks are looking at Bitcoin as an option.
The disproportionately low volume on this 10% rise in price suggests that it’s speculation on a potential move from Euros into Bitcoin in the near future, and traders looking to capitalize on a move similar to the one we saw in 2013.
The biggest thing to take away from this Greek situation is that people have been getting ready for this banking shutdown and the bank withdrawals leading up to.

Depositors have been withdrawing cash at an incredible rate. Below is a table from the beginning of June, ending just days before the bank shutdown on June 28. The table shows estimates were as high as 1.6 Million Euros leaving Greek banks per day. So that figure of 1.2 Billion Euro on deposit is probably down closer to 1 Billion by now.

The good news is that people in Europe are starting to understand the consequences, and are lining up at the ATM’s early. Portugal, Italy, Spain and even France and Germany are starting to take notice. Perhaps the people of those countries will be a bit more aware of bitcoin as a safe haven, before central authorities reduce the avenues of escape.
Unlike bank deposits on paper, cash in hand needs a place to land. While most of it will be used in other ways, some of it will find it’s way to purchase Precious Metals and Bitcoin.
Bitcoin has a few things going for it over Gold and Silver, it can actually be used to move your wealth abroad. The weight, and metal detectors, make this difficult with precious metals. If we have officially turned the corner in the price, buyers might rush. The Fear Of Missing Out may well drive another 2013 style bubble.
Government controls are starting to cripple what people can do with their money, especially cash. This will be the major development in economics over the next decade. We will explore these concepts in detail in upcoming articles.
Market Outlook
The technical picture in the price of Bitcoin has certainly improved.
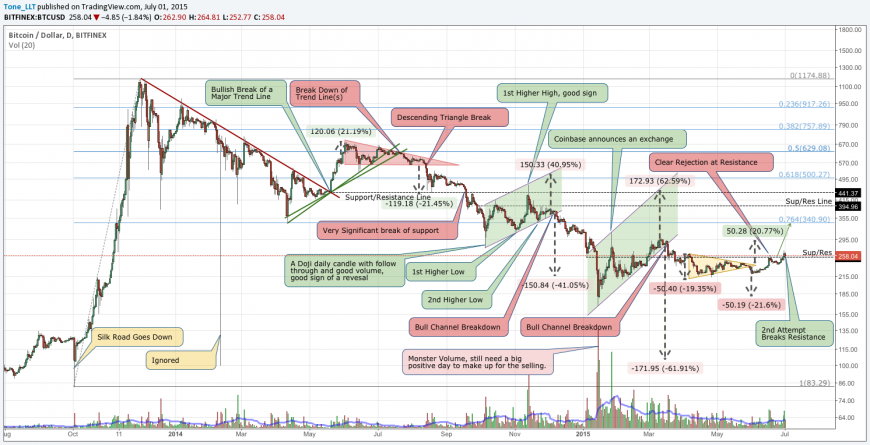
Regular readers will notice the changes on the chart from last week. The big down arrow has been removed as this can now be considered a confirmed breakout. What looked like a breakdown from the Symmetric Triangle, in yellow, was a bit of a head fake.
We can now look for a target around $300 based on the same triangle. Symmetric Triangles usually do not imply direction, you just have to wait and see which way they break, but they do hint on profit targets. In addition, the next major resistance level is around $340, which is both a Fibonacci line and a significant low back in 2014.
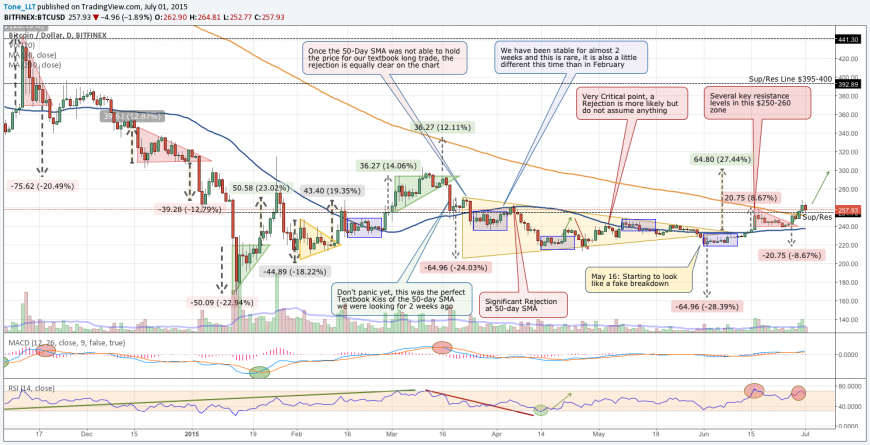
The zoomed in view is painting a really rosy picture, though the lack of volume is a little worrisome. We have officially spent two days above the 200-Day Simple Moving Average, which is excellent. Keep in mind that many traders use Exponential Moving Averages and those put resistance closer to $270.
We have also pulled back from the initial up move, and even though it would have been nice to come down into the 230’s, the fall to $240 is sufficient enough to be considered a hit of the 50 Day SMA, the blue line.
We can now seen an upward break, past resistance, making a new high. On an Intraday basis have also pulled back down to the 200-Day SMA, for a retest. The obvious direction from here based on the chart is up, and the first target is $300. Of course nothing is expected in one day and we can definitely see a pullback or two along the way.
So what are some of the things to still be concerned about? For starters, we would really like to see a moving average cross where the 50-Day goes above the 20-Day. This is not expected for another week or two, even if we do go up from here quickly.
A bigger concern is the RSI, which is once again overbought, and never worked off the earlier overbought condition. If yesterday was the high for the near future at $269, then there is a clear divergence between price and RSI, with the price making a higher high and RSI making a lower high.
Final Thoughts
Last week we went through the anatomy of a trend change and today we can say that on a short-term daily scale, the trend change has been achieved. Nothing of course is ever certain, but price does not lie. We can apply the points in chart below as:
Point 1: $240
Point 2: $240 after hitting a high of $259
Point 3: $261

Yes, it would have been nice to see Point 2 at a lower price for more people to recognize this pattern and better prepare for a potential breakout, but it still fits a textbook definition.
Will it continue the same way as in that picture? Only time will tell.
This article was completed on Wednesday July 1 8:00 pm ET, when BraveNewCoins Index showed Bitcoin price at $258 USD. Tone Vays will be a speaker at the upcoming Inside Bitcoins Chicago Conference July 10-11.
Disclaimer: The price projections above are just the opinions of one trader. It is meant as a guide, or fresh look, to supplement the reader’s personal views on bitcoin. Trading in general (but especially Bitcoin) is incredibly risky and should only be done with capital one can afford to lose. The Author is a trader and does take on small position in the manner suggested in the article.
 Planning your 2024 crypto-media spend? Brave New Coin’s combined website, podcast, newsletters and YouTube channel deliver over 500,000 brand impressions a month to engaged crypto fans worldwide.
Don’t miss out – Find out more today


