DOGE price analysis: You can’t keep a good dog down

Like most digital assets, Dogecoin lost significant value during 2018’s bear market. However, DOGE has survived challenging external market conditions before – and driven by some idiosyncratic design decisions remains a stand out alt-coin across a number of fundamental metrics.
Dogecoin (DOGE) is crypto’s most recognizable and popular memecoin, which derives its name from 2013’s Shiba inu meme. It was originally conceived by developer Jackson Palmer as satire, mocking the sudden emergence of often low quality blockchain projects littering the ecosystem 5 years ago, and the exaggerated valuations these projects received at the time.
Currently ranked 24th by market cap, DOGE, alongside the rest of the digital asset sector, has suffered from a sharp drop in value during 2018’s bear market. Its price is currently down ~88% from an all time high hit in early January 2018 and it currently trades at ~$0.002.
DOGE has bounced back from similar downturns in the past primarily due to some fundamental advantages over its competitors.
For example, DOGE has always delivered fast block times and low fees.— being consistently quicker & cheaper than Bitcoin, Litecoin, Dash and many other alternative digital currencies.
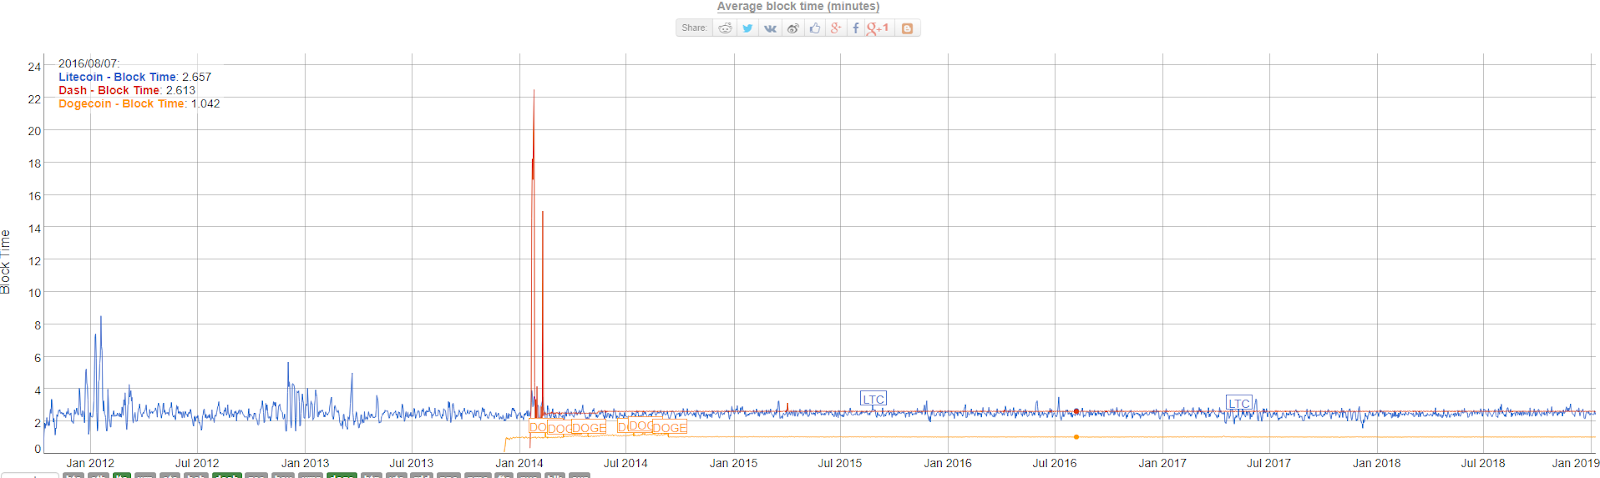
Source: Bitinfocharts.com
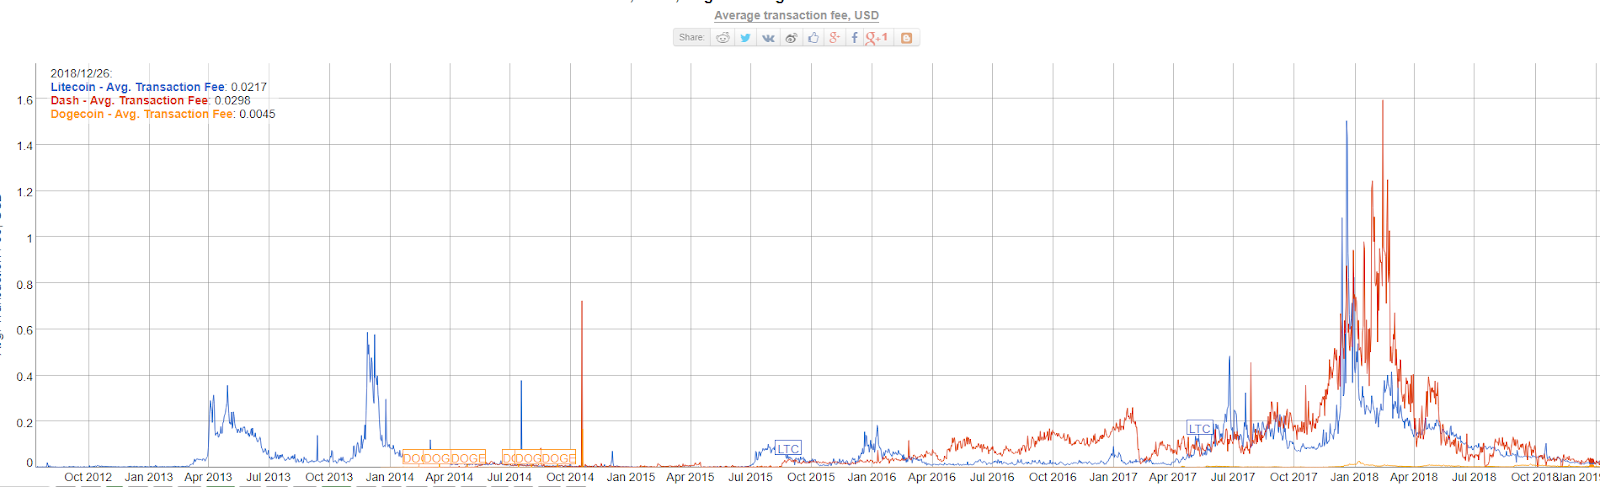
Source: Bitinfocharts.com
The Dogecoin blockchain has historic popularity as a micropayment and community driven fundraising platform. There are a wide range of online merchants and vendors accepting DOGE for payments and the Dogecoin community is known for its frequent group charity initiatives including a raise of US $50,000 to aid the Jamaican Bobsled team for a trip to the Sochi winter Olympics, US $30,000 for world water day in 2014 and US $55,000 to sponsor NASCAR driver Josh Wise.
DOGE may not have the same long term store-of-value appeal as some other tokens but the blockchain functions efficiently within its own preset restrictions. The network has a large total token supply of 117,765,025,366 DOGE and no fixed limit (inflation currently ~1.2%), a deliberate tokenomics decision in order to keep the price of each individual token low.
An original intention for DOGE was to become an online tipping medium to leave small appreciation gifts for reddit comments, youtube videos and charity initiatives, so small individual token denominations support this utility
Exchanges and trading pairs
The most popular trading pairs for DOGE are crypto-to-crypto with the USDT, BTC and ETH markets making up over 80% of daily trading volume. The USD amount for total DOGE trading in the most popular Tether market is ~$9.9 million.
The 4th most popular pair is the fiat on-ramp US dollar option offered by exchange like p2pb2b. It trades at a significant premium to the 3 top pairs.
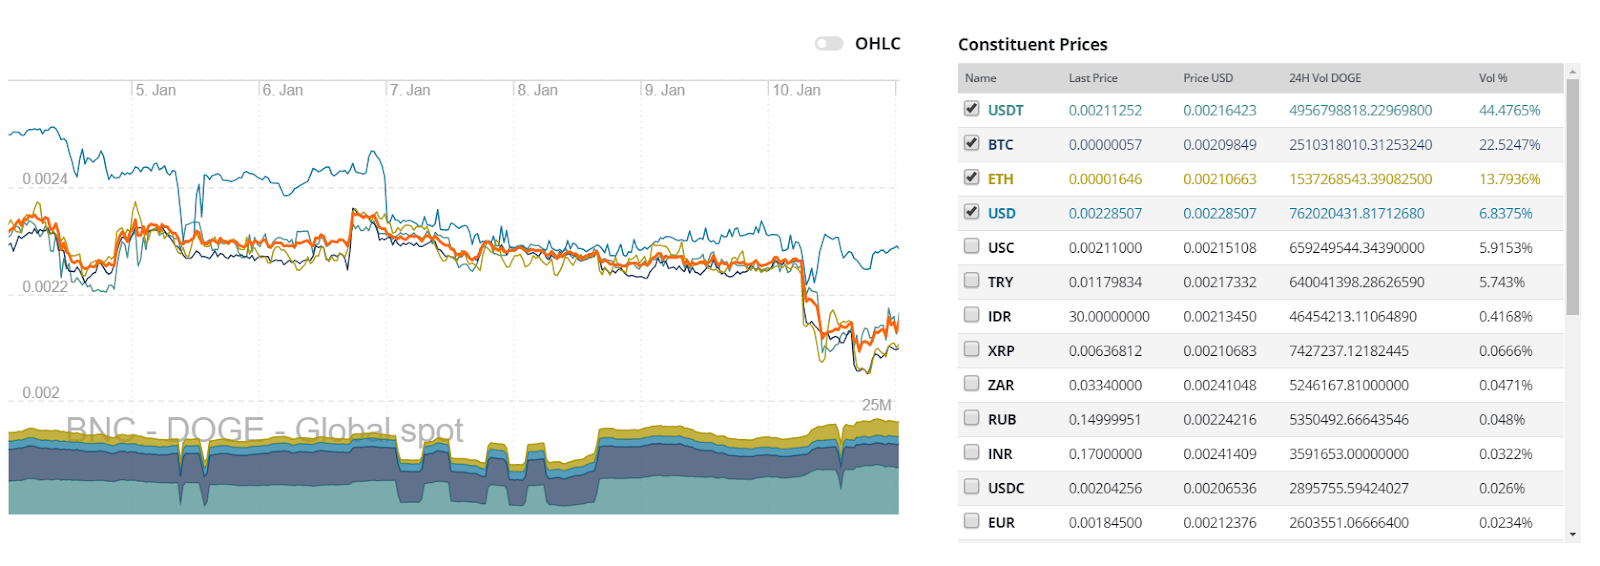
DOGE most popular pairs and 7 day price chart. Source: Bravenewcoin.com
The most traded marketplace for DOGE is DOGE/USDT market offered by Seychelles- based AEX. Bitforex operates the next two most popular markets with its own DOGE/USDT market and a DOGE/ETH market.

Technology
Dogecoin was created as a fork of PoW Luckycoin, which in itself is a fork of Litecoin. DOGE uses the same scrypt algorithm as Litecoin, which was initially designed to be an ASIC-resistant alternative to the Bitcoin blockchain, but in 2014 the algorithm became ASIC minable.
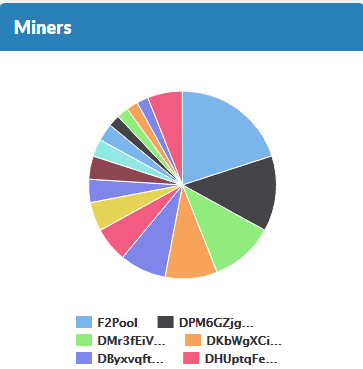
Four main groups dominate hash power in the network (53%) with major mining operation f2pool, which also mines BTC, XEC and Ethereum based hashing algorithms, controlling the biggest chunk of hashrate at 20%.
https://dogechain.info/
Because of concerns surrounding a potential 51% attack, Litecoin founder Charlie Lee proposed a merged mining solution between Litecoin and Dogecoin, which would allow both chains to be mined simultaneously because they both operate with the same hashing algorithm. The fork that initiated the merged mining solution was implemented on block 371337, around mid-September 2014.
Immediately before the fork, the hash power on the Litecoin network was around 14 times more than that of the Dogecoin network (821 Gh/s vs 77Gh/s, 8th September 2014). This gap has shrunk significantly since the merged mining update, allowing the hash rate on the Dogecoin chain to scale significantly. Litecoin’s hash rate is currently just ~1.2 times higher than Dogecoin’s, 174 Th/s vs 143Th/s. Both networks have observed a significant fall in hashrate in the second half of 2018, as block rewards have fallen along with token price.
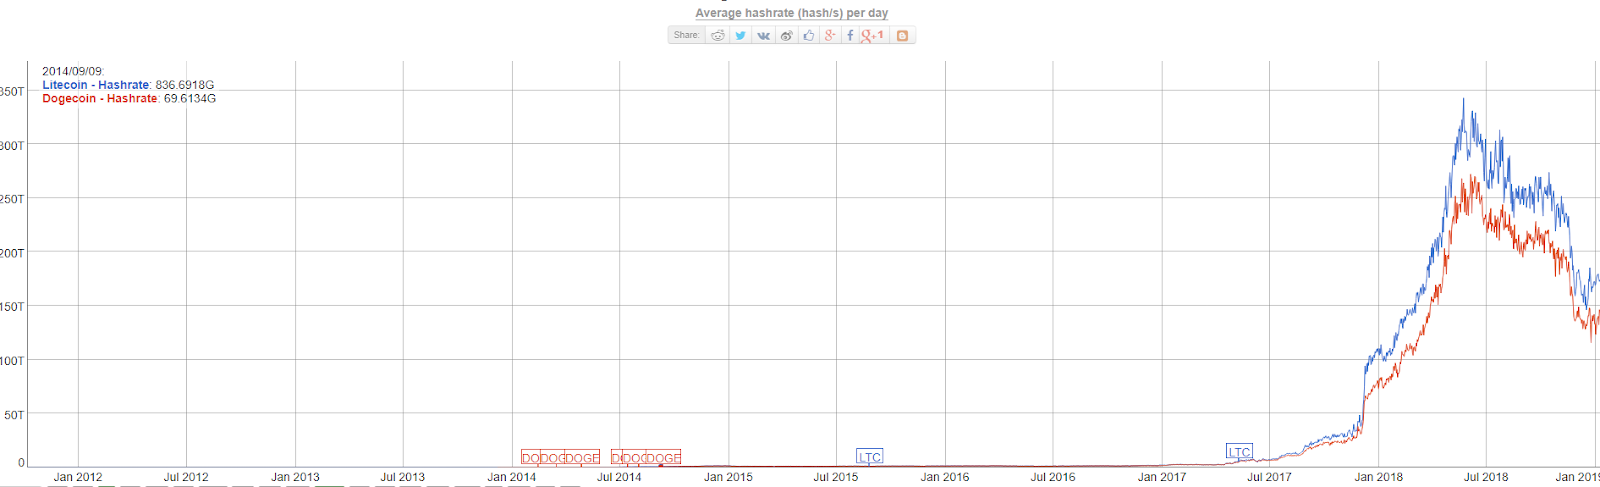
https://bitinfocharts.com/comparison/hashrate-ltc-doge.html
Onchain metrics
NVT signal
Derived from the NVT ratio, the NVT signal is a responsive blockchain valuation metric developed by Willy Woo and Dmitriy Kalichkin. Crypto markets are prone to bubbles of speculative purchasing, not backed up by underlying network performance and activity. The NVT signal provides some insight into what stage of this price cycle a token may be in.
A high NVT signal is indicative of a network that is going through one of these bubble periods, and may move towards a position of becoming overbought/overvalued, because of the market’s speculative assessments running out of steam.
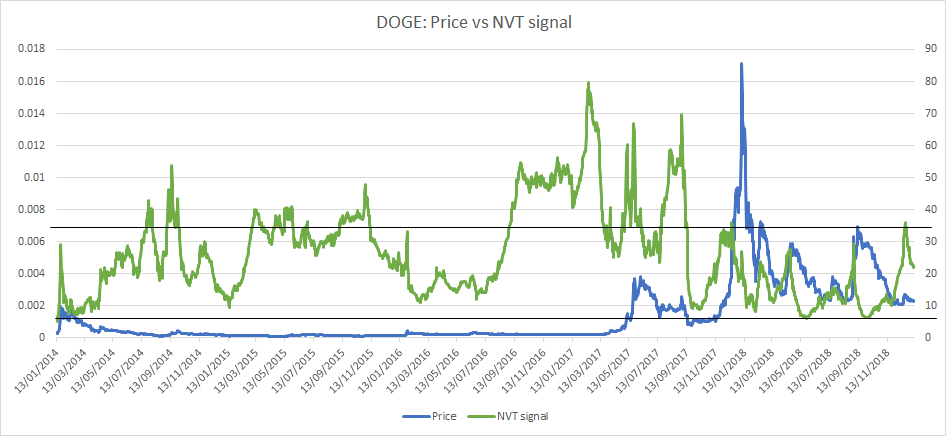
DOGE NVT signal and price. NVT signal calculated with data from Coinmetrics.io. Adjusted onchain transaction volume used for NVT signal
DOGE’s NVT has maintained a stable range between a ~10 to ~35 points since the second half of 2017. DOGE has likely maintained historically consistent network activity because of an enthusiastic, sticky holder community idiosyncratic from typical trader driven altcoin networks.
For an extended time period, from June/July 2016 through to the first half of 2017, the NVT signal for DOGE sat well above the historically indicated undersold threshold, indicating that for this long period, DOGE was overvalued based on on-chain transaction volume.
Because Dogecoin is a micro-transaction driven network, with primary utility for DOGE being as a low fee, tip focused medium-of exchange, designed to be denominated in small units, total transaction volume is always likely to be a less impressive metric than transaction count for the network.
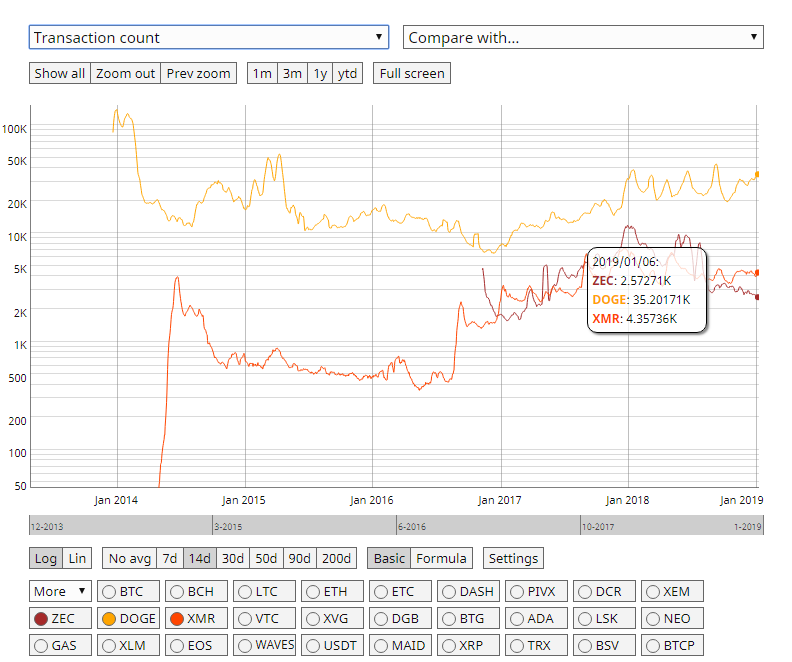
DOGE currently handles at least 5-10 times the number of daily transactions as the ZEC and Monero networks. Source coinmetrics.io
However, volume is more indicative of tangible economic value than transaction count, and as such is a more reflexive indicator of token value.
The NVT signal for DOGE has recently bounced following an oversold inflection point and this may put downward pressure on price until another oversold point is hit. Recent sell-offs in crypto markets on 10/01/2019 may hurry this process and driving a pushback of fundamental pressure onto price.
PMR
Metcalfe’s law is a measure of connections in a network, as established by Robert Metcalfe the founder of Ethernet. It has subsequently been used to analyze the true value of network-based financial products like Facebook and Bitcoin, and by comparing it to price, can provide a useful tool to assess whether a token is over or undervalued.
It is also a more straightforward metric to implement versus onchain transaction volume, which can be challenging to measure accurately in USD terms. Addresses are measured as the number of unique sending and receiving addresses participating in transactions daily.
This makes it a relatively transparent metric as compared to onchain volume. However, there may be a question of the granularity of the data, and who controls these addresses.
Because of the design and fundamental structure of the Dogecoin network, Active addresses like transaction count, is historically a more bullish metric for fundamental network value than onchain volume.
PMR has been negative in natural log points since genesis of the Dogecoin network, meaning Metcalfe’s law (network connections) has always exceeded the market cap of DOGE, pointing to long term undervaluation. In 2018, the average number of daily active addresses on the Dogecoin network was ~68,983.
In the short run, the PMR signal for DOGE appears to be close to hitting a historically indicated oversold inflection. Sell-offs triggered by market wide uncertainty or a short term growth in active addresses may trigger a reversal which could trigger a short term period of strong price performance for DOGE.
PMR appears to move far more closely and is more connected to the valuation of DOGE than NVT signal (a correlation of 0.68 with price vs 0.02 with price for NVT signal), and as such appears to be a more bankable indicator for short term valuation.
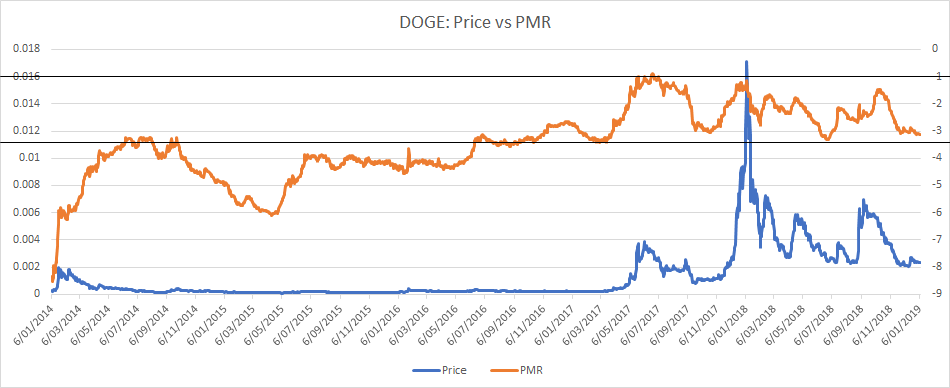
DOGE Kalichkin PMR and price. PMR calculated with data from Coinmetrics.io.
Network transaction volume to active addresses ratio (TAAR)
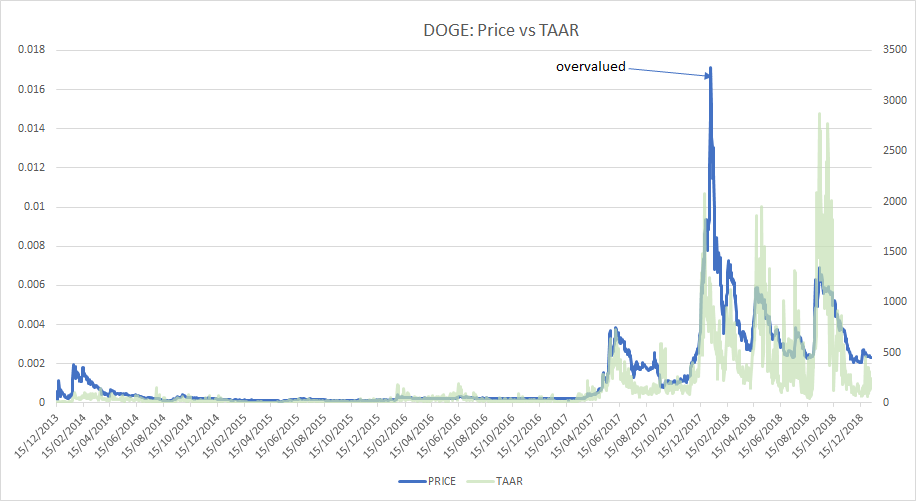
DOGE TAAR and price. TAAR calculated with data from Coinmetrics.io.
Network transaction volume to active addresses ratio or TAAR, is a recently developed equilibrium valuation metric from Pugilist Ventures’ Christopher Brookins. TAAR combines ”quantity and quality” of network network activity into a single metric.
Fundamental expectations would suggest that when TAAR and price are closely distributed, price (valuation) and fundamentals are aligned in equilibrium. TAAR indicators suggest that during the height of the bull market in 2017 DOGE was overvalued by speculators.
Since the height of the bull run and subsequent value collapse of DOGE and the wider ecosystem, TAAR and price have more close aligned. During periods in the last year TAAR has sent signals that DOGE may be undervalued, crossing past price on a few occasions. In recent months the TAAR of DOGE has been just underneath price, indicating a short-term evaluation that the network has returned to a position of overvaluation, albeit only marginally.
The TAAR for DOGE appears to be reversing upwards beginning in the second half of December following a period of downward movements. In a few instances in the token’s history, periods immediately following TAAR reversals have coincided with sharp upward price and TAAR runs. This recent period of TAAR volatility may be an indicator of an upcoming spike in fundamental activity which is likely to feed back into price.
Technical analysis
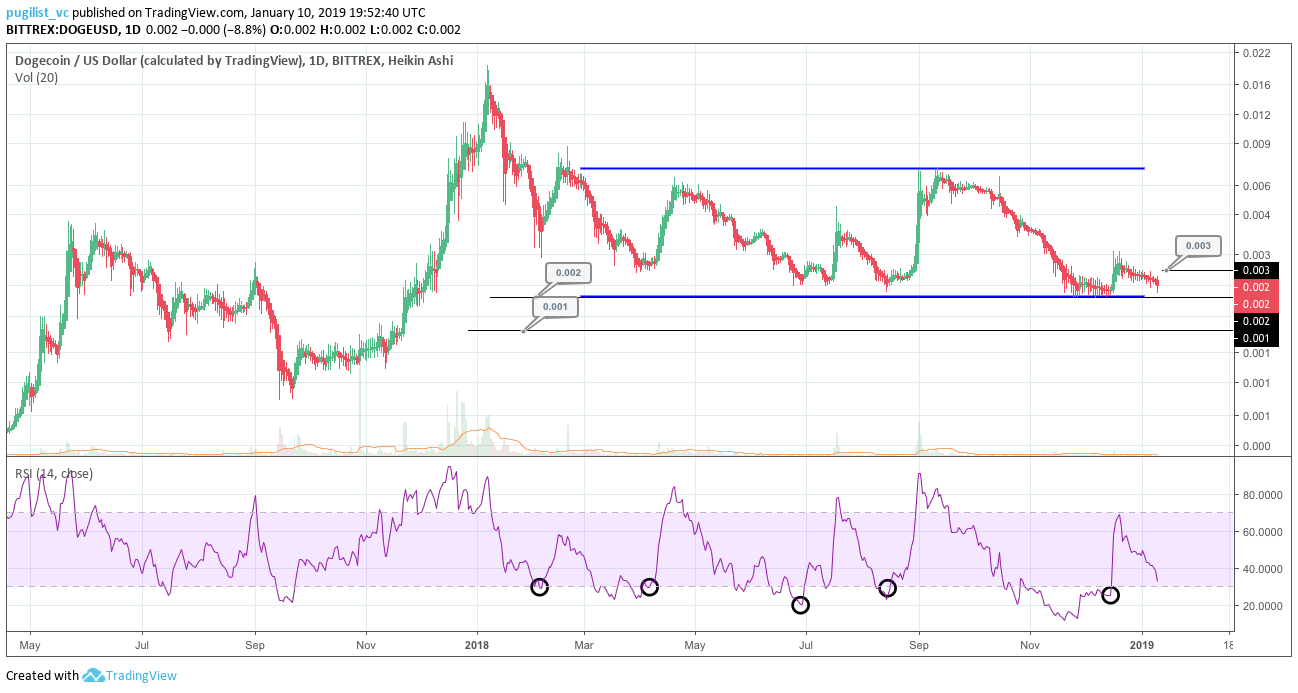
Regression Channel and Long Term Trends
On the 1D chart, the death cross, using the 50 and 200 day EMAs, occurred in mid-November 2018 and persists. The 50 day EMA (red line) is currently acting as resistance around the $0.0026 level.
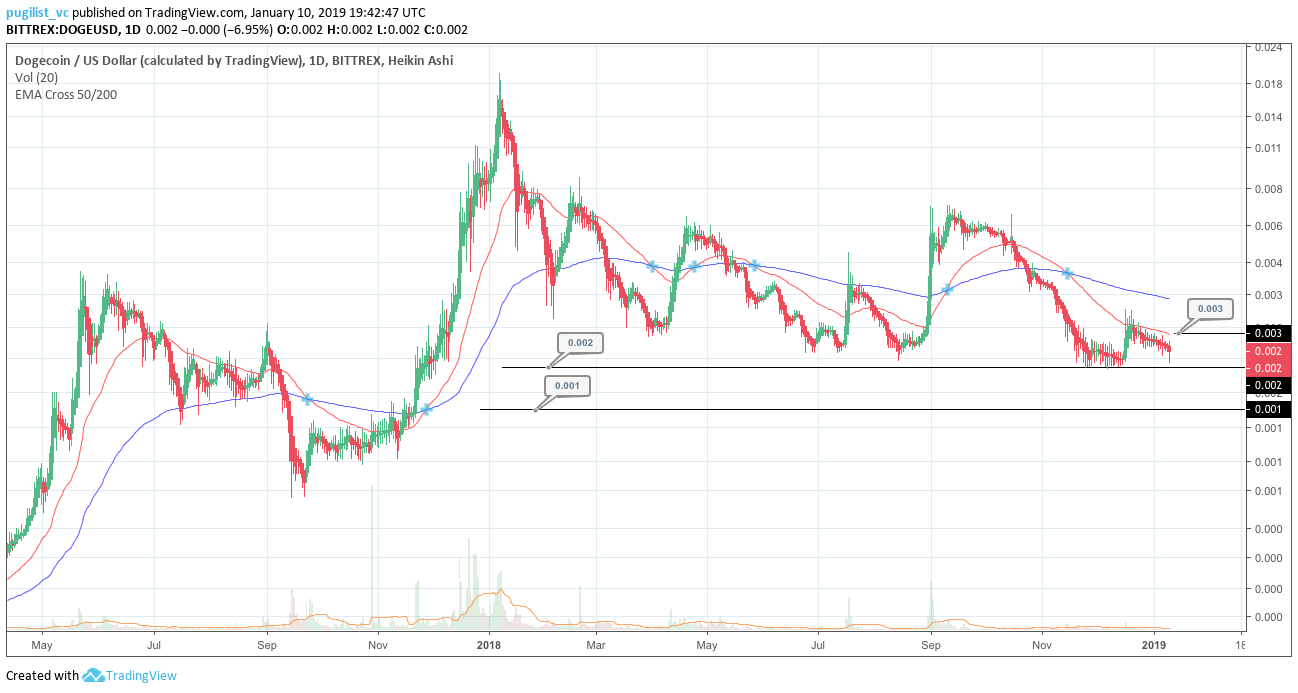
Since the beginning of 2018, the price of DOGE has been contained within a negative linear price trend with a Pearson’s R Correlation between time and price of ~0.59 (not shown). Despite periodic price recoveries and less damage in 2018 compared to other alt-coins, positive price movement has typically only coincided with oversold levels on RSI (black circles). Additionally, price has consistently ranged traded between $0.002 and $0.007 (blue lines) with a slight bias to the downside.
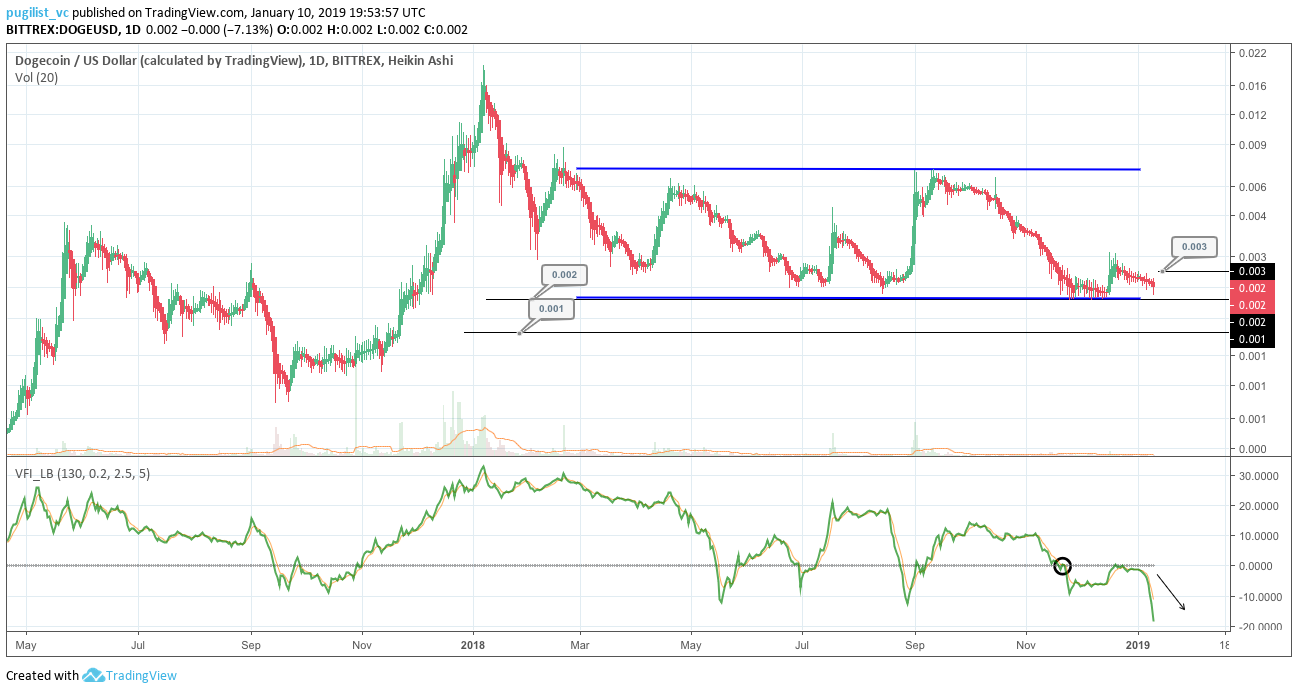
Additionally, the volume flow indicator (VFI) went beneath 0 back in late-November (black circle) 2018 and recently took a nosedive (black arrow), which visualizes the dramatic decline in buying volume for DOGE recently. The VFI interpretation is a value above 0 is bullish and below 0 is bearish, with divergences between price and oscillator being high probability signals.
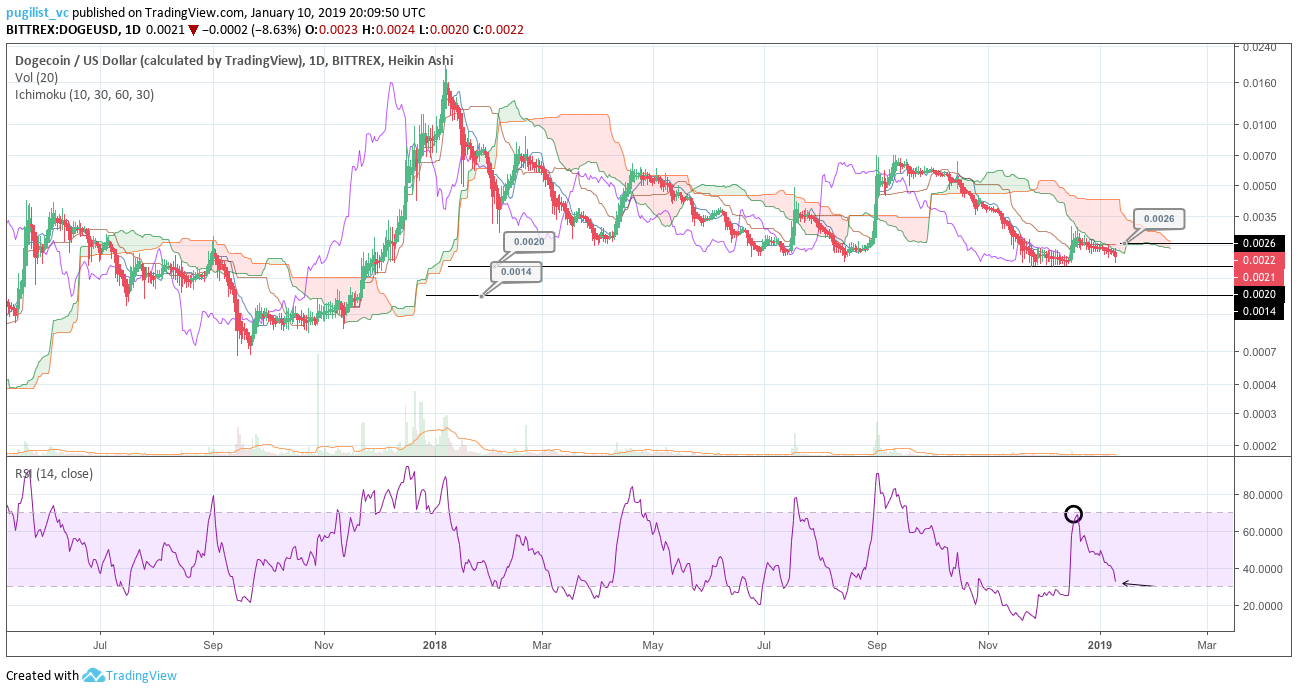
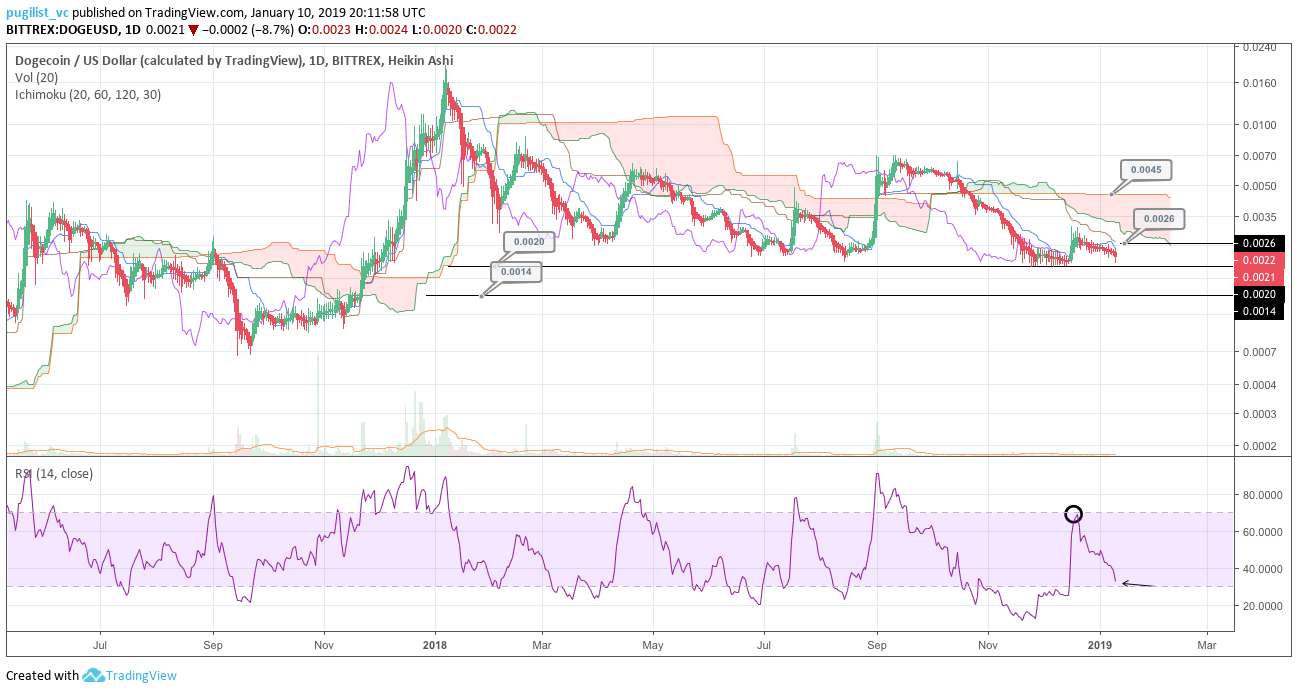
Ichimoku Clouds with Relative Strength Indicator (RSI)
The Ichimoku Cloud uses four metrics to determine if a trend exists; the current price in relation to the Cloud, the color of the Cloud (red for bearish, green for bullish), the Tenkan (T) and Kijun (K) cross, Lagging Span (Chikou), and Senkou Span (A & B).
The status of the current Cloud metrics on the 1D frame with singled settings (10/30/60/30) for quicker signals is bearish; price is beneath the Cloud, Cloud is bearish, the TK cross is bearish, and the Lagging Span is beneath the Cloud and touching price.
A traditional long entry would occur with a price break above the Cloud, known as a Kumo breakout, with price holding above the Cloud. From there, the trader would use either the Tenkan, Kijun, or Senkou A as their trailing stop.
DOGE is currently sitting at $0.0022 and attempting a Kumo breakout. Price recently bounced from its December 15, 2018 lows around $0.002 to touch the Senkou A resistance around $0.0029, which coincided with RSI touching overbought territory of 70 (black circle). Since then, price has steadily declined and seems destined to retest $0.002. The positive note is that RSI is re-entering oversold territory of 30 (black arrow), which may provide a boost for an additional Kumo breakout attempt. If so, the Senkou A resistance level is $0.0024 and the level to breach above being $0.0029 with price targets of $0.0035 and $0.004. Price support levels are $0.0014 and $0.002.
The status of the current Cloud metrics on the 1D time frame with doubled settings (20/60/120/30) for more accurate signals is bearish; price is below the Cloud, Cloud is bearish, the TK cross is bearish, and the Lagging Span is beneath the Cloud and touching price.
The odds of a successful Kumo breakout are far smaller using slower settings with price needing to break and hold above $0.0045 (flat Senkou B). The resulting upside price targets would be $0.0055 and $0.007.
Conclusion
DOGE may have started as a joke but the network’s ability to retain a consistent flow of transactions at a low fee with high speeds has ensured its place in the crypto market cap top 25.
The long term technicals for DOGE are mixed and bearish, but have proven more resilient than other alt-coins in 2018. This resilience appears to persist into 2019, but buying volume is significantly wanning.
Price seems destined to re-test the $0.002 support level which will likely coincide with RSI entering oversold territory. Both, the prudent short term trader (10/30/60/30) and longer term trader (20/60/120/30), on the 1D chart, will await a positive TK cross and Kumo breakout above $0.0029 and $0.0045, respectively, before entering a long position.
Both trader’s support levels are $0.0014 and $0.002. In the unlikely event of a breakout, the (10/30/60/30) trader’s price targets are $0.0035 and $0.004 and the (20/60/120/30) price targets are $0.0055 and $0.007.
 Planning your 2024 crypto-media spend? Brave New Coin’s combined website, podcast, newsletters and YouTube channel deliver over 500,000 brand impressions a month to engaged crypto fans worldwide.
Don’t miss out – Find out more today


