

Zcash (ZEC) Price Prediction: Relief Rally Faces $1,288 Resistance as Head-and-Shoulders Pattern Signals Correction Risk
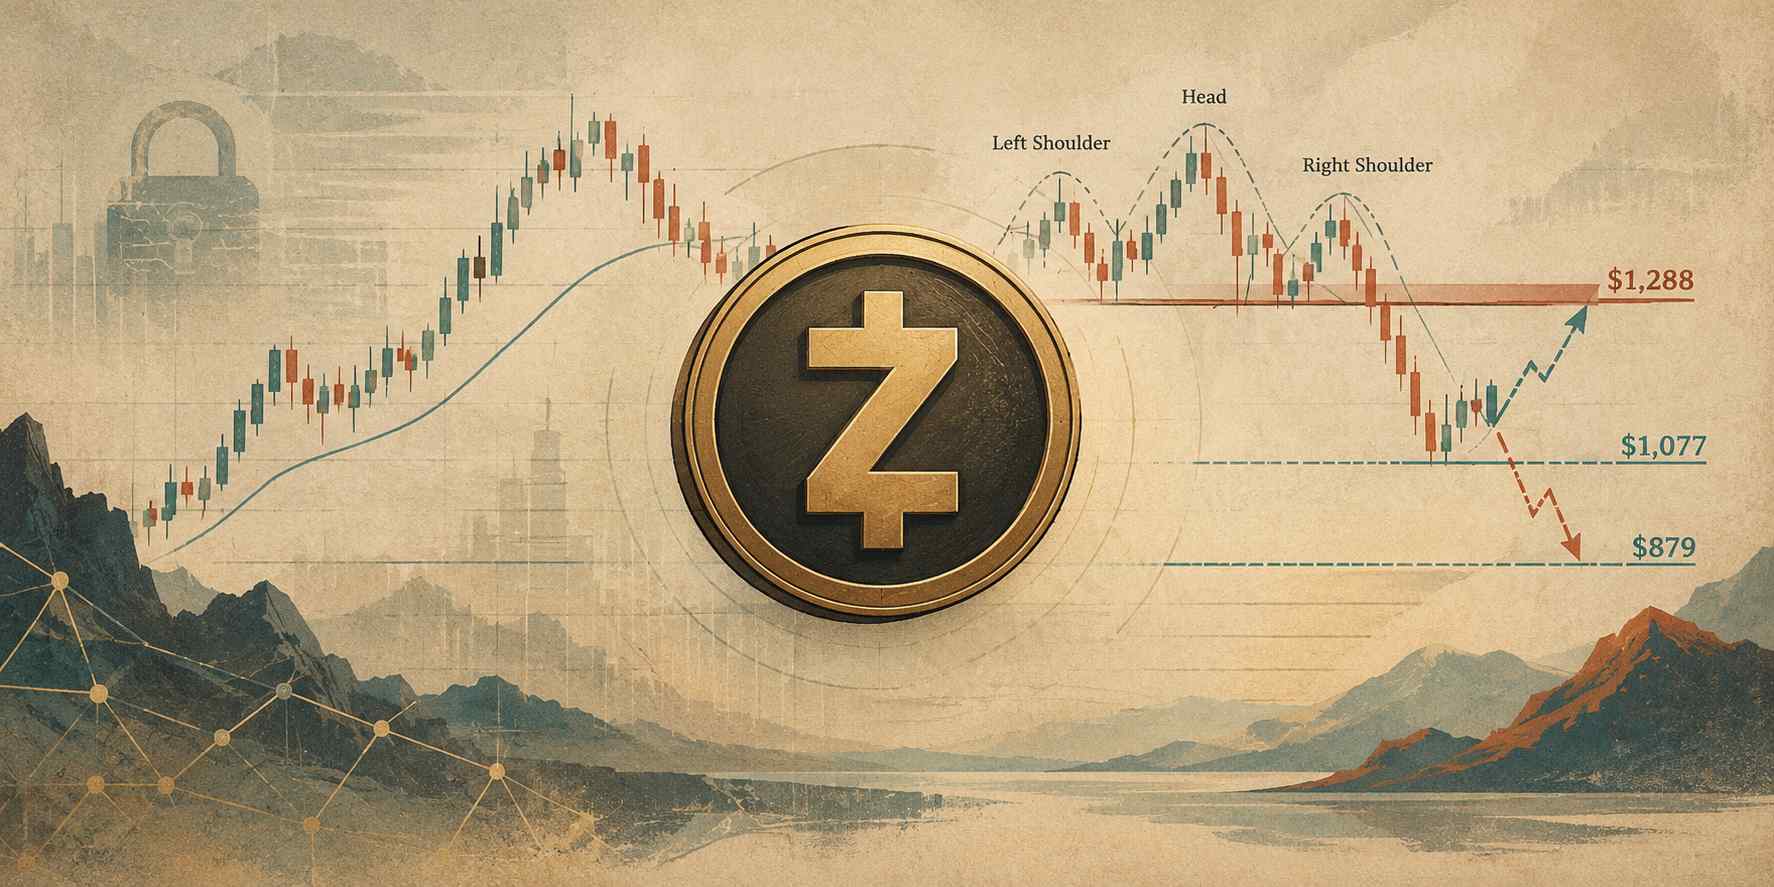
Zcash (ZEC) has rebounded above $1,200 after a sharp correction from its September highs, but bearish chart patterns and overhead resistance continue to complicate its recovery prospects.
The Zcash price climbed toward $1,230 on October 16, 2026, after recently testing support near $1,077. Traders are now watching whether ZEC can extend its relief rally toward $1,288 or resume its decline toward lower support levels.
Zcash Price Prediction: $1,288 Resistance Puts Recovery to the Test
Zcash’s latest rebound follows a correction of approximately 34%–36% from highs near $1,700. The pullback has reduced some of the gains from its sharp rally, while leaving the token well above its longer-term moving average. Market data for October 16 showed Zcash closing near $1,231, with the 200-day moving average around $669.
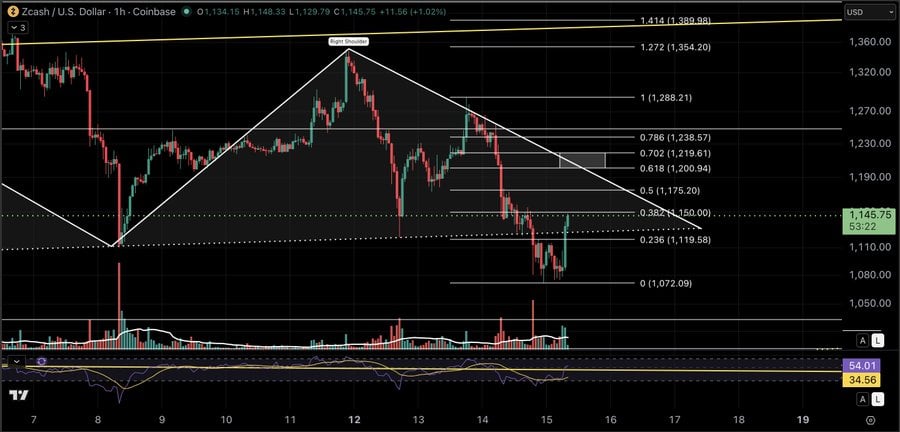
The $1,200–$1,288 range represents a potential short-term rebound zone, aligning with descending trendline resistance and upper Fibonacci extensions. Source: Eric Van Tassel via X
Technical trader Eric Van Tassel identified a potential relief rally on the one-hour Coinbase chart, using Fibonacci retracement levels and a descending trendline to map possible upside targets. The analysis places the $1,200–$1,288 area in focus as a zone where the recovery could encounter renewed selling pressure.
The upper end of that range is consistent with independent technical readings. Montbon’s October 16 analysis placed its first resistance level near $1,290, while CoinCodex listed resistance around $1,235 and $1,326. These levels vary by methodology but collectively highlight the challenge facing ZEC as it attempts to recover.
A sustained move above $1,288 would strengthen the short-term recovery case, particularly if buyers can keep the price above reclaimed support. However, an intraday move through resistance would not, by itself, establish a lasting trend reversal. Traders would need to assess whether subsequent candles hold above the breakout area and whether buying activity supports the move.
Head-and-Shoulders Pattern Raises Downside Risks
The potential recovery is complicated by a head-and-shoulders formation identified by Eric Van Tassel on the four-hour ZEC/USD chart. The pattern consists of a left shoulder, a higher peak known as the head, and a right shoulder. It is generally considered bearish when price breaks below the neckline connecting the intervening lows.
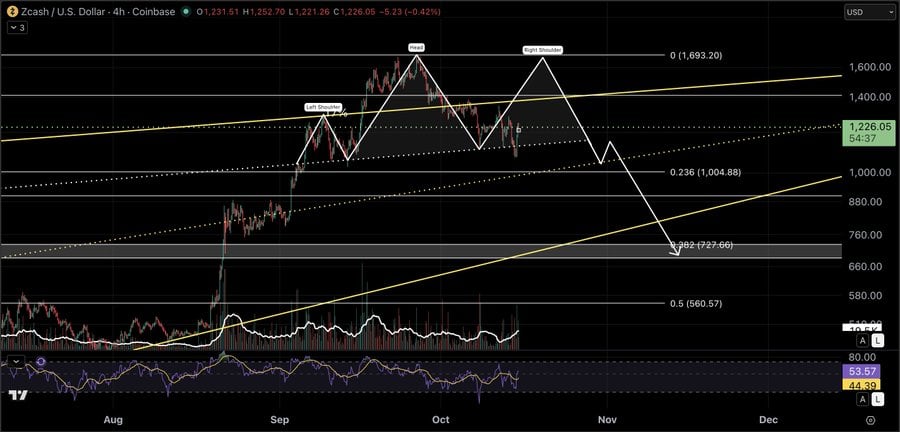
ZEC’s continued rally without a meaningful correction could turn the head-and-shoulders pattern into a potential double top, although the H&S structure remains valid unless price breaks above the head. Source: Eric Van Tassel via X
Tassel’s chart analysis identifies a possible downside target near the 0.618 Fibonacci retracement level around $727. That level represents a projected scenario rather than a confirmed destination. The pattern’s significance depends on how the price develops, particularly whether ZEC breaks below the neckline and confirms the bearish structure.
The trader also cautioned that a renewed advance without a meaningful pullback could weaken the head-and-shoulders interpretation or produce a different structure, such as a double top. This distinction matters because chart patterns are conditional signals, not guarantees of future price direction.
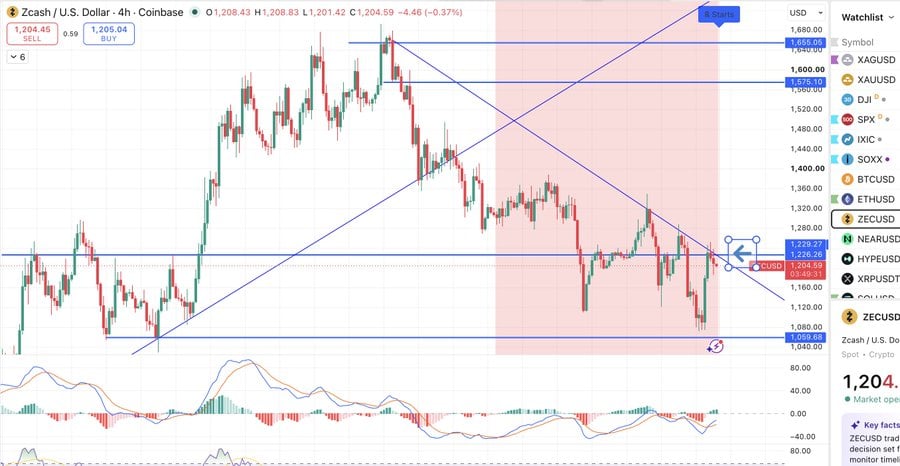
The Zcash price was rejected at the 4-hour downtrend line and $1,229 horizontal resistance, forming another lower high and potentially exposing support at $1,080–$1,059. Source: @AstroCryptoGuru via X
A separate four-hour analysis from AstroCryptoGuru identified a bearish rejection near the descending trendline and horizontal resistance at $1,229. The trader interpreted the move as another lower high and highlighted potential downside levels at $1,080 and $1,059. Those levels are considerably closer to the current price than the $727 Fibonacci projection and therefore represent separate stages in the bearish scenario.
Ichimoku Cloud Signals Possible Retest Near $879
MaisonCypher’s daily-chart analysis offers another perspective on Zcash’s correction. The trader noted that the price had moved above the upper boundary of the Ichimoku Cloud before turning lower toward the cloud’s lower boundary. The indicator helps traders assess trend direction, momentum, and potential support or resistance zones.
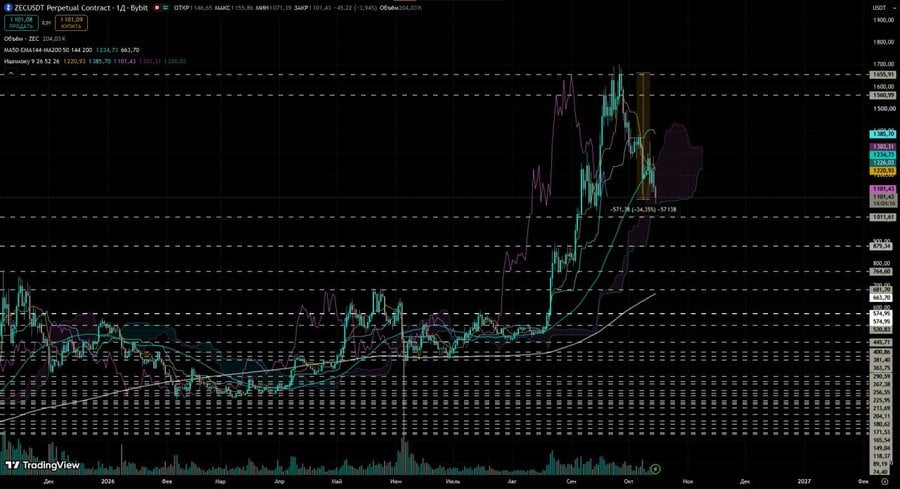
ZEC could briefly dip toward $879 to reset momentum indicators, with holding cloud support critical to establishing a reversal base for a potential medium-term recovery. Source: @MaisonCypher via X
MaisonCypher highlighted approximately $879 as a possible downside level if the correction continues. The analysis suggests that a move toward this area could help reset short-term momentum indicators before another attempt at recovery. However, the price would need to stabilize around relevant support for that scenario to develop.
The $879 level also sits well below the more immediate support areas identified by other traders. ZEC’s ability to defend the $1,080–$1,059 zone could therefore be important in determining whether selling pressure remains contained or develops into a deeper retracement.
Independent market indicators show a mixed picture. On October 16, Zcash’s daily relative strength index (RSI) stood around 47, while its MACD remained negative, according to Montbon’s technical analysis. The RSI reading suggests that momentum was neither strongly bullish nor deeply oversold, while the negative MACD points to lingering weakness.
These readings do not rule out a rebound, but they offer limited confirmation that buyers have regained control. The Ichimoku Cloud’s lower boundary, the $1,080–$1,059 support region, and the nearby resistance zone remain important reference points for the next phase of price action.
ZEC Price Prediction: Key Levels to Watch
Zcash’s short-term outlook depends on whether the latest rebound can overcome resistance or whether sellers regain control near the descending trendline.
On the upside, $1,229–$1,288 forms the immediate resistance area highlighted by the supplied chart analyses. A sustained breakout above this zone could open the way toward higher resistance, although confirmation would depend on follow-through buying and the ability to hold reclaimed levels.
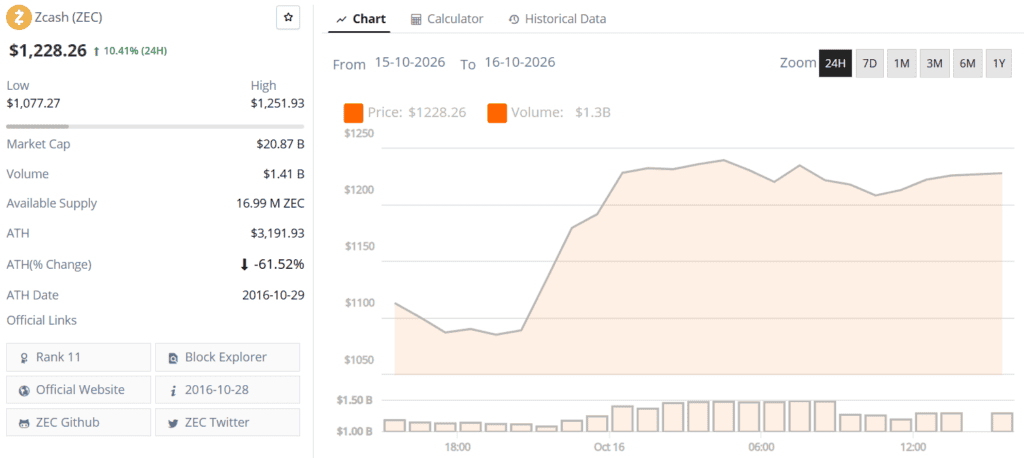
Zcash (ZEC) price chart. Source: Brave New Coin
On the downside, $1,080 and $1,059 are the first notable support levels identified by AstroCryptoGuru. A decisive break below this region could expose Zcash to further losses. The $879 level represents a deeper correction scenario from MaisonCypher, while XRPathologist’s $727 projection is tied to the potential completion of the head-and-shoulders pattern.
These targets should not be treated as a single forecast. They reflect different chart structures, timeframes, and assumptions. The head-and-shoulders pattern would carry greater weight if ZEC breaks its neckline, while a sustained move above resistance could undermine the bearish setup.
Macro and Asset Outlook
Zcash’s broader market context remains relevant to its price outlook. The cryptocurrency uses zero-knowledge cryptography to support shielded transactions, giving it a distinct position among digital assets. However, its technological characteristics do not prevent sharp price swings or guarantee continued demand during periods of market weakness.
ZEC’s advance toward $1,700 earlier in the year was followed by a substantial retracement, illustrating the volatility that can accompany rapid price appreciation. Its position above the 200-day moving average suggests that the longer-term trend remained stronger than the immediate price action indicated, but shorter-term momentum was less convincing.
For now, the $1,288 resistance level represents an important test for the relief rally. A successful breakout could improve the short-term outlook, while another rejection may bring $1,080 and $1,059 back into focus. If those supports fail, the lower targets near $879 and $727 become relevant bearish scenarios.
The next directional move will depend on how the Zcash price responds at these technical levels. Until resistance is reclaimed or support breaks decisively, the price outlook remains divided between a recovery attempt and the risk of a deeper correction.
 Brave New Coin reaches 1M+ engaged crypto enthusiasts a month through our website, podcast, newsletters, and YouTube. Get your brand in front of key decision-makers and early adopters in 2026. Limited slots remaining! Find out more today!


