Bitcoin Cash Price Analysis: Bitmain IPO speculation runs out of steam

![]()
The BCH token enjoyed a strong end to September on news that key investor Bitmain had filed for an IPO, but its price has since fallen away. Like many other tokens, BCH’s short-term price fluctuations appear tied to speculative news, but the network’s long-term health will be dependent on its ability to increase its user base and organic onchain activity
BCH, the native token of the Bitcoin Cash network, has seen a strong price run over the last few weeks, come to a screeching halt, following a market-wide crypto market sell-off. It currently trades at ~$457.
From the 25th of September to the 8th of October, BCH’s global spot price drove up ~24%, trading at 531.94, the token showing legs to soar past the $500 threshold. The main driver for the ongoing bullishness is likely Bitmain filing its intention to launch an IPO on the Hong Kong Stock Exchange.
Why did this filing affect the price of BCH so specifically, given that Bitmain also produces mining equipment for the Bitcoin, Dash, Litecoin and Siacoin blockchains? Because Bitmain invested nearly 70% of its entire operating cash flow in 2017 into BCH holdings,~$887 million dollars. This is nearly six times its investment in BTC, the organization’s next most favoured digital asset to hold. The fortunes of Bitcoin Cash and Bitmain appear, at this juncture, closely tied together.
Additionally, Bitmain’s founder and CEO, Jihan Wu is increasingly becoming an integral cog in Bitcoin cash’s governance, and is expected to continue his financial and philosophical investment into the network (Jihan frequently retweets BCH maximalist Roger Ver and Bitcoin Cash dev updates). Jihan Wu owns 20.25% of Bitmain.
These factors have led to a market perception that it is likely a large chunk of Bitmain’s IPO earnings will be reinvested into the Bitcoin Cash blockchain.
Given that Bitmain’s perceived valuation has ranged between $12-15 billion, this means a sizable pumping of cash into BCH markets, and a strong reason to be bullish about future prospects of the network.
For comprehensive quantitative and qualitative metrics for Bitcoin Cash, and the positioning of BCH as compared to other ‘payment’ cryptographic assets see BNC’s General Taxonomy For Cryptographic Assets.
Exchanges and trading pairs
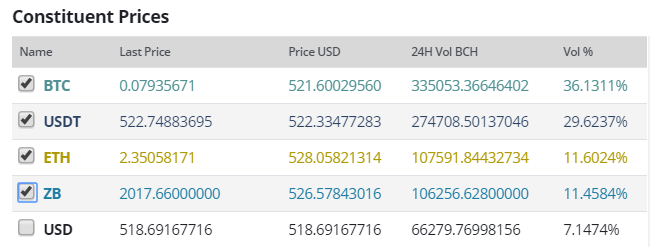
The most popular pairs for Bitcoin Cash are predominantly crypto-to-crypto, with the BTC/BCH, Tether/BCH, ETH/BCH being the top three trading options for BCH. Fourth on the list is the ZB (Zero Bank Token)/BCH pair, which may be so popular because of the discounted rates the recently launched token offers on the ZB exchange. However, given the nature of operations on a number of offshore exchanges, it is certainly possible some of this volume came from wash trading.
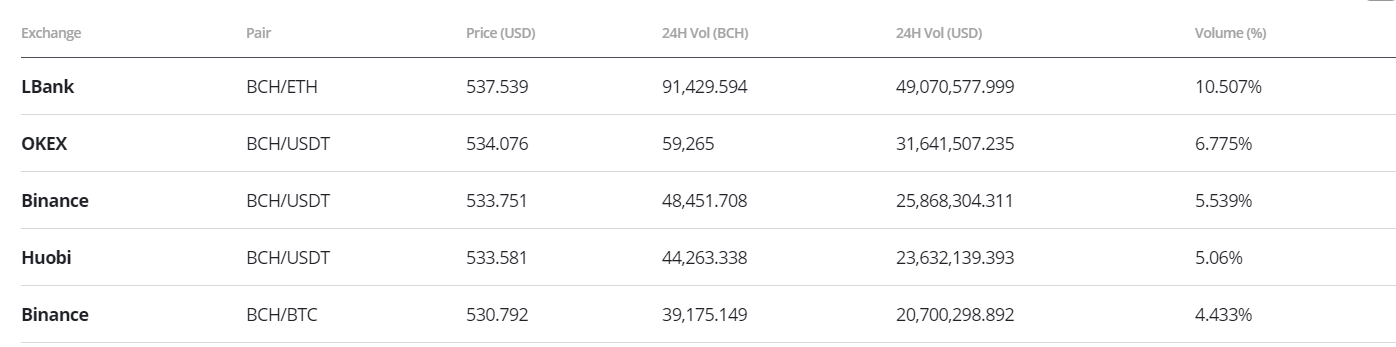
The most popular trading pair by exchange, is the BCH/ETH pair. Both tokens have struggled for forward momentum over 2018, and the recent bullish price movements for BCH may be the reason for the heavy trading on Lbank as traders begin to shift their ETH holdings. Other popular exchanges are perennial top 5 spot exchanges: Binance, Okex and Huobi, on the BTC and USDT pairs.
Do fundamentals backup the speculative movements?
NVT signal
The NVT signal, a responsive blockchain valuation metric, developed & tested by Willy Woo and Dmitriy Kalichkin was derived from the NVT ratio. With the NVT signal the simple idea is that crypto markets are prone to bubbles of speculative purchasing, not backed up by underlying network performance and activity, and the NVT signal gives off a signal for what stage of this price cycle a token may be in.
The NVT signal is particularly useful for a network like BCH, which has recently experienced a period of bullish momentum, which has subsequently quelled.
A high NVT signal is indicative of a network that is going through one of these bubble periods, and may move towards a position of becoming overbought/overvalued, because of the market’s speculative assessments running out of steam.
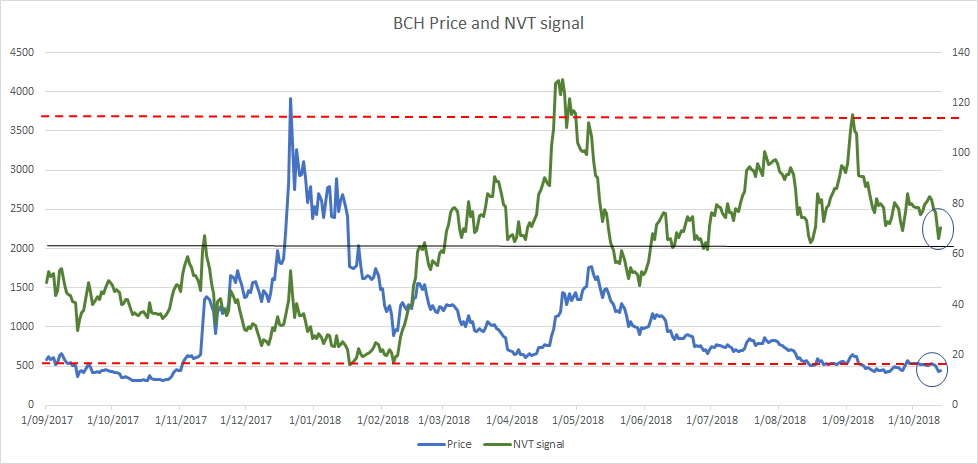
Figure 1: BCH historical NVT signal data. (NVT signal = Market Cap/onchain transaction volume, smoothed with 30 day MA, Oversold range >110, Undersold range <16, Mean NVT signal: 61.2)
Onchain data sourced from Coinmetrics
Figure 1 displays the NVT signal for BCH since the initial hard fork. The current NVT signal for BCH (70.61) hovers precariously above its historical mean of 60.26, and appears to be quickly trending downwards, driving price downwards. Since the IPO filing, the BCH NVT signal appears to have sharply jumped, driven by positive speculation, moving upwards along with price.
As BCH faced bearish pressure following crypto market sell-offs on the 10th of October, NVT signal quickly reversed with speculative fuel, no longer a factor. Without a change in the actual usage of the Bitcoin Cash blockchain for operations like payments or remittances, price support appears to have been broken quite easily, and the BCH price is now back trading around pre-Bitmain IPO filing levels.
A consideration is that a Bitmain IPO filing is unlikely to have any major effects on network fundamentals in the short-term. Until Bitmain accumulates its IPO earnings, and reinvests them into the BCH blockchain and its developers, the IPO event is unlikely to trigger organic on-chain volume.
This organic effect will likely take some time to kick in, at minimum a few months, so it is fair to say that the late September price run was driven primarily by speculation.
A question to consider is if the positive speculation around the Bitmain IPO can re-emerge once the selling pressure from wider crypto market begins to cool off. With factors like the US dollar Tether liquidations starting to kick in and beginning to push prices upwards in crypto markets, there may be some resurgence of Bitmain IPO positive speculation.
Based on previous NVT bubbles occurring in April 2018 and September 2018, an NVT signal of ~110, appears to be the trigger point for BCH being definitively oversold (indicated by the red line on figure 1), and a signal for downward price action.
At the moment the NVT signal shows that BCH is in a spot well below ‘oversold’ levels and well above ‘overbought’. This indicates space for price to move sharply in either direction because of speculative factors.
The current downward moving NVT signal, and the lack of fundamental support points to erratic price movements unless the Bitcoin Cash network can organically generate onchain activity, which may eventually come once Bitmain begins to invest heavily in the network using its IPO raise. It is difficult to predict how long speculation can fuel a BCH price run before the NVT signal hits an inflection point.
The trigger for the speculative bubble in mid-April 2018 was a block size upgrade within the Bitcoin Cash blockchain from 8mb to 32mb. While the upgrade was released on the 15th of May, price began to trend upwards around the 6th of April when BCH was priced at ~$619.2, it jumped a substantial ~182% to a peak on the 6th of May at ~$1746.3, before falling another ~60% to trading at ~$666 on June 29th.
On the 15th of May BCH traded at $1401.9, this indicates that during this previous bubble while in general BCH followed a ‘buy the rumour, sell the news’ pattern, dumping occurred well before the ‘news’, in this case the block upgrade, actually hit. The temporary ceiling for the NVT signal was hit around the 26th of April, before it began dropping rapidly, putting downward pressure on price.
Speculation and unobservables won out against price until the 7th of May, when the temporary price bubble burst, and the underperforming fundamentals began to reflect in the price of BCH.
Qualitative considerations
At a qualitative level there are distinct differences between the ongoing positive price run and the ‘block size upgrade’ run in April. It doesn’t appear that at any lasting level, the block upgrade has increased the average sizes, or times, of blocks on the Bitcoin Cash network. Making it appear, to some extent, that the upgrade was unnecessary at the time. Blocks are capable of being bigger but appear to contain the same amount of data as they did before the upgrade.
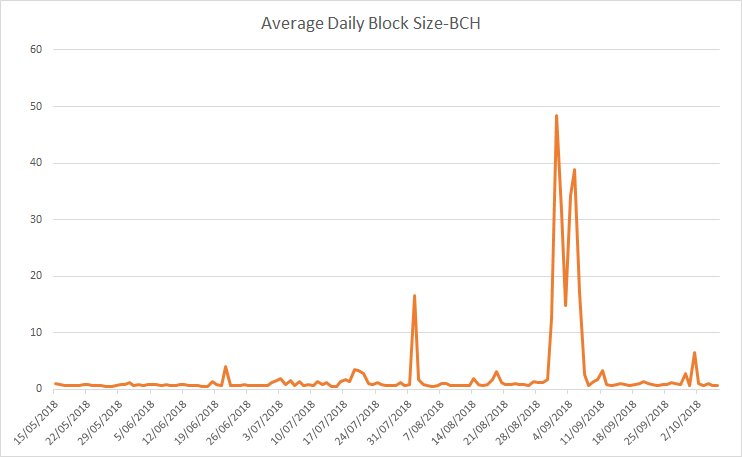
Figure 2: BCH historical average daily block size
(The most recent spikes in block size in early September were driven by a network stress test, and were not organic)
The upgrade was certainly forward looking, anticipating eventual larger transactions loads and block size requirements. So it did add value to the network. However, it is very difficult to understand why it triggered a 100% price jump in a relatively short term period (one month), beyond the obvious speculation and market play argument.
Given Bitmain appears set to continue reinvesting cash flow into BCH, there may be an argument that the current wave of speculative momentum may have more underlying value than the ‘block upgrade’ run.
Larger and continued BCH purchasing resulting from the Bitmain IPO earnings, should be directly reflected in on chain transaction volume and network activity. This should translate into downward pressure on the NVT signal, and dampen a run towards the oversold level.
Again, time frames are difficult to predict, and it remains unclear when Bitmain will actually receive money from IPO investors. There may be a number of speculative bubble cycles leading up to the actual Bitmain IPO, driven by news events and official announcements related to its happening.
Price to Metcalfe Ratio
Metcalfe’s law is a measure of connections in a network, as established by Robert Metcalfe the founder of Ethernet. It has subsequently been used to analyze the true value of network-based financial products like Facebook and Bitcoin, and by comparing it to price, can provide a useful tool to assess whether a token is over or undervalued.
It is also a more straightforward metric to implement versus onchain transaction volume, which can be challenging to measure accurately in USD terms. Coinmetrics.io measures addresses as ”the number of unique sending and receiving addresses participating in transactions on the given day.”
This makes it a relatively transparent metric as compared to onchain volume. However, there may be a question of who is in control of these addresses.
Kalichkins updated Price to Metcalfe Ratio (PMR) methodology metric is used for calculations because of its added robustness. Bitcoin Cash’s PMR is rapidly rose post the Bitmain IPO trigger, on the 26/09/2018. However, it has since fallen away since the market sell-off on the 10th of October.
It crossed above its historical mean on 27/09 and appeared headed towards a PMR ceiling, assessed to be around the 2.25 level. It appears as though PMR has since tailed off.
The current signal from the PMR is that there is still more room for BCH’s price to move sharply in either direction driven by factors such as leftover IPO speculation, before PMR crosses into ‘overbought’ or ‘oversold’ territory. Like NVT signal there appears to be a lack of organic fundamental support from connection growth.
During the ‘block upgrade’ speculative bubble in April, PMR appears to interact within a much closer timeframe to price, than NVT signal. Whereas NVT signal, peaked 10 days before price began dropping, PMR and the price peak during the speculative bubble follow very closely. With both PMR and Price hitting temporary peaks, on the 7th of May before falling away.
A potential longer term speculative price run, indicated by the sharply rising PMR starting from late September, has since been quelled by downward selling pressure in wider crypto markets.
Historical patterns appear to suggest, based on the current middling PMR signals, that BCH token is loading up for its next big price movements, upwards or downwards, likely to be based purely on speculative factors.
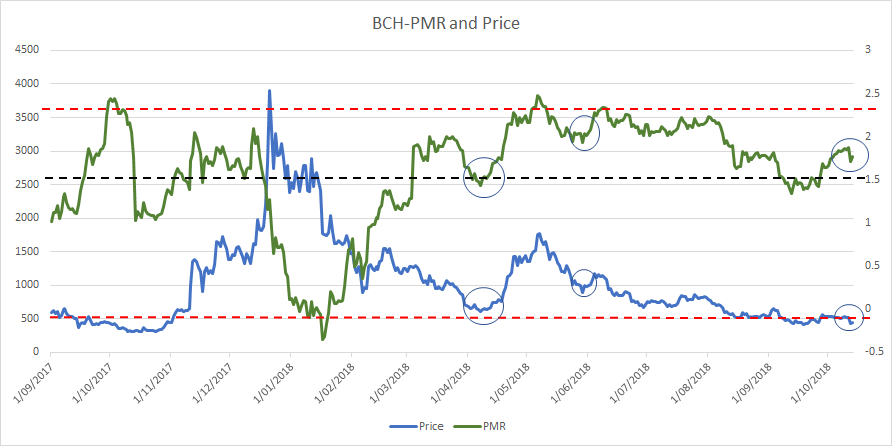
**(Fig 3. Kalichkin’s PMR or Price to Metcalfe, Natural log of Token value/Metcalfe Ratio. Meltcalfe Ratio = Active Addresses Squared, Oversold >2.25, Undersold <-0.17 Mean: 1.6) **
Technical analysis
Long Term Trends
In 2018, the price of BCH has been consistently bearish visualized by a negative linear price trend with a Pearson R correlation coefficient between time and price of 0.80, on the 1 day chart. Additionally, the death cross has persisted during 2018 as well, and the 200 day exponential moving average (red line) is currently acting as price resistance. BCH is currently sitting at ~$442 and appears to be basing out above the average trend path.
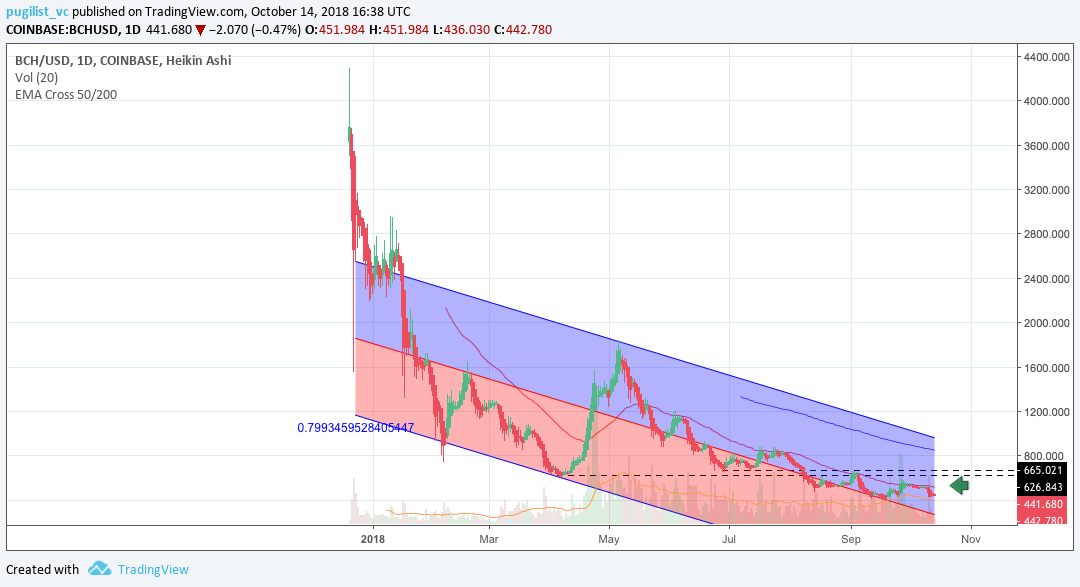
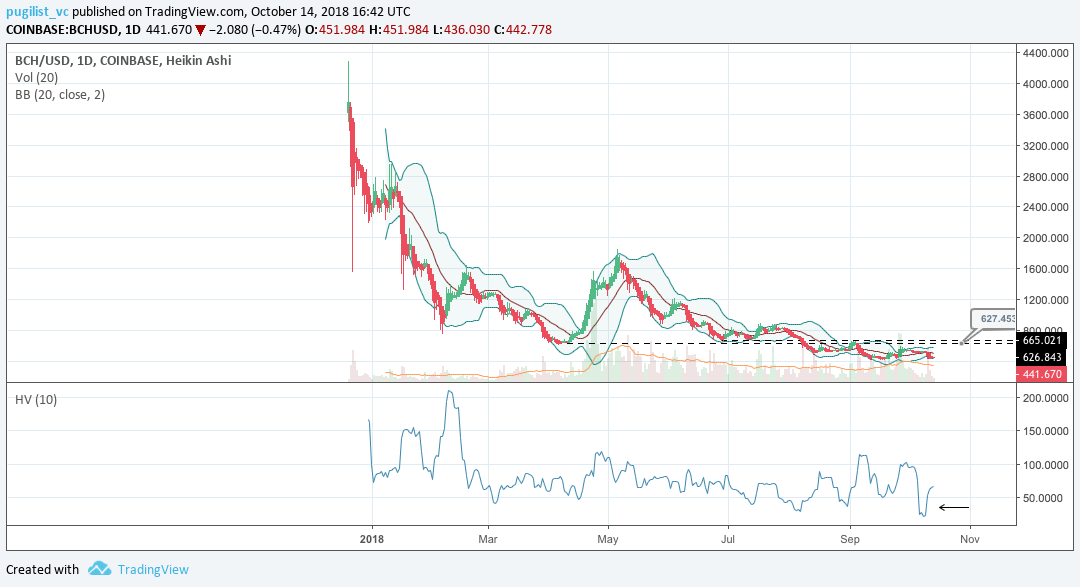
Additionally, price volatility for BCH has been diminishing since September, visualized by the compressing bollinger bands and declining historical volatility (black arrow). Compression typically precedes a price breakout in some direction. This notion may prove fruitful for a price increase towards historical resistance levels near $624, if the breakout proves positive. Given the high market dependence on bitcoin (BTC), coupled with the 0.54 correlation between BTC and BCH in 2018, the success of the aforementioned positive breakout, largely hinges upon the price movements of BTC over the coming weeks, probabilistically speaking.
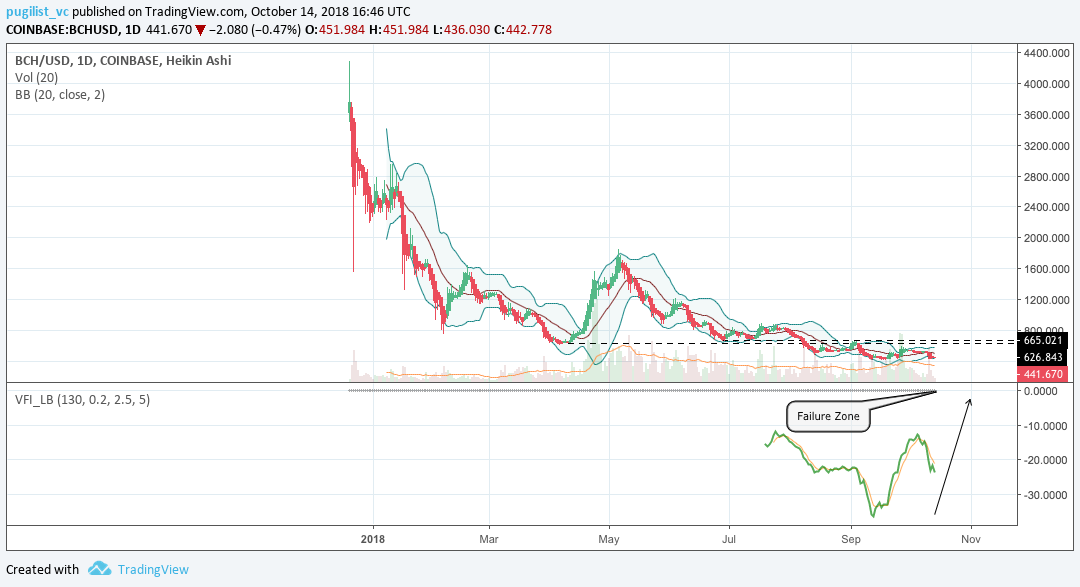
Lastly, the volume flow indicator (VFI) has never breached 0 in 2018 (black arrow). This dynamic does not disqualify BCH from a potential upward breakout, but it does put a likely cap to the breakout, i.e. the hypothetical price increase will falter once it reaches 0. This "failure zone" possibly would coincide with the $625 levels of previous resistance. The VFI interpretation is: a value above 0 is bullish and below 0 is bearish, with divergences between price and oscillator being high probability signals.
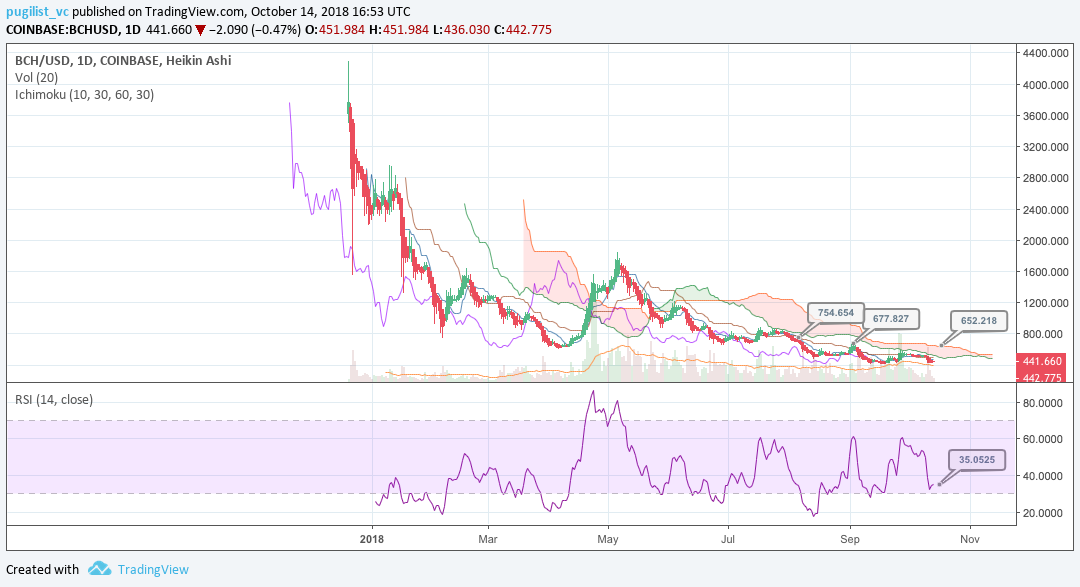
Ichimoku Clouds with Relative Strength Index (RSI)
The Ichimoku Cloud uses four metrics to determine if a trend exists; the current price in relation to the Cloud, the color of the Cloud (red for bearish, green for bullish), the Tenkan (T) and Kijun (K) cross, Lagging Span (Chikou), and Senkou Span (A & B).
The status of the current Cloud metrics on the 1 day time frame with singled settings (10/30/60/30) for quicker signals is bearish; price is below the Cloud, Cloud is bearish, the TK cross is bearish, and the Lagging Span is below the Cloud and touching price.
A traditional long entry would occur with a price break above the Cloud, known as a Kumo breakout, with price holding above the Cloud. From there, the trader would use either the Tenkan, Kijun, or Senkou A as their trailing stop.
BCH is currently sitting at $442 and trying to re-attempt a Kumo breakout. The RSI is near oversold territory (around 35) and currently trending upward. Despite the low probability, if the positive price momentum persists for BCH, then a positive breakout becomes more likely, which has the ability to legitimately attempt a Kumo breakout. The support levels for price are $425, $400, and $375; while price targets for a successful Kumo breakout (breaking above $652) are $677 and $750.
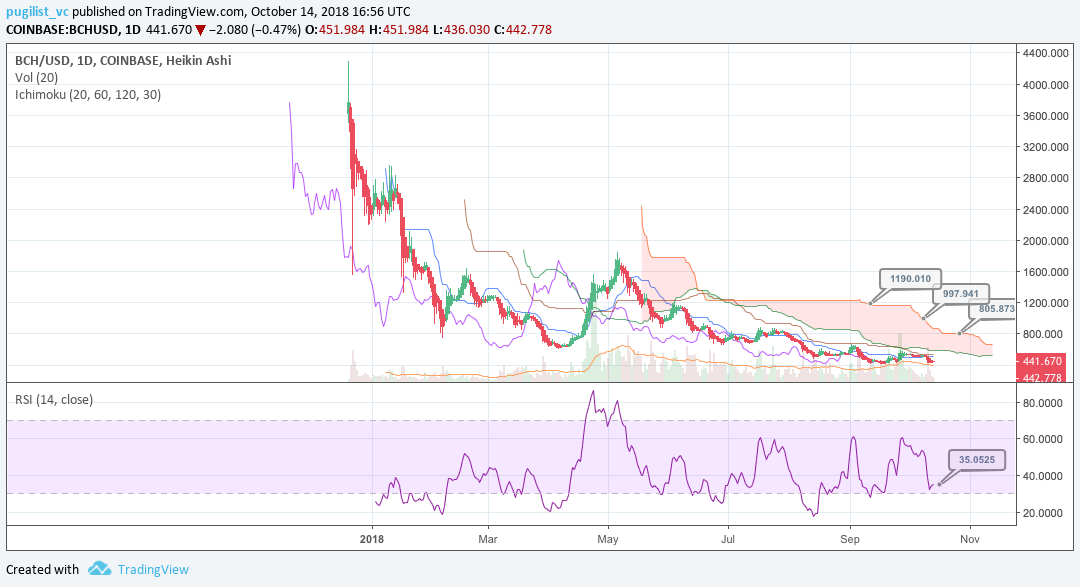
The status of the current Cloud metrics on the 1 day time frame with doubled settings (20/60/120/30) for more accurate signals is bearish; price is below the Cloud, Cloud is bearish, the TK cross is bearish, and the Lagging Span is below the Cloud and touching price.
As mentioned, BCH is currently sitting at $442 and looking for a Kumo breakout attempt. Using the slower Ichimoku settings, the probability for Kumo breakout success is much lower than the faster settings. In the unlikely event of a successful Kumo breakout, price will need to breach $805 with price targets of $1000 and $1164.
Conclusion
Driven by the backing of crypto’s largest mining entity, BCH has enjoyed a period of strong forward price momentum between late September and early October. While NVT and PMR signals did indicate that the speculative momentum generated by the Bitmain IPO filing still had room to grow, wider crypto sells-offs put paid to a potential extended price run.
As the Bitmain IPO approaches its issuance date, it is likely that BCH will become prone to more short term bubbles, created by IPO related news events (see BNC Newsfeed for alerts).
Once the issuance does occur Bitcoin cashers would hope that it leads to deeper investment into the Bitcoin Cash network. Although this could be a risky investment strategy because of a potential Bitcoin Cash fork and the general instability surrounding the governance of the network. The lagging growth of Onchain transaction and active address growth is also a concern.
The long term technicals for BCH are bearish and show few signs of abating when looking at linear trends and Ichimoku Clouds. However, short term volatility compression, coupled with a ‘hopeful’ positive market catalyst may allow for a brief price reprieve, with "hopeful" price targets of around $625. However, both, the prudent short term trader (10/30/60/30) and longer term trader (20/60/120/30), on the 1 day chart, will await a positive TK cross and Kumo breakout above $652 and $805, respectively, before entering a long position. Both trader’s support levels are $425, $400, and $375. Additionally, the (10/30/60/30) trader’s price targets are $677 and $750, and the (20/60/120/30) price targets are $1000 and $1164.
 Brave New Coin reaches 1M+ engaged crypto enthusiasts a month through our website, podcast, newsletters, and YouTube. Get your brand in front of key decision-makers and early adopters in 2026. Limited slots remaining! Find out more today!


