The Golden Cross for Litecoin is confirmed – Is LTC heading into a bullish period?

![]()
Litecoin has hit a Golden Cross — the holy grail of bullish technical analysis indicators. This has happened as the rest of the market struggles following the collapse of FTX. But even with a Golden Cross, can traders count on a Litecoin bullrun?
Source: TradingView. LTC/USDT market – Binance
Is Litecoin going to break out of a long-term bear trend?
Litecoin (LTC) is something of a forgotten asset in the minds of crypto traders but right now it has bucked the wider bearish crypto trend (The FTX cloud) and its price is soaring.
Litecoin is a fork of the Bitcoin (BTC) blockchain created by former Coinbase CTO Charlie Lee. Litecoin was created to have shorter block times, an increased supply, and a different hashing algorithm. Litecoin has often been described as the silver to Bitcoin’s gold.
LTC is up ~36% in the last month and bulls are simply ignoring everything else happening around it. At the same time, Bitcoin (BTC) is down ~21% and Ethereum is down ~25%.
What is a Golden Cross in Technical Analysis?
A golden cross like that which Litecoin has hit occurs when the short-term moving average line (30-day) crossing crosses from above to below the long-term moving average line (200-day). It is one of the most notable technical indicators in the TA trader’s playbook, as when a golden cross is confirmed it suggests bullish price action continuing.
The stages of the Golden Cross
There are three stages to a golden cross. The first stage is when the price of the asset being monitored bottoms after the end of a period of selling pressure.
The second stage is post-bottoming when the price of the asset begins moving sharply upwards and momentum pushes the short-term moving average price above the long-term moving average price line. When the short-term line moving from below to above the long-term line is confirmed, the golden cross is confirmed.
The third and final stage is the continuation of the uptrend to higher prices.
Source: TradingView. LTC/USDT market – Binance
The most commonly used timeframe for the golden cross is 50 days for the short term and 200 days for the long term. It is a larger time increment that indicates a more macro trend reversal confirmation. The 50-200 day golden cross is often considered a ‘holy grail’ chart pattern, one of the most definitive buy signals in a trader’s handbook.
In the case of LTC, it has until recently been stuck in a death cross, the reverse of a golden cross. The death cross was initially confirmed in January 2022 and LTC has been stuck below it until this recent breakout. This is a strong sign that this most recent golden cross may be trustable as a buy signal. Golden crosses in a choppy market when the shorter moving average is frequently crossing in and out of the long-term moving average is less impactful.
Source: TradingView. LTC/USD market – Coinbase
There are, however, important considerations to make if you want to trade a golden cross after a long downtrend. After such a long bear trend, if a golden cross materializes after a period of short-term momentum there is likely to be a basing period. The basing period is where bulls and bears battle for position. If the price of the asset breaks to the upside there is likely to be some fuel behind the rally. If the price of the asset breaks to the downside after the base, bulls have lost their battle and a breakdown in price may occur.
Given the confirmed golden cross, some traders are clearly bullish on Litecoin, although a more conservative trader may wait for a push past the basing period and a short-term moving average line higher above the long-term line.
Why is the LTC price surging?
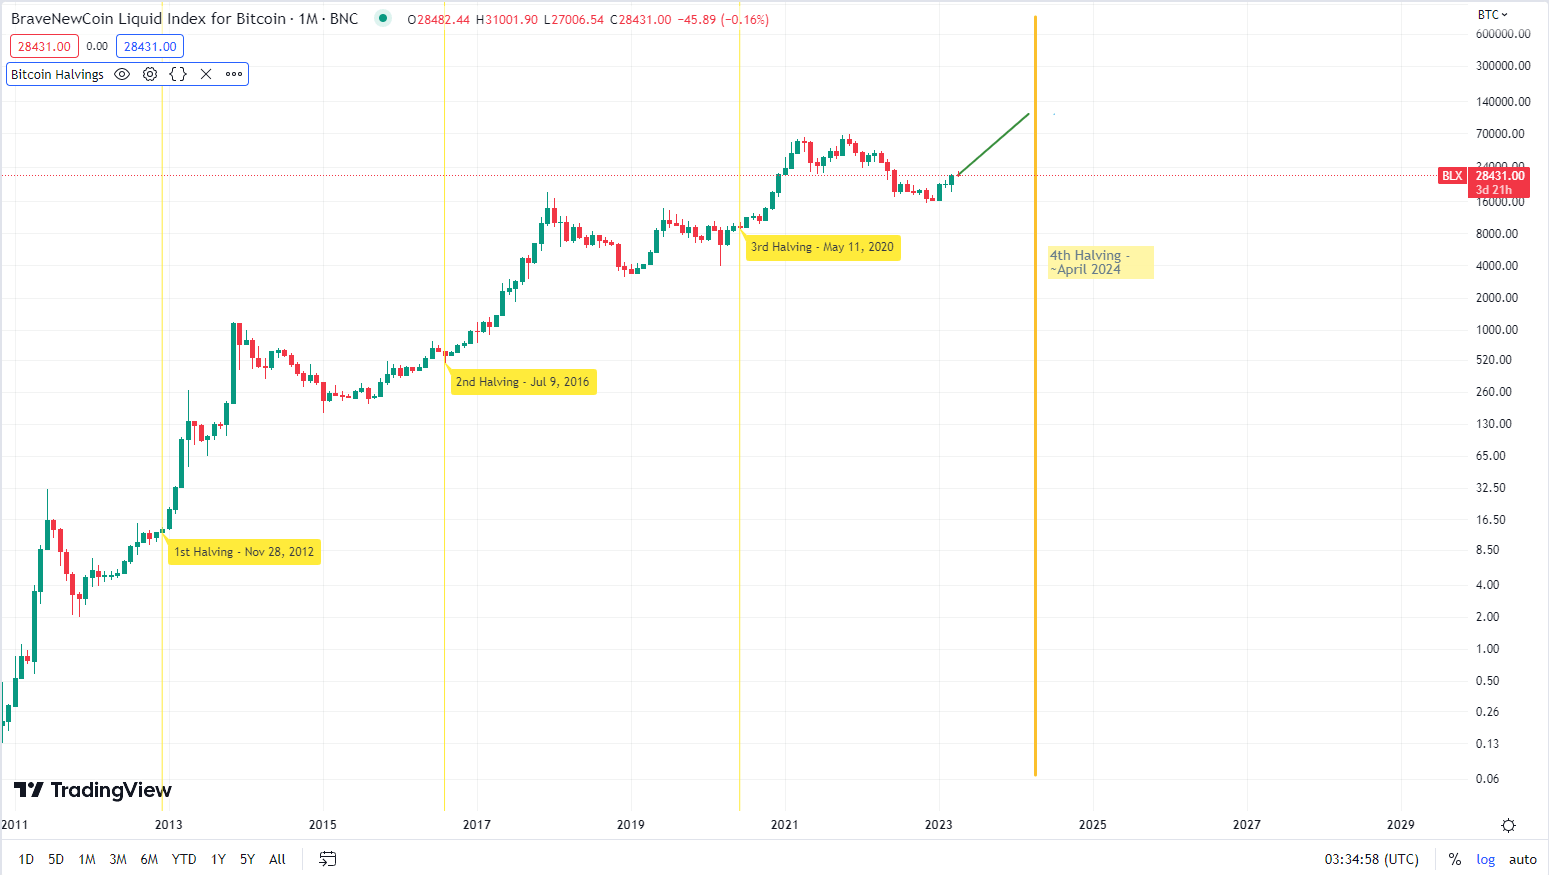
Litecoin’s bullish reversal has come around eight months before its next halving. Litecoin is based on Bitcoin’s code and has a near identical monetary policy.
Litecoin was built with a pre-planned deflationary monetary policy. Approximately every four years, a block reward halving occurs on the Litecoin blockchain. The halving cuts the miner’s LTC reward in half, reducing the rate at which new LTC supply is issued.
LTC’s position as a verifiable scarce asset with some demand means that as it becomes more difficult to acquire with each new halving, its intrinsic value increases. This deflationary mechanism drives prices upwards because it adds to LTC’s value proposition as another inflation hedge.
Historically, the price of LTC has generally rallied in the lead up to a halving.
Source: TradingView. LTC/USD market – Bitfinex
LTC’s previous halvings were on the 5th of August 2019 and the 25th of August 2015. Between the 13th of January, 2015, and the 10th of July, 2015 the price of LTC rallied from trading for ~US$1.1 to trading for ~US$8.9. Between Friday 14th, December 2019, and the 26th of June 2019 the price of LTC rallied from trading for ~US$23.4 to trading for ~US$144.0.
This pattern of rallying 8-9 months before a halving is striking. The next Litecoin halving is expected to occur on the 3rd of August 2023. The current rally is in sync with previous pre-halving rallies, albeit a little early.

Source: TradingView. LTC/USDT market – Binance
The current rally may be being driven by an awareness of Litecoin buyers/bulls who are sensing an early bottom for the asset and are now ready to buy into a halving narrative despite the chaos in the wider crypto space.
Source: TradingView. LTC/USDT market – Binance
A potential Litecoin price target for the current rally could be around ~US$140, a previous level of historical price resistance for the asset. LTC has recently broken past a historic resistance price level of around ~US$72 and ~US$140 seems like one of the next potential targets.
Fundamental data for Litecoin appears to be mixed to bullish.
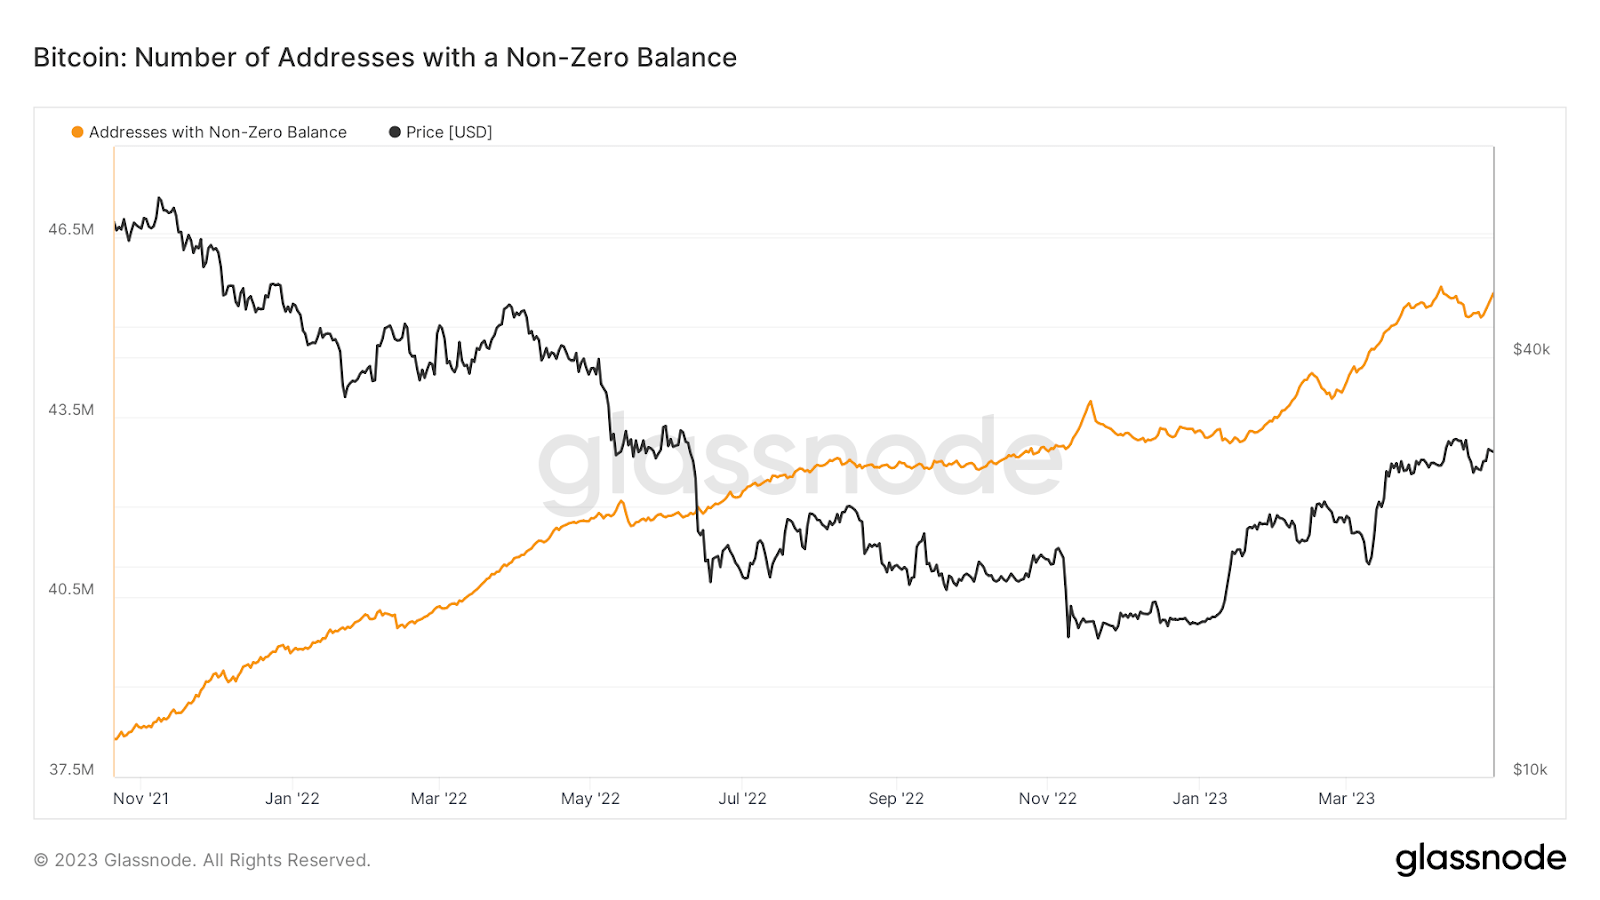
Active addresses and daily transactions on the Litecoin chain have not changed much in the last six months. Apart from a few spikes and drops offs there have been no clear bullish or bearish trends to indicate a significant influx or exit of users.
Source: Bitinfocharts.com
Source: Bitinfocharts.com
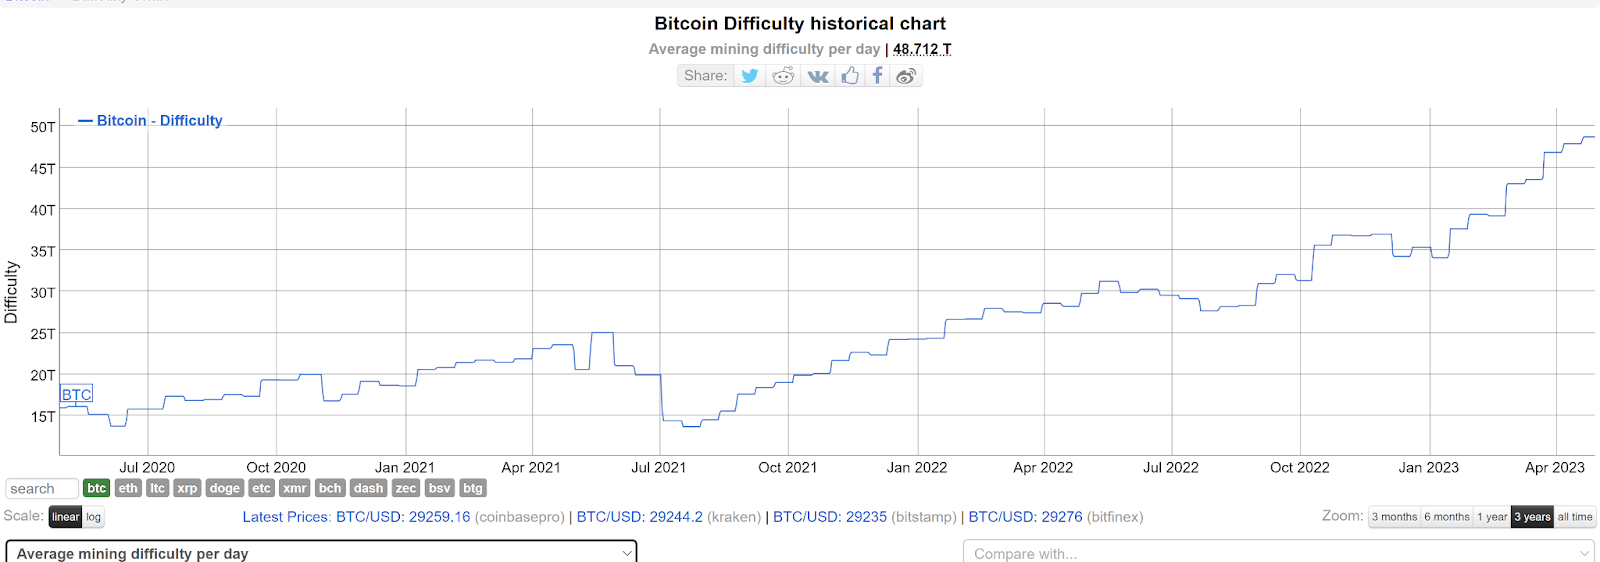
One metric that has surged is Difficulty and there now appears to be more demand to mine Litecoin than ever before.
Source: Bitinfocharts.com
The difficulty of Litecoin has surged to new all-time highs in the last month. Network difficulty in Litecoin’s proof-of-work model refers to the difficulty level necessary to successfully mine a block (making transactions possible and securing the network). Roughly every two weeks, an adjustment is made — making successfully mining blocks either easier or more difficult — in order to keep average intervals between blocks at 10 minutes. Difficulty rises suggest it has become necessary to make LTC more difficult to mine to keep the block production rate at 10 minutes.
There may be a number of reasons why the demand to mine Litecoin is rising. Litecoin is a GPU mineable blockchain (it does not need an ASIC to mine). Following Ethereum’s shift and planned shift away from Proof-of-Work to Proof-of-Stake, Litecoin became one of the most appealing chains for formerly Ethereum PoW miners to transition to.
Another factor for the recent drive to mine Litecoin is its merge mining capabilities. Dogecoin uses the same Scrypt algorithm as Litecoin, which was initially designed to be an ASIC-resistant alternative to the Bitcoin blockchain.
Litecoin founder Charlie Lee proposed a merged mining solution between Litecoin and Dogecoin, which would allow both chains to be mined simultaneously because they both operate with the same hashing algorithm. The fork that initiated the merged mining solution was implemented on block 371337, around mid-September 2014.
Dogecoin is an asset that has surged in popularity in recent years because of its position as a fun memecoin for Gen Z investors and a favorite of billionaire technologist Elon Musk. Musk is the new owner of the giant microblogging platform Twitter and in recent weeks DOGE has surged because of speculation that he will make the asset a payment option for Twitter’s blue subscription model.
There have been hints that Musk is looking for ways to decentralize Twitter and some believe that DOGE will be a part of this process. The CEO of IOG (fromerly IOHK) and founder of Cardano Charles Hoskinson said recently that there’s a real possibility that DOGE will “somehow merge” with Twitter. Musk has in the past shown an interest in DOGE development progress, its roadmap, and utility.
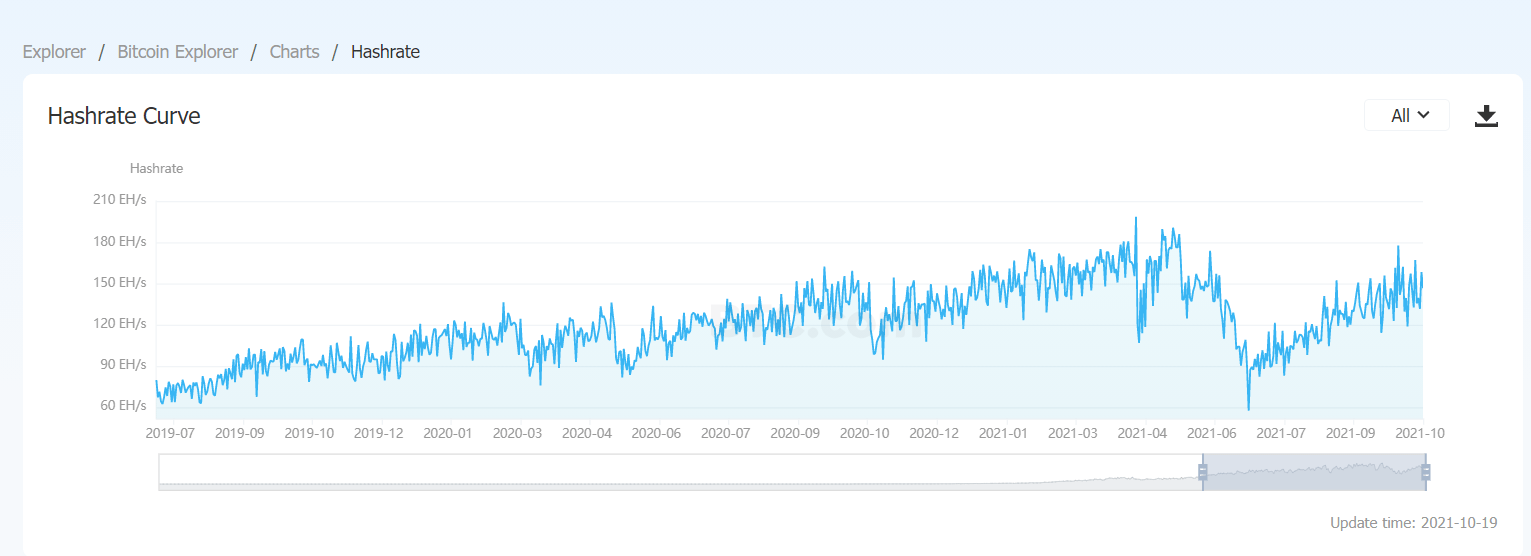
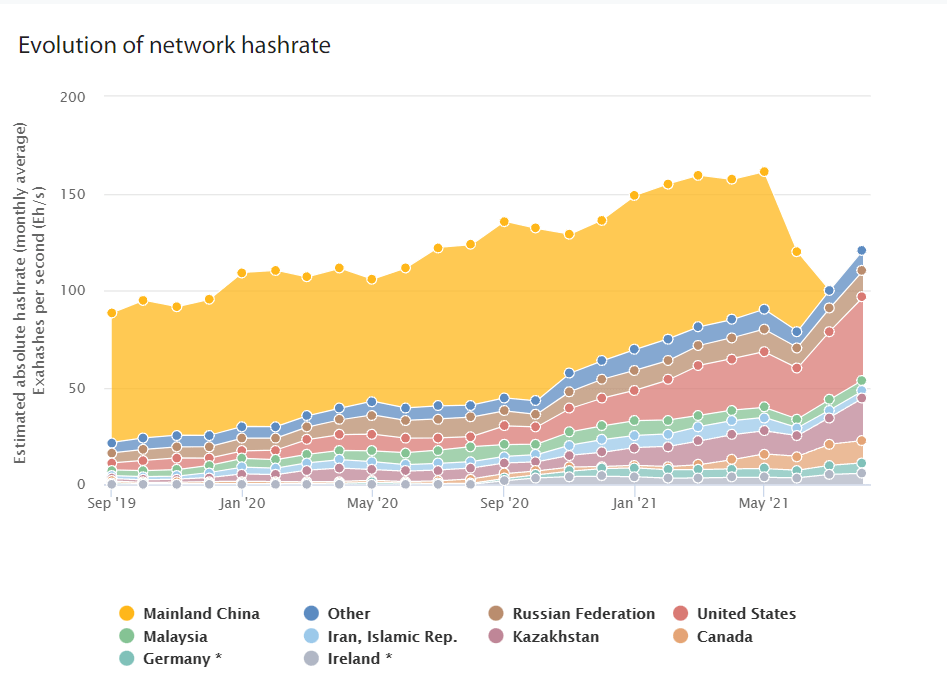
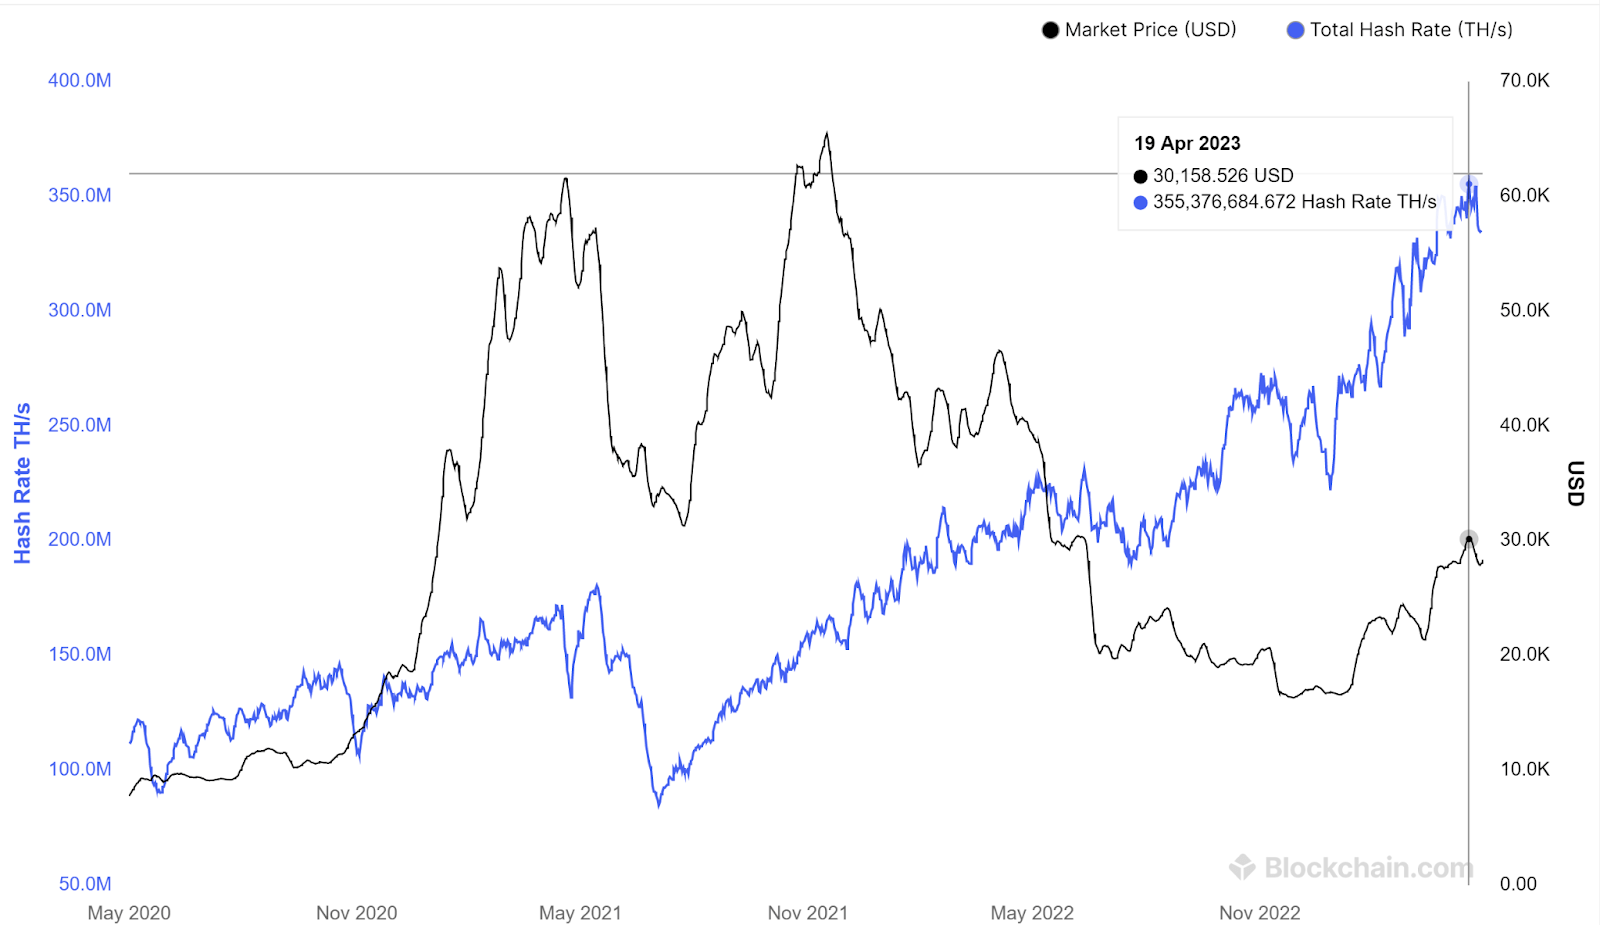
The merge mining model ensures that the hashrate of Litecoin and Dogecoin are nearly identical and any rise in demand to mine one of the chains leads to a rise in demand to mine the other. Alongside rising difficulty, the hashrate of Litecoin is also rising. This means that Litecoin is becoming more secure and harder to 51% attack as more power is deployed to the network.
Other technical signs
Trading volume is a measure of how much a given financial asset has been traded in a period of time. Traders look at volume to determine liquidity and the strength of conviction of a bull or bear trend. What will please Litecoin bulls is that the current surge in LTC has been backed by some of the biggest daily volume bars of 2022 and a general uptrend in trading volume. A general rule of thumb is that rising prices with lower or tepid volume are difficult to trust but if volume is rising then this is a sign of fuel to support the rally.
That said, the volumes are lower than what was recorded during previous bull runs. This may suggest that this current price rally may not have the fuel to reach the heights of previous bull cycles.
The Relative Strength Index (RSI) is a momentum indicator. It assesses the speed and magnitude of a security’s recent price changes to evaluate whether it is overbought or oversold based on the veracity of the move. A price that moves too quickly too soon in either direction suggests is being overbought or over-sold. The general rule-of-thumb is that an RSI over 70 indicates that an asset may be overbought and a reading of 30 indicates that an asset is oversold.
The current RSI for Litecoin (LTC) is ~63 which suggests that the asset is not overbought yet.
 Brave New Coin reaches 1M+ engaged crypto enthusiasts a month through our website, podcast, newsletters, and YouTube. Get your brand in front of key decision-makers and early adopters in 2026. Limited slots remaining! Find out more today!