Bitcoin Price Analysis – On-chain metrics remain strong despite an increasing likelihood of a significant pullback

![]()
Although the trend is strongly bullish, technicals on higher time frames show signs of overbought conditions and waning bullish momentum.
Bitcoin (BTC) is a decentralized digital currency created by Satoshi Nakamoto and released in 2009. The spot price has increased 177% from the low set in December 2018, but remains down 56% from the current all time high set in December 2017. The BTC market cap currently stands at US$154.37 billion, with US$5.5 billion traded in the past 24 hours.
The rolling 90-day Pearson correlation between BTC and the top 10 cryptocurrencies continues to support bull market conditions. Generally, BTC and the rest of the high market cap coins are highly correlated during a bear market and less correlated during a bull market. Since April, correlations for major coins and BTC has fallen significantly.
Since the beginning of the year, Monero (XMR) and Ethereum (ETH) have had the longest period of positive high correlation whereas Binance Coin (BNB) and Tron (TRX) have had the longest period of positive low correlation. BNB is currently the least correlated coin to BTC by a significant margin.

Source: coinmetrics.io
On the network side, BTC on-chain transactions per day have continued to rise since April 2018, and are now sitting near the record high set in mid-December 2018 (line, chart below). The average BTC transaction value in USD (fill, chart below) has risen to over US$22,000 after a low of US$6,360 in February. Transaction values peaked on the BTC network in mid-December 2017 at nearly US$100,000.

Source: coinmetrics.io
The rise in on-chain transactions per day from October 2018 to March 2019 can predominantly be attributed to VeriBlock (VBK), which secures other blockchains through the “Proof of Proof” (PoP) consensus mechanism. VBK transactions currently account for only 9% of total BTC on-chain transactions but for as much as 40% of transactions a few months ago.
These VBK transactions also accounted for at least half of all pending transactions in the mempool from March 25th to April 7th. The majority of these transactions are sent with a one satoshi transaction fee (blue fill, chart below). Currently, the mempool is nearly empty with fewer than 12,000 transactions pending, suggesting any congestion is continually being cleared efficiently.

Source: https://jochen-hoenicke.de/queue
Bitcoin days destroyed (BDD) for the month of March clocked in near four year lows, likely signifying a period of accumulation rather than the distribution of older coins. BDD spiked dramatically in December 2018 and surpassed the previous record set in August 2017. BDD has since declined rapidly but remained significantly elevated in January 2019, based on historical data. BDD has also been increasing month-over-month from March, April, and May.
BDD can be used to measure coin velocity over time. For example, if an address holds 10 BTC received 10 days ago, and the BTC is moved to another address, 100 BTC days have been destroyed. This metric accrues over time and resets any time the coins are moved. The months with the highest BDD have historically correlated with extreme highs or lows in price as long term holders begin to sell coins on an exchange. A spike in BDD in July 2017 was likely related to the Bitcoin Cash hard fork. However, this should not be seen as a 1:1 correlation. A rise in BDD can also represent custodial providers moving coins between wallets, which is typical of major exchanges or over the counter (OTC) brokers.

Source: oxt.me
Analyzing the age of UTXOs, or unspent coins, gives us a metric that is similar to BDD. Spikes in newly moved coins tend to correlate highly with local tops or bottoms in price, and can represent euphoria or capitulation. Coins which have not moved recently are represented in cooler colors wheres as coins on the move are represented by warmer colors.
Coins that have not moved in more than five years now account for 20% of the circulating supply. The 12-18 month age band, or coins not moved since June 2018 to December 2017, holds the next highest distribution at 15% of the circulating supply. Although the lower age distributions, less than one-month old, have been rising recently, there has not been a sudden drop off in these bands to suggest the formation of a local top at the current price level.

Source: https://plot.ly/~unchained/37.embed
The 30-day Kalichkin network value to on-chain transactions ratio (NVT) has continued to rise since January, and is currently above 33 (line, chart below). The record high for the 30-day Kalichkin NVT was set on December 2013, which corresponded with the record high at that time.
Based on this metric, the probability for a local top in price continues to increase. While Kalichkin’s NVT does not account for inflation or the use of off-chain transactions, which would decrease the overall NVT ratio, the metric remains in the upper-third of the historic range, which paints a bearish picture.
Daily active addresses (DAA) had been ranging between 550,000 to 675,000 over the past few months (fill, chart below) but recently surpassed 819,000, hitting a new yearly high. On December 30th, 2017, DAA exceeded one million. A large uptick or sustained increase in DAA should be seen as a bullish indicator for price as it suggests an increase in on-chain BTC demand. As off-chain transaction facilities increase, daily active addresses may stagnate or decline over time.

Source: coinmetrics.com
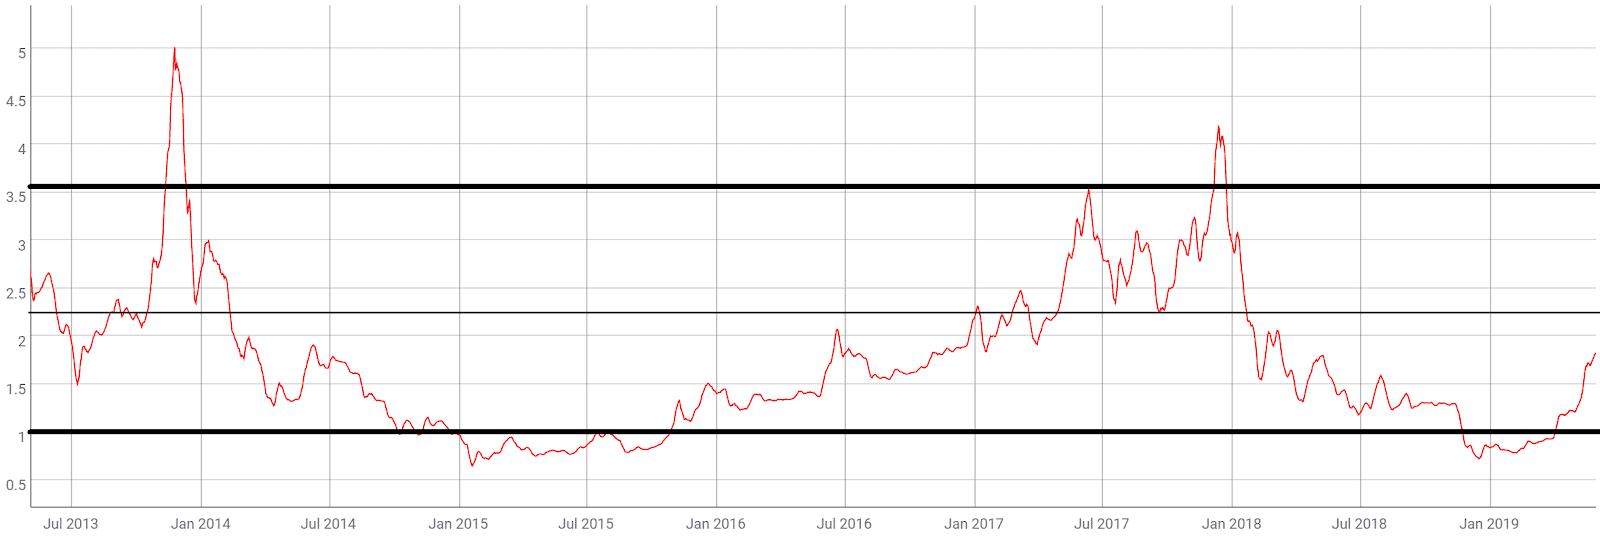
Another crypto-native fundamental metric is the MVRV ratio or the market cap divided by the realized cap. Realized cap approximates the value paid for all coins in existence by summing the market value of coins at the time they last moved on the blockchain. The metric was created through a combination of efforts by Murad Mahmudov, David Puell, Nic Carter, and Antoine Le Calvez.
Historically, periods of an MVRV less than one have represented oversold conditions, whereas periods of an MVRV greater than 3.5 have represented overbought conditions. Both MVRV levels above four have represented all-time highs in price. Currently, MVRV is under the median of both extremes, suggesting the potential for additional upside.
Source: coinmetrics.io
Turning to mining fundamentals, the network hash rate and difficulty have increased significantly since late December last year, indicating a substantial increase in mining activity. Historically, the BTC network has only had three periods of monthly decline in mining difficulty, all three of which have corresponded with the bottom of a bear market. Mining difficulty hit a new all-time high this month.
Network difficulty adjusts up to +/-25% after 2016 blocks have confirmed. As hash rate decreases before a difficulty adjustment, block times increase. As hash rate increases before a difficulty adjustment, block times decrease. Average block times are currently just under 10 minutes with an estimated 7% increase in difficulty projected for the next adjustment in 11 days.
The BTC network is secured by the SHA-256 consensus algorithm. The most profitable SHA-256 ASIC miners currently available are the; ASICminer 8 Nano Pro, Bitfury Tardis, Bitmain Antminer S17, and Innosilicon T3+ 52T. Three SHA-256 ASIC miners are set to be released later this year, the; MicroBT Whatsminer M20S, StrongU STU-U8, and MicroBT Whatsminer M21. Network factors that influence mining profitability include; price, block times, difficulty, block reward, and transaction fees. The next block reward halving is currently set for May 2020, or a little less than one year from now.

Source: bitinfocharts.com
The total percentage of overt version-rolling ASICBoost on the network has ranged between 35% and 40% over the past few months, and currently accounts for approximately 38% of all blocks mined. SlushPool mined the first ASICBoost block on March 24th, 2018 and a Braiins OS mining system verified ASICboost capability on Antminer S9s in October 2018. Bitmain responded by releasing firmware to enable overt ASICboost on the Antminer S9. Overt ASICBoost spiked dramatically after mid-October 2018.
Unlike covert ASICBoost, overt ASICBoost has no detrimental effects on the network, while making mining more profitable by requiring less energy usage. Covert ASICBoost encourages small or empty blocks because the mechanism involves transaction reordering. Overt ASICBoost is also SegWit compatible whereas covert ASICboost is not.

Source: asicboost.dance
The average BTC block size (fill, chart below) has increased substantially since April 2018, with the weekly average block size establishing a new record high again this week. Thanks to the implementation of SegWit, the BTC block size limit is now roughly 2.2MB. Since June 2018, average block size has increased largely in part due to VBK transactions, with average transaction fees (line, chart below) now above US$4.00.
A low and non volatile transaction fee market can be partially attributed to the general decline in network use as a whole since December 2017. Additionally, an increase in transaction batching, SegWit use, and off-chain channels like the Lightning Network and the Liquid side chains have also contributed to removing network strain and keeping fees low.

Source: coinmetrics.io
Transaction Batching involves sending one transaction with many outputs instead of sending each transaction individually. Batching is most effective when used by high transaction volume market participants, such as crypto exchanges and miners, which benefit substantially from the reduced fees. As batching increases, the transactions per day metric underreports the total individual transactions per day. Bitmex, one of the biggest crypto exchanges by reported volume, does not currently batch any of their transactions.
Transactions with only one output have declined steadily since March 2016 (red, chart below). About 88% of all transactions are currently sent with at least two outputs. Transactions with three to four outputs have risen substantially since January 2018 and currently represent 16% of all transactions (yellow, chart below).

Source: https://p2sh.info/dashboard/db/batching
The number of transactions sent using SegWit reached a record high of 47.8% in late March 2019. This metric has risen and fallen directly with the end of VBK testing and the launch of the VBK mainnet, suggesting that VBK does not currently use SegWit transactions. The number of SegWit transactions, as a percentage of total volume, accounted for 90% of BTC on-chain volume in mid-January but has recently dipped to less than 50%.
SegWit, or BIP141, was activated on August 23rd, 2017 via a user activated soft fork and allows individual transactions to occupy less block space than a traditional transaction. Although both non-SegWit and SegWit transactions can be sent over the network, SegWit users pay less in accumulated fees to achieve the same number of transactions. SegWit also allows for an effective blocksize limit above 2MB. As fees on non-SegWit transactions have declined significantly since December 2018, users may feel less inclined to use SegWit addresses.

Source: https://p2sh.info/dashboard/db/segwit-usage
SegWit also enabled the possibility of further second layer network utilities like the Lightning Network (LN), which facilitates trusted, bidirectional, off-chain, hub and spoke payment channels. The LN also paves the way for the possibility of instant payments, micro and nano-transactions, and increased network scalability.
Since going live on March 15, 2018, the LN has continued to rapidly gain traction. There are nearly 41,000 available channels, with a total channel value of 1035 BTC, or US$8.5 million. The channels work much like a tab at a restaurant, which remain open until the client settles the bill. This format allows for numerous transactions to occur with one on-chain network fee, after the channel is closed. Transactions sizes are currently capped at ~0.04BTC while the network is still being developed and built.

Source: https://p2sh.info/dashboard/db/lightning-network
Turning to developer activity, Bitcoin Core version 0.18.0 was released last month, providing various bug fixes and performance improvements. The BTC project on GitHub has two active repos, “bitcoin” and Bitcoin Improvement Protocols, “BIPs”. Over 170 developers have contributed over 1,800 commits in the past year, mostly on the bitcoin repo (shown below).
Most coins use the developer community of GitHub where files are saved in folders called "repositories," or "repos," and changes to these files are recorded with "commits," which save a record of what changes were made, when, and by who. Although commits represent quantity and not necessarily quality, a higher number of commits can signify higher dev activity and interest.
Future potential protocol improvements in the pipeline include Schnorr signatures, Taproot, and Graftroot. Schnorr signatures and signature aggregation also bring the potential for storage and bandwidth reduction by at least 25%. Taproot and Graftroot improve upon Merkelized Abstract Syntax Trees (MAST) which offers three benefits; smaller transactions, more privacy, and larger smart contracts.

Source: https://github.com/bitcoin/bitcoin/graphs/contributors
BTC exchange traded volume over the past 24 hours has been dominated by Tether (USDT) trading, with the United States Dollar (USD) markets representing 7.66% of total volume. Stable coin volumes, which have grown to account for over 50% of volume over the past few months, represented more than 82% of all reported BTC volume in the past 24 hours.
In Asia, volume on the Japanese Yen (JPY), Korean Won (KRW), Chinese Yen (CNY) pairs have remained subdued throughout the past few years and currently account for less than 3.5% of total volume. These Asian fiat markets may increase substantially if regulatory scrutiny in the region is clarified or if domestic mainland Chinese exchanges open again.
Several potentially game-changing BTC services are also in the works and slated for launch this year. In March, Fidelity Digital Assets announced the launch of a custody service to a select group of eligible clients. The financial behemoth manages over US$2.45 trillion in assets. Bakkt, which raised US$182.5 million from 12 partners and investors in 2018, is also set to launch a physically delivered BTC futures product some time this year. Bakkt is a subsidiary of the Intercontinental Exchange, which also runs the New York Stock Exchange. Starbucks also received a significant equity stake in the Bakkt BTC futures platform.
Fresh applications for the Bitwise and VanEck-SolidX BTC ETFs were also submitted in February to the U.S. Securities and Exchange Commission (SEC). All previous BTC ETF proposals have been rejected by the U.S. regulator, while several other BTC ETNs are available worldwide, and are seeing increasing volumes. Last month, the SEC delayed decisions on both ETF applications. The deadline for the final SEC decision on the pending U.S. ETFs is set for early December 2019.

Global over the counter (OTC) volume, from LocalBitcoins.com, finished 2018 on a high but has declined as BTC price has increased. Global notional volume has held near or above US$50 million since the beginning of the year. The biggest increases in BTC and notional volume over the past few months have come from South American countries where inflation or hyperinflation has devalued local currencies. Notional volume has also recently spiked in Hong Kong, India, Iran, Kazakhstan, Kenya, Japan, Mexico, Poland, South Africa, South Korea and Thailand. In late May, LocalBitcoins discontinued servicing Iran, likely as a result of US sanctions. On June 1st, LocalBitcoins disabled paying for BTC with in-person cash trades.

Google Trends for the term "bitcoin" has increased dramatically over the past few weeks, marking a new yearly high. Throughout the course of 2018, “bitcoin” related searches declined dramatically. Despite the declining interest, the search “what is bitcoin” was the most popular “what is” Google search of 2018.
A slow rise in searches for "bitcoin" preceded the bull run in Q4 2017, likely signaling a large swath of new market participants at that time. A 2015 study found a strong correlation between google trends data and BTC price whereas a 2017 study concluded that when U.S. Google "bitcoin" searches increased dramatically, BTC price dropped.

Technical Analysis
The spot BTC prices have continued to defy gravity over the past week after being fueled by a market-wide USDT exodus. Institutional demand, the U.S. and China trade war, and potential Chinese capital flight, may have also contributed to ongoing buying pressure.
However, as the cryptocurrency continues to move higher, a roadmap for key decision points of price action can be found using exponential moving averages (EMAs), volume profile of the visible range (VPVR), Ichimoku Cloud, and chart patterns. Further background information on the technical analysis discussed below can be found here.
On the daily chart, the spot price relative to the 50-day and 200-day EMAs can be used as a litmus test for the trend. Price surpassed the 50-day EMA in mid-February and surpassed the 200-day EMA on April 2nd. The EMAs crossed bullishly in late April, representing an end to the almost year-long bear trend. The 50-day EMA is currently at US$7,100 and 200-day EMA is currently at US$5,600, both should now act as support. VPVR (horizontal bars) also shows a large volume node at US$6,500, which should also act as support.
Over the past week, price has developed a bearish divergence on both volume and RSI, suggestive of waning bullish momentum. Long/short open interest on Bitfinex (top panel, chart below) is now 52% long with shorts rising slightly over the past week.

Turning to the Ichimoku Cloud, there are four key metrics; the current price in relation to the Cloud, the color of the Cloud (red for bearish, green for bullish), the Tenkan (T) and Kijun (K) cross, and the Lagging Span. The best entry always occurs when most of the signals flip from bearish to bullish, or vice versa.
On the weekly chart, the Cloud metrics are bearish; price is below the Cloud, the Cloud is bearish, the TK cross is bearish, and the Lagging Span is above price and below the Cloud. A long entry based on traditional Cloud strategy would not be warranted until price breaches the Cloud.
Based on price action over the past several weeks, all comparisons to 2014, 2015, and 2016 have been negated. There was virtually no resistance at US$6,500 (Kijun) with the next high probability target at US$10,000. The Kumo, which represents a 50% retracement of the previous range, should act as a magnet for price. Any retracements should find support at the Kijun, currently US$6,580.

On the daily chart, Cloud metrics remain 100% bullish; price is above the Cloud, the Cloud is bullish, the TK cross is bullish, and Lagging span is above both the Cloud and price. After a Kumo breakout, bearish or bullish, the probability of a new trend forming rises substantially. During this period, price returns to the Kijun many times to confirm support before trend continuation, this is known as a Kijun Bounce. Currently, the Kijun sits just below the US$7,000 level. A sustained Tenkan-Kijun disequilibrium suggests overbought conditions with a lower likelihood of bullish continuation.

On the four hour chart, using a line graph instead of candlesticks, Cloud is also mostly bullish aside from the recent TK cross-recross, which is currently bullish. There have been several Kijun bounces on this timeframe with an intact trend since May 1st. Price currently sits on a critical support level based both on the Cloud and a diagonal trendline.
Price has also formed a bearish reversal pattern known as the Rising Wedge. Hallmarks for this pattern include higher highs and higher lows on less and less volume. Pullback targets are measured from the maximal width of the wedge, projected downward from the break down point. This target would bring price at least to approximately the US$6,800 zone.

Lastly, the opening and expiration dates of the Chicago Mercantile Exchange (CME) BTC cash-settled futures contracts, launched in December 2017, have had a significant impact on price. The CME facilitates trades for the largest portion of derivatives contracts in the world. Last month, the CME saw the highest notional volume ever in a single day for the BTC futures product, exceeding US$1.5 billion. Historically, price volatility tends to increase dramatically nearest any active contract expiration. The next key zone for increased volatility will likely come near the expiration of the December 31st to June 28th contract.

Conclusion
Once again, network fundamentals continue to show signs of increasing growth, including; transactions per day, daily active addresses, and mining difficulty. As long as the markets remain bullish, miners will likely continue to add hash rate as mining profitability remains positive. The fee market has also begun to increase slightly week-over-week, further supporting increased mining activity. Other metrics like NVT show an increasing likelihood of a pending pullback in price, whereas MVRV suggests plenty of upside potential in the current trend.
Although the trend is strongly bullish, technicals on higher time frames show signs of overbought conditions and waning bullish momentum. A Rising Wedge and a growing bearish divergence suggest a pullback has become increasingly likely. Support targets sit at US$5,600 (200-day EMA), US$6,500 (weekly Kijun and VPVR volume node), US$7,000 (50-day EMA). Should bullish momentum persistent, albeit a low probability, the nearest upside target, based on the weekly Cloud, sits at US$10,000.
 Brave New Coin reaches 1M+ engaged crypto enthusiasts a month through our website, podcast, newsletters, and YouTube. Get your brand in front of key decision-makers and early adopters in 2026. Limited slots remaining! Find out more today!


