BNB Price Analysis: It’s alright to look like a security

BNB, the native token of Binance—the world's most popular crypto-to-crypto exchange—has quickly risen to become a top-15 digital asset. While its value has suffered under the paw of the bear market, its long term appeal remains driven by Binance’s ability to maintain profits—something that, so far at least, it appears to be very good at.
The Binance coin (BNB) an ERC-20 token, has emerged in popularity as a comparatively stable crypto diversification option over the last year, backed by the strength of the Binance exchange.
The token currently has a market cap of over USD 1.2 billion and is the 13th largest cryptographic asset. Binance handles over a billion dollars worth of volume daily, and consistently ranks as the world’s busiest crypto exchange by legitimate volume.
The design of the BNB token means its utility and value is closely tied to the performance of the Binance exchange. The primary use of the token is to gain discounts (on top of the already low 0.1% fees) when trading on its native platform.
This discount was initially 50% but reduced to 25% in July. It will further reduce to 12.5% in 2019, then 6.25% the year after, until year five, at which point there will no longer be discounts.
The diminishing reward system gives the BNB token a ‘get it while it’s hot’ appeal that plays into its value and adds positive pressure to short term demand
The popularity and strength of Binance also plays into BNB’s primary utility, because it means more orders and faster settlement of a transaction, increasing BNB’s value for trading.
Binance company profits are also directly tied to BNB’s value forming the basis of the token’s 2nd value proposition, access to quarterly buybacks exclusive to BNB holders. In the Binance whitepaper, a repurchasing program is detailed where Binance says it will use ‘"20% of our profits to buy back BNB and destroy them, until 50% of all the BNB (~100MM) is bought back."
This indicates that the value of the buyback/coin burn changes depending on the financial performance of the Binance exchange, which earns profits through trading fees (including non-BNB pairs), listing fees (US$ 200,000 per on average), advertising etc, giving BNB security-like tendencies.
However, as Binance CEO Changpeng Zhao (colloquially known as ‘CZ’) discussed on a recent episode of the Unchained podcast, BNB coins are non-traditional assets with a number of unique characteristics that differentiate them from regular securities, and a number of international jurisdictions acknowledge this, allowing the token to operate without the regulatory restrictions of traditional security law.
In a recent blog post, CZ revealed profits of 200 million USD in Q1 2018, growth of over 2500% from the previous period and announced that the company had also scaled to employing over 250+ employees. Put in perspective,these profits exceed those of traditional financial powerhouse institutions like Deutsche Bank, over the same period and further underline Binance’s size and influence within the crypto space.
During a speech on September 18th, coinciding with the start of Consensus: Singapore CZ announced the beta launch of a fiat-to-crypto Singapore only Binance product that will permit the swapping of Singapore dollars (SGD) with BTC and ETH. This move beyond merely crypto-to-crypto, continues Binance’s noteworthy expansion within the crypto infrastructure space.
If growth like this continues, BNB’s coin burns (which CZ has likened to a share dividend) will keep getting larger (until the limit is hit), again increasing the token’s FOMO appeal with burns occurring every quarter for a limited period.
Exchanges and trading Pairs
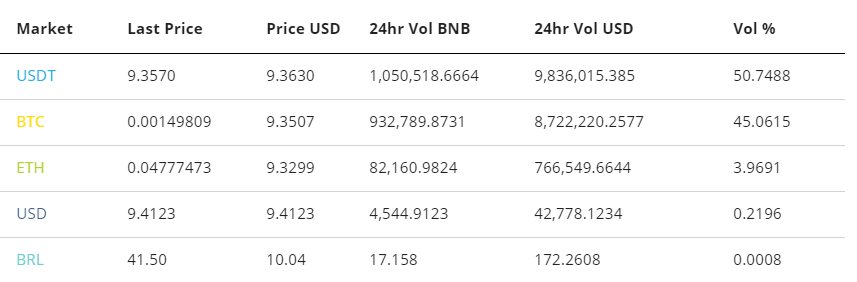
Interestingly, the most popular BNB trading pair is USDT, a US dollar pegged stablecoin. BNB has previously been considered a ‘stablecoin‘ because of the underlying strength and strong performance in the long term bear market (it trades up ~410% vs BTC over the last year).
However, over the last 90 days the price of BNB has fallen by ~41%, from over $16 to under $10. Clearly BNB has lost some of its appeal as a stable hedge vs volatile crypto given its recent price struggles.
The next most popular BNB pairs are the crypto-to-crypto BTC/BNB and ETH/BNB pairs which make up close to 49% of the trading volume of BNB.
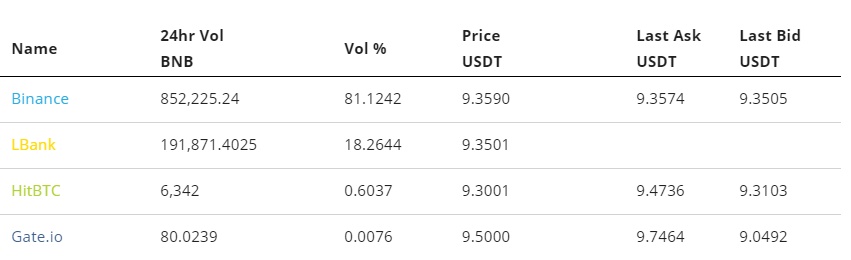
Unsurprisingly, Binance is the most popular platform for trading the USDT/BNB pairs, handling over 850,000 tokens daily, worth close to US$8 million and over 80% of the market for the pair. China-centric LBank handles over 15% of the volume within the pair and users of the exchange likely appreciate the speculative value of the BNB token, even if they cannot use it for lower trading fees.
On chain metrics
On chain Ethereum transaction information is currently available on Etherscan.io, which presents granular data on blockchain transaction volume (not just exchange information), and active addresses to be sourced.
Metcalfe’s law, a measure of network connections is a convenient tool for assessing an ecosystems network effect and true value. It’s usefulness is derived from the idea that a network is only as strong as its connections. For example the BNB token’s utility as a trading tool increases in value with more users and connections, because it means more buying & selling options for BNB pairs and less price slippage when using it to purchase other crypto.
The Metcalfe’s law data for BNB evidences an erratic trend, with general lulls in the number of connections perpetuated by spikes in user activity. It is possible that the spikes may be correlated with price action in crypto markets.
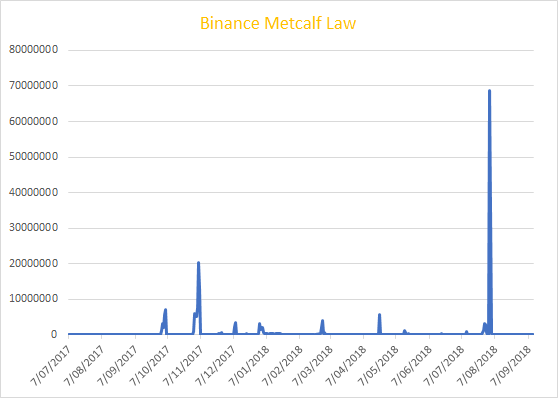
The large spike around 07/08/2018, came immediately following a sharp jump in digital asset trading volumes towards the end of July.
Between the 30th and 31st of July, BTC trading volumes rose 170%, while the jump in BNB active addresses occurred a day later between the 1st and 2nd of August. A possible explanation may be that there was an emergence of traders looking to diversify into BNB in order to access cheaper fees for high volume trades immediately following the jump.
However, the event still appears relatively random because during other spikes in crypto trading volume, such as in the 24 hour period between the 25th and 26th of June, there was no sharp jump in active BNB addresses.
The inconsistent ‘Metcalfe’s law’ movements indicates relative immaturity of the BNB product, and that active address growth is likely inorganic. Intuitively, ecosystems like Binance are most useful and valuable with more connections, and thus we should not observe large drop offs in users the way we do with the BNB network.
Token value to exchange volume
Another useful way to assess the token value of BNB, is to connect its price to the performance of the underlying Binance exchange because BNB’s value is clearly connected to the overall performance of the Binance platform.
Not only does the amount of the quarterly buyback depend on Binance’s profits, which is directly affected by volumes on the exchange, but there are also speculative considerations
For example, if the market observes the Binance exchange sitting at the top of crypto exchange rankings, this may nudge traders to gamble on the token because of FOMO speculation, viewing BNB as a security, tying it to Binance, in a similar way as has occurred with XRP and Ripple.
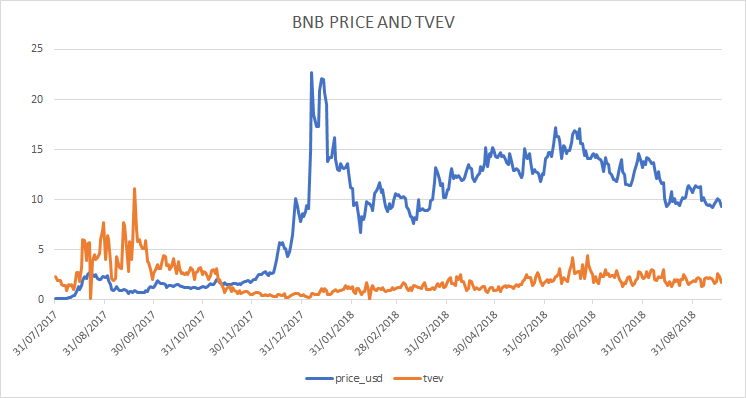
A metric used to assess the relationship between an exchange based token, and volume of the underlying exchanges was suggested by data scientists at Coinfi. Token value/exchange volume, or TVEV, is calculated using the ratio of token value (market cap) divided by 24hr Exchange volume.
The historical pattern for the TVEV of BNB indicates that in the first few months of BNB’s introduction, token value dominated exchange volume, evidenced by the rising orange line.
However, as crypto entered a boom period towards the end of the 2017 and BNB’s token value/price grew, Binance trading volumes rose concurrently. In fact the lowest TVEV values correlate with the highest prices of BNB.
This indicates that that the price jump in BNB towards the beginning of 2018, could be considered ‘fair’ given the growth in Binance exchange volume that came with it.
In recent times, BNB’s TVEV has stabilized around ~1.8 (Average TVEV last 7 months = 1.855, median TVEV over last 7 months = 1.8216). This indicates that in the short term, lower TVEV’s, for example a TVEV of under 1, is a signal that BNB’s price is temporarily more reflective of its true value given exchange volume on Binance, but is likely to eventually resettle towards a ‘steady state’ ~1.8 level, as unobservables such as speculation and wider market factors kick in.
To evidence this phenomenon, on 12/08/2018 BNB’s TVEV was 3.006 and its price was ~$11.71, on the 16/08/2018 BNB’s TVEV was ~1.86 and price was ~$9.74. This indicates that over the four day period, given the falling TVEV, that once TVEV deviated from a short term ‘steady’ state BNB’s exchange volume began to dominate token value in the TVEV equation, and downward pressure was put on BNB’s price until TVEV resolved around the 1.8 level.
The word ‘pressure’ is used specifically because crypto markets are prone to be affected by unobservables like speculative trading activity and market manipulation. This means there is no guarantee that a high TVEV will lead to a lower price, but a high TVEV is a clear signal that BNB may be overvalued.
On 19/09/2018, the TVEV of BNB sat at 1.70, very close to the proposed steady state TVEV of 1.8. This indicates any immediate term price movements, are not likely to occur because BNB is over or undervalued based on Binance exchange volume, and are more likely be driven by external factors, such as general market bearishness driven by news such as the recent regulatory hassles for the CME group’s crypto partners.
Technical analysis
Exponential Moving Averages (EMA) with Long Term Trends
On the daily chart, the bearish EMA cross, or death cross, recently occured as of September 8th, which is a negative price indicator. Additionally, the 50 day EMA (red line) is currently acting as price resistance. This trend reversal makes sense given BNB’s recent price troubles, falling from ~$16.50 back in mid-June to $9.77; a fall of ~40.79%.
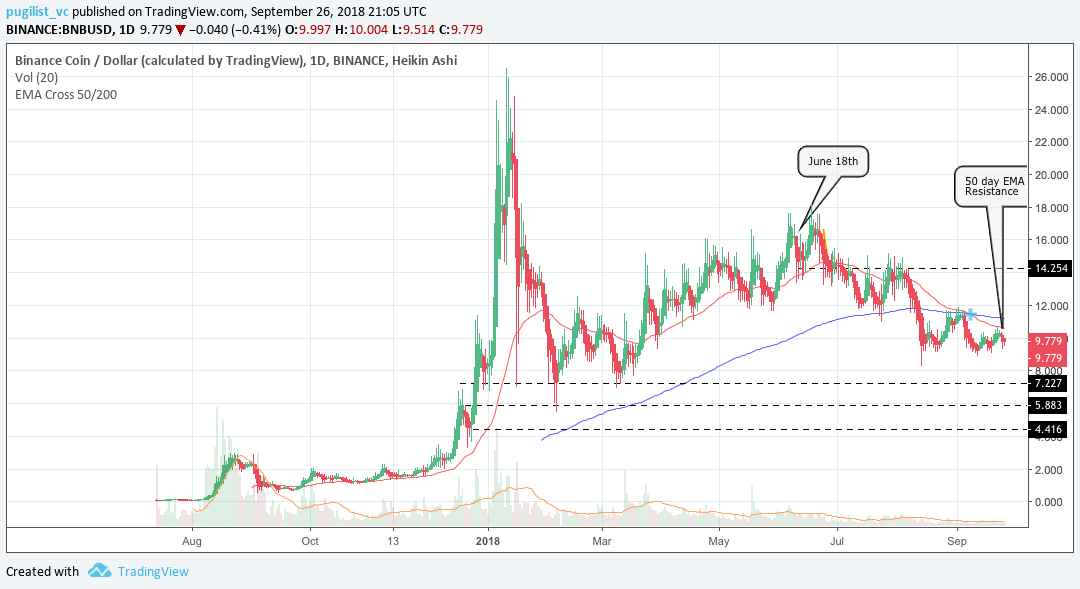
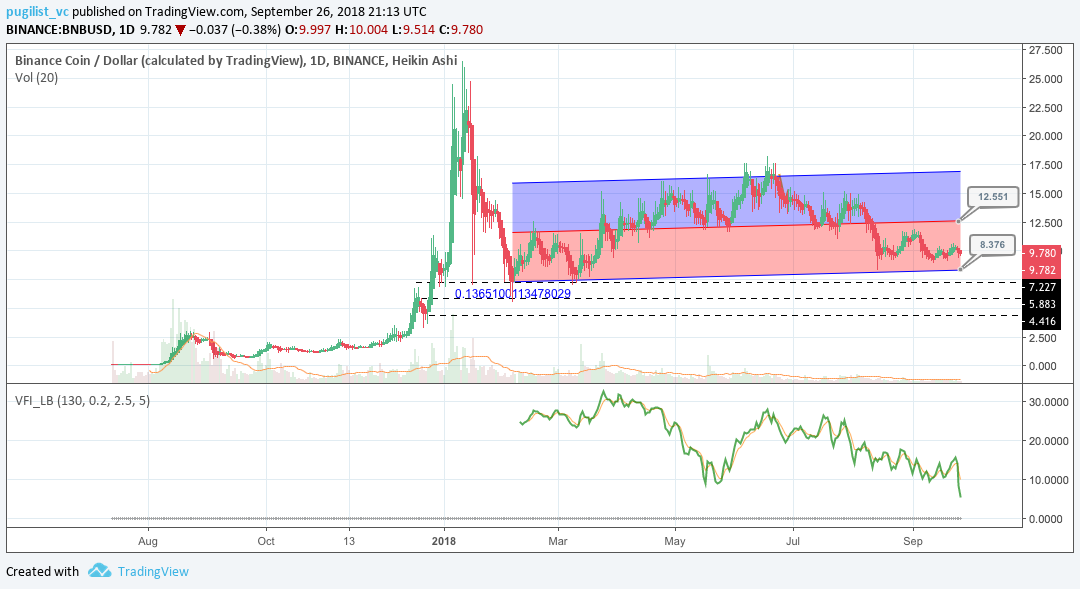
However, given BNB’s price growth in the first half of 2018, even with the consistent decline over the past 3 months, price is still positive for 2018, posting a gain of 16.45%. However, BNB has three points of positivity despite its price decline. First, the volume flow indicator (VFI) has always been above 0 and is still above 0 despite the declines, which shows bullish strength remains. The VFI interpretation is: a value above 0 is bullish and below 0 is bearish, with divergences between price and oscillator being high probability signals. Second, price is still trading within its linear regression band, with price nearing the bottom range of $8.37, which could signal a potential price bounce back to the long term mean (mean reversion) level of $12.50.
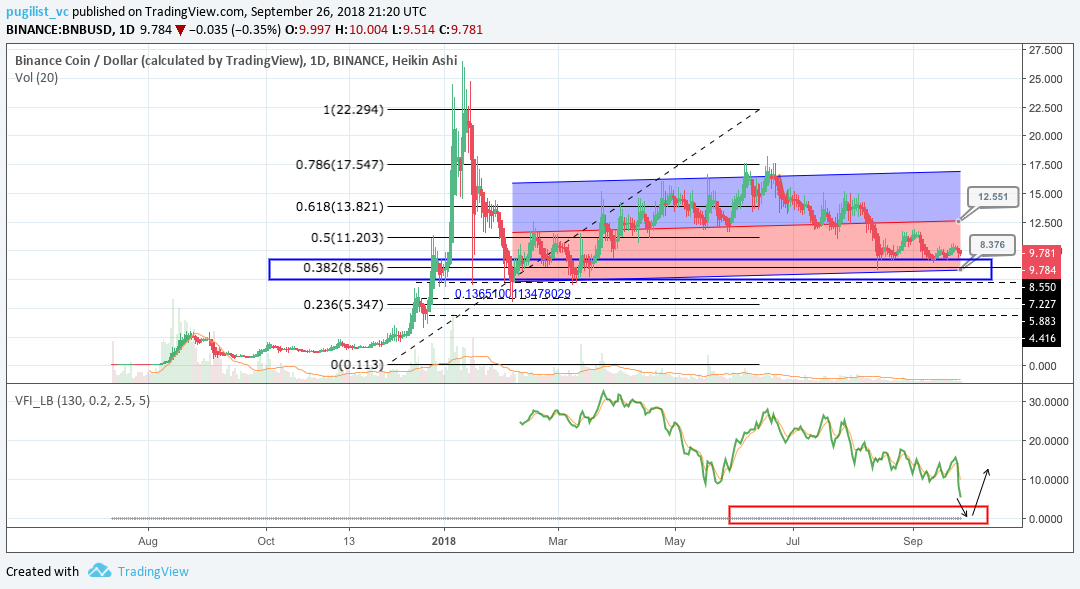
Lastly, the linear regression bottom level of $8.37 coincides with the 0.382 fibonacci retracement (blue box), which may fortify that support level, which enhances the mean reversion narrative. Additionally, the fibonacci retracement and linear regression support level may coincide with the VFI testing and holding the 0 level (red box).
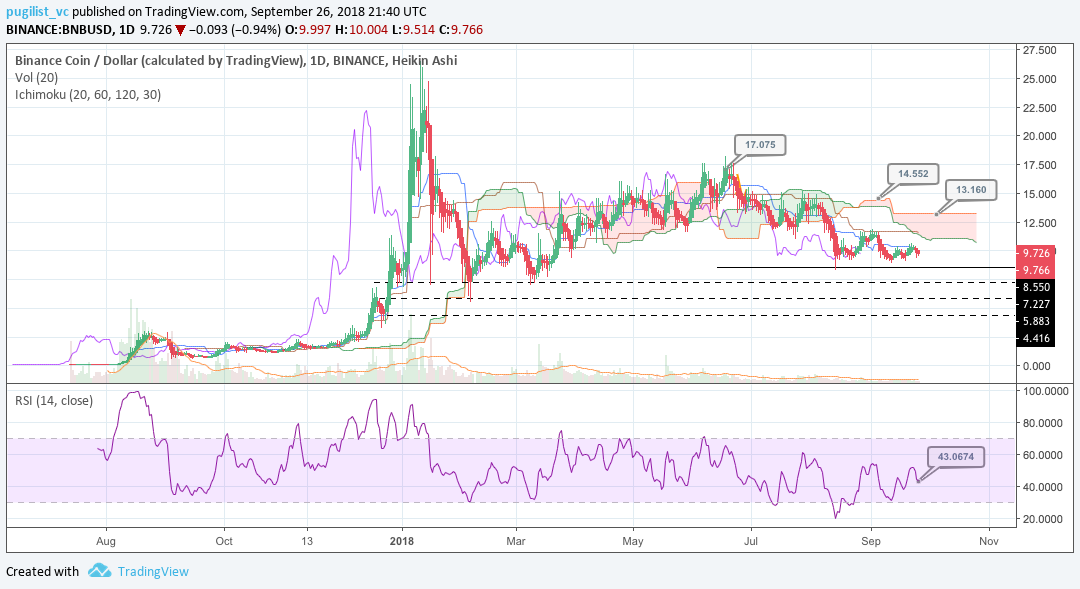
Ichimoku Clouds with Relative Strength Index (RSI)
The Ichimoku Cloud uses four metrics to determine if a trend exists; the current price in relation to the Cloud, the color of the Cloud (red for bearish, green for bullish), the Tenkan (T) and Kijun (K) cross, Lagging Span (Chikou), and Senkou Span (A & B).
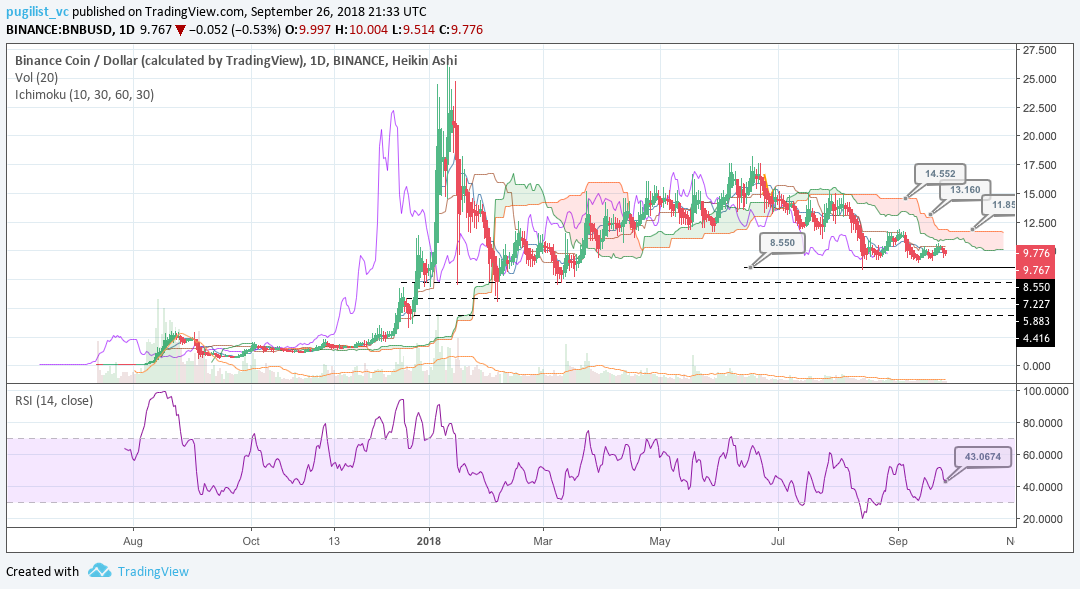
The status of the current Cloud metrics on the daily time frame with singled settings (10/30/60/30) for quicker signals is bearish; price is below the Cloud, Cloud is bearish, the TK cross is bearish, and the Lagging Span is below the Cloud and touching price.
A traditional long entry would occur with a price break above the Cloud, known as a Kumo breakout, with price holding above the Cloud. From there, the trader would use either the Tenkan, Kijun, or Senkou A as their trailing stop.
BNB is currently sitting at ~$9.77 and looking to trend towards a Kumo breakout. Also, the RSI is trending upward at 43, but still far from overbought territory of 70. The support levels for price are $8.50, $7, $6, and $4.50, while price targets for a successful Kumo breakout (breaking above $11.85) are $13 and $14.50.
The status of the current Cloud metrics on the daily time frame with doubled settings (20/60/120/30) for more accurate signals is bearish; price is below the Cloud, Cloud is bearish, the TK cross is bearish, and the Lagging Span is below the Cloud and touching price.
As mentioned, BNB is currently sitting at ~$9.77 and hoping to complete a Kumo breakout given the RSI still has room to run before reaching overbought territory. In the unlikely event of a successful Kumo breakout, price will need to breach $13.16 with price targets of $14.50 and $17.
Conclusion
The BNB token’s recent downward price momentum is reflective of the crypto bear market, with retail interest in crypto being driven towards lows for the year, and daily trading volumes for Binance also trending downwards.
However, BNB remains an appealing token because of its use as a trading discount tool, and the near guaranteed dividend-style quarterly buyback reward, given Binance’s strong financial position.
BNB also evidences relatively stable fundamentals (based on daily exchange volume, not on chain metrics), indicating maturity as an asset and providing useful tools to assess historical price movements.
BNB technicals have swung from firmly bullish earlier in 2018 to increasingly bearish. Both, the prudent short term trader (10/30/60/30) and longer term trader (20/60/120/30), on the 1D chart, will await a positive TK cross and Kumo breakout above $11.85 and $13.16, respectively, before entering a long position.
Both trader’s support levels are $8.50, $7, $6, and $4.50. In the unlikely event of a breakout, the (10/30/60/30) trader’s price targets are $13 and $14.50 and the (20/60/120/30) price targets are $14.50 and $17. Mean reversion traders may await a price fall to ~$8.37 before entering a long position with a price target of $12 (linear regression average and 0.786 fibonacci retracement level of $9 support level – black box).
 Planning your 2024 crypto-media spend? Brave New Coin’s combined website, podcast, newsletters and YouTube channel deliver over 500,000 brand impressions a month to engaged crypto fans worldwide.
Don’t miss out – Find out more today


