BNB Price Analysis: What goes up…

![]()
After a strong start to the year that saw it buck wider crypto price trends on the back of a star-studded conference and the BitTorrent ICO, BNB is returning to the real world with a bit of a thud. Fundamentals reveal underlying support, however, which may help price bottom out quickly — but for now, technicals remain primarily bearish.
Binance coin (BNB) is the native ERC-20 token of crypto mega exchange Binance. While primarily recognized as a tool to access cheaper trading on the platform, BNB’s investment profile is driven by multiple unique factors which can making it a challenging asset to value.
As well as offering a 25% discount when used to pay transaction fees (this will change to 12.5% in a few months), BNB also functions similarly to equity, with profits earned by Binance through trading fees being redistributed to BNB holders in the form of a token burn, functioning similarly to a dividend.
As a facilitator for on-ramping into other crypto, BNB’s value increases the more tokens it is paired with. Binance users with more than 500 BNB also receive double bonuses on referrals, while BNB holders have voting rights in the Binance Community Coin voting scheme meaning they can influence decisions around which new coins get added to the exchange.
In recent weeks, short term value has been driven by positive speculation created by a just concluded annual conference which signalled strong health for the Binance platform. An impressive list of speakers included crypto heavyweights like Morgan Creek’s Anthony Pompliano and Tron founder Justin Sun. Also driving interest in BNB was the Bittorrent token (BTT) sale which was conducted on the Binance Launchpad platform.
In the last month, backed by these events the price of BNB has risen a respectable ~3% in a bearish trending market displaying excellent hedging potential. Crypto benchmark BTC fell ~11.5% over the same period, the blockchain network which supports BNB, Ethereum fell ~24%, while the overall market cap for crypto shrunk ~16.5%.
However, BNB’s many pronged value proposition has not provided it with complete immunity from the crypto bear market. It is down ~73% from an all time high of ~$22.5 (Index price) currently trading at ~$6.09 (Index price). With both value drivers now fizzled out, the price of BNB has fallen over 10% in under five days — and holders must now decide whether to sell in expectation of further corrections, or maintain their positions based on long term value considerations.
Exchanges and trading pairs

7 day-BNB price and volume chart. Orange line represents an Index price comprising of the 5 most popular BNB markets, which are listed on the table to the right.
The most popular trading markets for BNB are typically liquid USDT and BTC options, which dominate over 85% of daily BNB trading. There is also a popular BNB/USD market that tends to trade at a discount versus crypto-to-crypto options. Likely because of the higher transaction fees generally associated with fiat-to-crypto trading. The USD value for the daily trading volume of the most popular BNB/USDT market sits at over USD 31 million a day.

Unsurprisingly, the most popular markets for BNB are on the associated Binance platform which manages the issuance and supply of the token.
The BNB/USDT and BNB/BTC markets on Binance handle over 65% of total BNB trading and are high liquidity, high velocity markets. Binance also offers a number of other altcoin pairs with BNB including ETH, TRX and XRP. The BNB token is also a popular trading option on some non-Binance exchanges, meaning some market participants are happy to simply hold the BNB and not utilize some of its inbuilt functionality such as being a tool access to cheaper trading fees.
Fundamental Indicators
Derived from the NVT ratio, the NVT signal is a responsive blockchain valuation metric developed by Willy Woo and Dmitriy Kalichkin. Crypto markets are prone to bubbles of speculative purchasing, not backed up by underlying network performance and activity. The NVT signal provides some insight into what stage of this price cycle a token may be in.
A high NVT signal is indicative of a network that is going through one of these bubble periods, and may move towards a position of becoming overbought/overvalued, because of the market’s speculative assessments running out of steam.
NVT alternative
Even though BNB functions as a ERC-20 smart contract token built on the Ethereum blockchain, most transactions of the token happen off-chain. This is by design, as much of the token’s transaction functionality is derived from primarily off-chain operations such as utility as a base pair to onramp onto a variety of crypto tokens, and transaction fee payments.
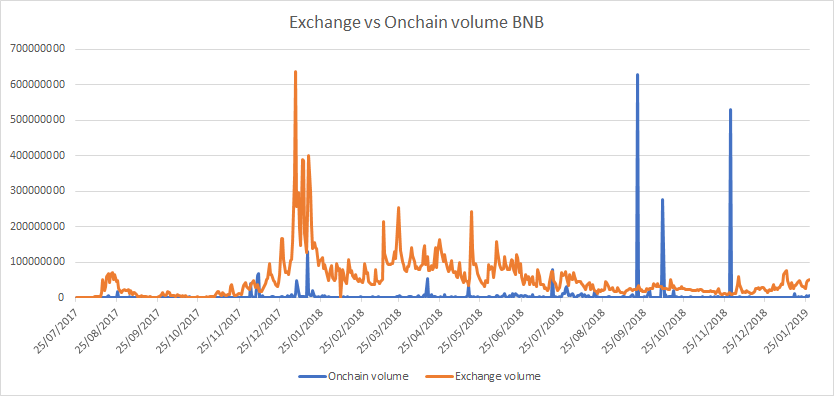
Irregular onchain volume pattern displayed by the BNB token. Unsurprising because most token operations happen off-chain.
This means that onchain transaction volume patterns are generally erratic for the network, making a traditional NVT signal difficult to use as an indicator for future price movements of BNB.
For this reason 24 hour BNB exchange volume is a better option than onchain transaction volume for traditional NVT signal.
The network value-exchange transactions (BNB) NVET signal, represents the utility/consumer product like value proposition of BNB. Rationale for using exchange volume as a utilization indicator being that the more BNB that is transacted across exchanges, the more it is utilized for inherent functions such as being an onramp onto other crypto pairs and is being collected by traders to be used to access cheaper trading fees.
Mismatches between price and the NVET create oversold and undersold indications.
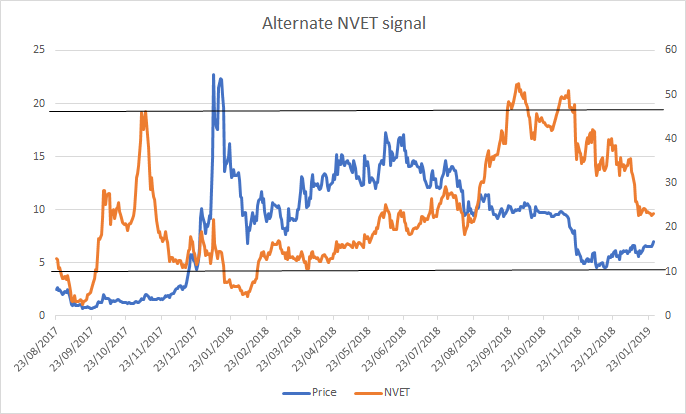
Network Value over Exchange Transactions – captured by taking the ratio of daily Market Cap (proxy for network value) and 30 day moving average (for smoothing) of daily average exchange volume of BNB. Black lines represent oversold and undersold regions. LHS Y axis= Price of BNB, RHS Y axis = NVET signal
NVET hit an oversold inflection point around late November 2018 and subsequently appeared to begin putting downward fundamental pressure on the price of BNB up to around the $5 level in mid-late December.
A combination of fundamental and speculative factors have driven the price of BNB upwards for most of the last month. Over the same period, NVET has trended downwards indicating the increase in usage of BNB during this period is happening quicker than the rise in token value.
This signals that price may continue to rise quickly based on speculation, without fundamentals pushing BNB towards an oversold level.
However, with the ICO launch of the Bittorrent token completed, price and velocity of BNB movement has already begun to slide downwards with short term utility now diminished.

7 day – BNB price and volume chart. Orange line represents an Index price comprising of the 5 most popular BNB markets, which are listed on the table to the right.
The downward price slide of BNB may be checked by the also falling NVET indicator, which could push it into oversold region more quickly than speculative assessments suggest. This considered, a short term bottom may be found quickly and based on historical signals, may be found between $5.80 and $6.05.
Note that NVET does not capture usage of BNB for transaction fee payments. It would be a more accurate indicator of fundamental network value with this information included.
TVEV
Another useful way to assess the token value of BNB, is to connect its price to the performance of the underlying Binance exchange because BNB derives fundamental value from the overall performance of the platform given the dividend buyback scheme.
Not only does the amount of the quarterly buyback depend on Binance’s profits, which is directly affected by volumes on the exchange, but there are also other speculative considerations.
For example, if the market observes the Binance exchange sitting at the top of crypto exchange rankings, this may nudge traders to gamble on the token because of FOMO speculation, viewing BNB as a security, tying it to Binance, in a similar way as has occurred with XRP and Ripple.
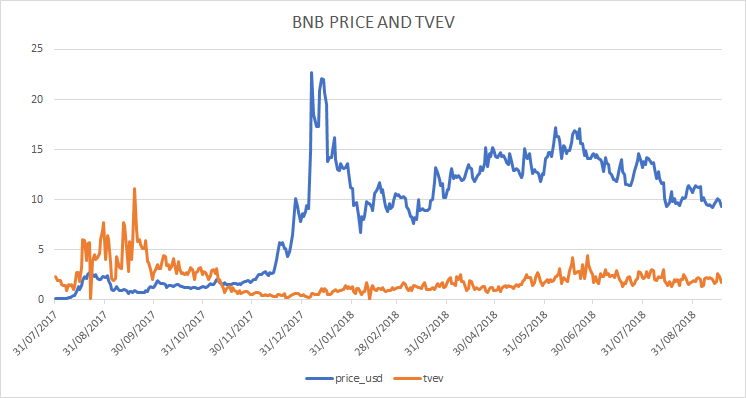
Token Value over Exchange Volume – Captured by taking the ratio of daily Market Cap (proxy for network value) and 30 day moving average (for smoothing) of total daily average exchange volume of Binance. Black lines represent oversold and undersold regions. LHS Y axis= Price of BNB, RHS Y axis= NVET signal
A metric used to assess the relationship between an exchange based token, and volume of the underlying exchanges was suggested by data scientists at Coinfi. Token value/exchange volume, or TVEV, is calculated using the ratio of token value (market cap) divided by 24hr Exchange volume.
If NVET represents the value of BNB as utility token, TVEV represents its value proposition as an equity buy in Binance. The historical relationship between price and TVEV, suggests that if there is a significant change in total transaction volume on the Binance exchange (not just BNB movements), then this will be reflected in the price of BNB. Logical because greater volume on Binance, means more transaction fees, generating greater revenues and profits that can be reimbursed to BNB holders.
The short term trend for TVEV suggests that total exchange volume on Binance has been rising more quickly than the token value of BNB, suggesting positive fundamental price pressure on BNB.
The 3 most popular trading markets on Binance are BTC/USDT, ETH/USDT and ETH/BTC, this suggests that volume on Binance should be partially detached from the post-news event selling pressure affecting BNB, and should still provide some fundamental support for the price of BNB.
Like the indications given by NVET, there is a possibility that fundamental support driven by volume on Binance could help BNB find a floor more quickly than expected.

The BTC/USDT as listed on BNC, trading volume in the markets (multi-coloured density chart) have been stable over the last week, Binance included. Contrasting the erratic volume patterns within BNB markets.
Technical Analysis
Moving Averages and Long Term Trends
On the 1D chart, the death cross, using the 50 and 200 day EMAs, has persisted since early September 2018. The 50 day EMA (red line) around $6.38 was acting as support, but price recently fell beneath that level.
Since the beginning of 2018, the price of BNB has been contained within a negative linear price trend with a Pearson’s R Correlation between time and price of ~0.63 (not shown), which is a stark change from early summer 2018, where BNB had positive returns for the year.
The aforementioned change in price momentum can be visualized by the faster (15 period) and slower (30 period) TRIX (black arrow) oscillator. The slower TRIX has been beneath 0 (oversold) since mid-July and has failed on several attempts to re-breach 0 (red arrows).
Furthermore, price’s current attempt (red arrow) seems likely to fail too given the faster TRIX has begun to trade sideways, coupled with price failing to breach the $7.23 resistance level twice (red flags). All of which, make the resumption of price’s downward trend very likely.
Lastly, the recent boost in prices beginning in mid-December 2018 seems like a bounce from oversold territory with price following a fibonacci retracement pattern of the price drop. The aforementioned resistance level of $7.23 that price has failed twice to breach coincides with the 0.618 fibonacci retracement level, and price has nearly retreated to 0.382 level of $6.16.
Price has since fallen dramatically after nearing overbought territory on the RSI (red arrows), and currently, the volume flow indicator (VFI) is retreating back towards 0. If the VFI falls below 0, BNB going back towards $5.49 (0.236 fibonacci level) is almost certain, with a further fall to the prior support of $4.41 level, also likely. The VFI interpretation is a value above 0 is bullish and below 0 is bearish, with divergences between price and oscillator being high probability signals.
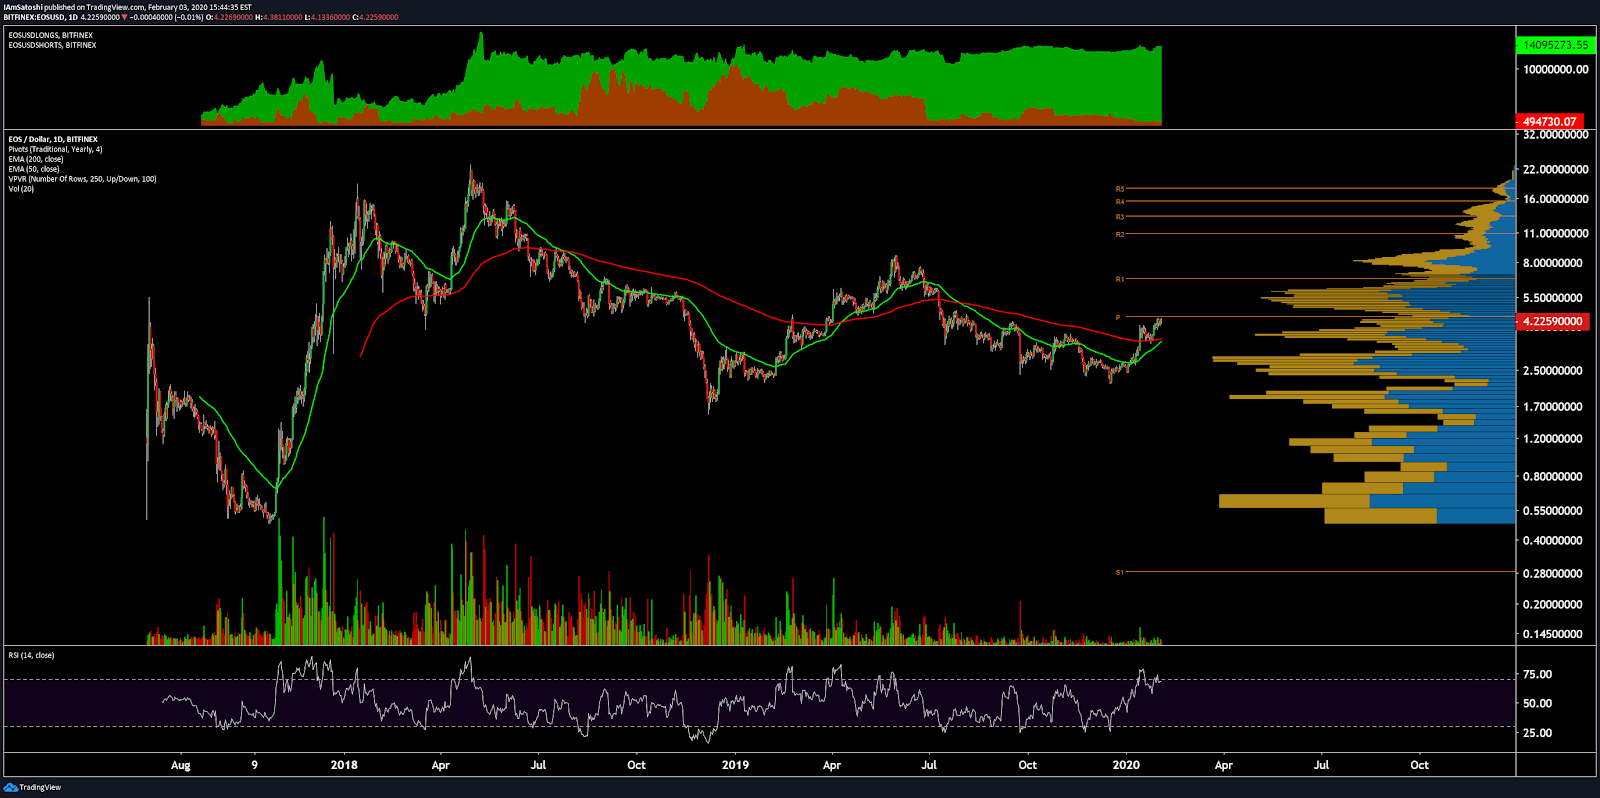
Ichimoku Clouds with Relative Strength Indicator (RSI)
The Ichimoku Cloud uses four metrics to determine if a trend exists; the current price in relation to the Cloud, the color of the Cloud (red for bearish, green for bullish), the Tenkan (T) and Kijun (K) cross, Lagging Span (Chikou), and Senkou Span (A & B).
The status of the current Cloud metrics on the 1D frame with singled settings (10/30/60/30) for quicker signals is mixed; price is in the Cloud, Cloud is bullish, the TK cross is bullish, and the Lagging Span is below the Cloud and above price.
A traditional long entry would occur with a price break above the Cloud, known as a Kumo breakout, with price holding above the Cloud. From there, the trader would use either the Tenkan, Kijun, or Senkou A as their trailing stop.
BNB recently attempted a Kumo breakout, but failed at the Senkou B resistance, which happened to coincide with prior resistance and fibonacci retracement 0.618 level of $7.23, coupled with RSI nearing overbought territory. Price is consolidating around $6.24 currently. Given the resistance ahead, plus declining momentum, price is likely to fall to $5.80 in the near term, which coincides with the bottom of the Cloud.
If RSI is in oversold territory at that point, price may have a chance to remain inside the Cloud and re-attempt a Kumo breakout. However, without a demonstrable increase in buying volume and momentum, this scenario is probabilistically low. In the unlikely event of a Kumo breakout, the price targets are $8.38 and $10.60. Price support levels are $5.80, $5.00, and $4.42.
The status of the current Cloud metrics on the 1D time frame with doubled settings (20/60/120/30) for more accurate signals is bearish; price is out of the Cloud, Cloud is bearish, the TK cross is bullish, and the Lagging Span is below the Cloud and above price.
On the slower settings, price did not make it nearly as far on its Kumo breakout attempt, and the odds for a successful re-attempt are far smaller. Again, in the unlikely event of a Kumo breakout, the price targets are $9.72 and $11.66.
Conclusion
For most of the last month, price of the BNB token has outperformed most other altcoin options backed by news events which added to both its short term value as a utility, and its long term appeal as semi-equity in the Binance platform. However, with the news events now both wrapped up, price corrections have been sharp. Because of the anxious nature of retail dominated crypto markets there is a possibility that this correction may be sustained and deeper.
Nonetheless, fundamental indicators signal that there may be incoming support which will help BNB quickly find its temporary price floor (it may have already been found). The token also maintains a solid long term value argument because of the overall growth of the Binance platform in spite of falling demand for crypto spot trading in the long term bear market.
The long term technicals for BNB are firmly bearish and show few signs of abating in the near future. Both, the prudent short term trader (10/30/60/30) and longer term trader (20/60/120/30), on the 1D chart, will await a positive TK cross and Kumo breakout above $7.23 and $8.24, respectively, before entering a long position. Both trader’s support levels are $5.80, $5.00, and $4.42. In the unlikely event of a breakout, the (10/30/60/30) trader’s price targets are $8.38 and $10.60 and the (20/60/120/30) price targets are $9.72 and $11.66.
 Brave New Coin reaches 1M+ engaged crypto enthusiasts a month through our website, podcast, newsletters, and YouTube. Get your brand in front of key decision-makers and early adopters in 2026. Limited slots remaining! Find out more today!


