BNB Price Prediction: $690 Make-or-Break Retest Could Decide Between $1,400 Rally and $290 Crash

BNB is trading near $690 as conflicting Elliott Wave projections and bearish chart patterns put its recent macro breakout under pressure.
The $690–$700 region has emerged as a critical retest zone, with analysts watching whether buyers can defend the level or allow a deeper correction.
BNB price remains above its 200-day moving average, suggesting that its longer-term market structure has not completely deteriorated. However, negative MACD momentum and resistance from shorter-term moving averages indicate that a sustained recovery has yet to materialize.
BNB Faces a Critical $690 Retest as Elliott Wave Scenarios Diverge
BNB is approaching an important technical decision point after retreating from its late-October highs near $750. The cryptocurrency was trading around $694–$696 in early November 2026, with recent sessions showing a modest recovery from lows near $684–$687.
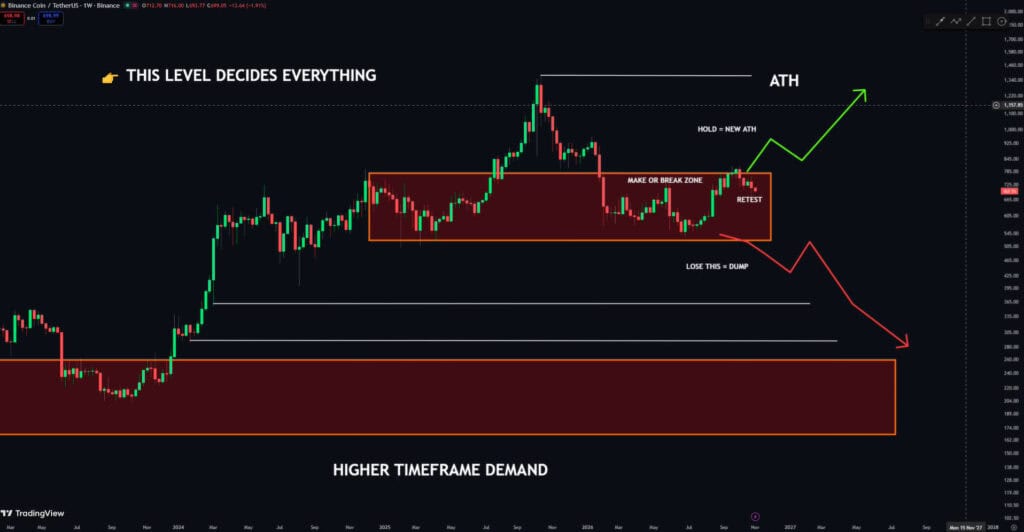
BNB is retesting a critical weekly support zone after breaking its macro range, with the outcome likely to determine its next major price move. Source: @MarzellCrypto via X
The current price area aligns with a weekly breakout retest identified by crypto analyst @MarzellCrypto. In a November 3 analysis, the trader described the region as a “make-or-break” level that could determine BNB’s next major directional move.
The bullish scenario depends on buyers defending the former macro resistance area as support. If the retest holds, the previous breakout structure could remain intact, keeping the possibility of new all-time highs open. However, a sustained loss of support could expose BNB to lower price levels around $365 and potentially $290.
Despite outlining these downside risks, MarzellCrypto maintains a bullish bias while the breakout zone remains defended. The distinction is important because a successful retest would indicate that buyers are still willing to accumulate near the former resistance level.
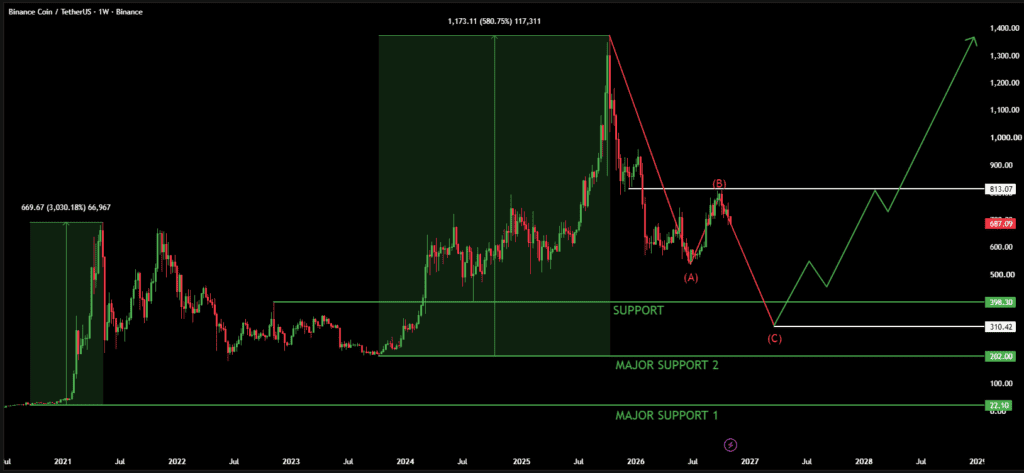
The bullish setup remains intact unless BNB records a weekly close above $813, with a successful hold of the lower support zone potentially paving the way for a rally above $1,400. Source: @WhaleFactor via X
A separate analysis from WhaleFactor presents a considerably deeper corrective scenario. Its weekly Elliott Wave count identifies an ABC correction following a rally of approximately 580%, which carried BNB to a peak near $1,173.
According to the analysis, Wave B encountered rejection around $813, leaving the token exposed to a potential Wave C decline. WhaleFactor identifies a broad completion zone between $398 and $310, where a longer-term bottoming structure could develop.
The analyst’s projected bearish count remains valid unless BNB records a weekly close above $813. If the projected correction eventually reaches its lower target zone and buying interest returns, the next potential impulse wave could carry the asset above $1,400.
These projections represent separate technical scenarios rather than confirmed price outcomes. The $290–$398 region reflects the deeper downside estimates, while the $1,400 target depends on a successful corrective bottom and subsequent bullish reversal.
Head and Shoulders Pattern Adds to BNB’s Bearish Technical Outlook
Shorter-term chart signals are adding another layer of uncertainty to BNB’s recovery attempt. TradingView analyst DamonEdge has identified a bearish Head and Shoulders formation on the daily BNB/USDT chart, suggesting that selling pressure may continue if the token fails to reclaim its broken neckline.
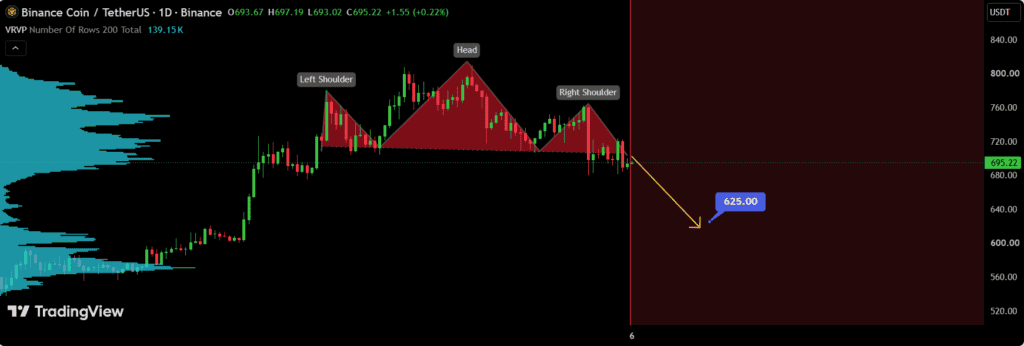
BNB’s break below the neckline and failed recovery reinforce the bearish outlook, with further downside toward $625 expected if the price remains below this level. Source: DamonEdge on TradingView
The pattern consists of three peaks, with the middle peak forming the head and the two surrounding peaks creating the shoulders. In this case, the right shoulder failed to reach the height of the head, indicating weakening buying pressure during the recovery attempt.
More importantly, BNB has already moved below the neckline. The subsequent rebound also failed to establish a sustained recovery above that level, strengthening the bearish interpretation of the formation.
DamonEdge identified $625 as the next downside target if the breakdown remains intact. The analyst stated, “As long as BNB remains below the broken neckline, I expect selling pressure to continue.”
This projection introduces another downside level between the current trading range and the deeper targets identified by MarzellCrypto and WhaleFactor. A move toward $625 would represent an initial test of bearish momentum rather than confirmation of a broader breakdown toward $365 or $290.
However, a recovery above the neckline could weaken the pattern’s bearish implications. Traders would need to monitor whether BNB can establish sustained buying interest rather than relying on a brief rebound.
BNB Technical Indicators Show Weak Momentum Below Key Moving Averages
Daily technical indicators present a mixed picture, with shorter-term signals favoring sellers while the longer-term structure remains comparatively stable.
The Relative Strength Index (RSI) is hovering around 40–41, indicating weak momentum without reaching the conventional oversold threshold of 30. This suggests that selling pressure remains present, although the indicator does not yet confirm an extreme downside condition.
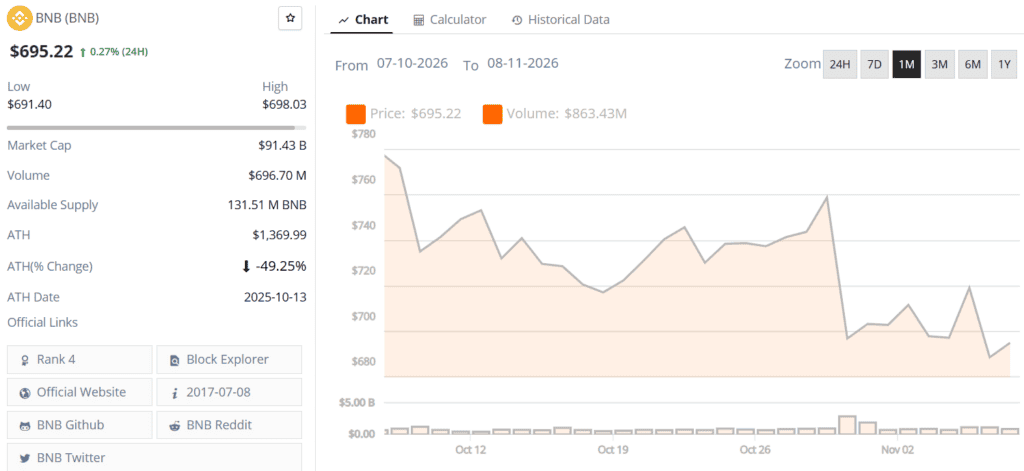
BNB price chart. Source: Brave New Coin
The Moving Average Convergence Divergence (MACD) also remains negative. Its MACD line is positioned around -12.3 to -12.6, below the signal line near -9.6 to -10.1. The negative histogram indicates that bearish momentum has not fully subsided.
Other indicators offer some evidence of short-term stabilization. The Stochastic oscillator has moved into lower territory, while the Commodity Channel Index (CCI), near -100 to -111, indicates that BNB could be approaching levels associated with potential mean reversion.
However, these readings do not independently establish a bullish reversal.
Moving averages provide a clearer picture of the current resistance structure. BNB remains below its 10-day, 20-day, 30-day, and 50-day moving averages, which are clustered between approximately $702 and $746. The 50-day simple moving average near $746 represents a particularly important recovery hurdle.
In contrast, the 200-day simple moving average remains near $657, below the current market price. This indicates that BNB has retained an important element of its longer-term bullish structure despite its recent decline.
For a stronger recovery signal, BNB would need to reclaim the $710–$722 resistance region. A MACD crossover above its signal line and an RSI move above 50 would provide additional evidence that buying momentum is improving.
BNB Price Forecast: $657 Support and $746 Resistance Define the Next Move
The immediate technical structure places BNB between a nearby support cluster and several layers of overhead resistance.
On the downside, the $684–$692 region represents the first area buyers need to defend. A sustained move below this range could expose the 200-day moving average near $657, which remains an important reference point for the broader market structure.
A decisive daily close below $657 would increase the risk of a deeper correction and weaken the longer-term bullish outlook. It could also bring the bearish projections from the Elliott Wave analyses into greater focus.
Further downside levels include $625 from DamonEdge’s Head and Shoulders analysis, followed by $398–$310 in WhaleFactor’s Elliott Wave projection. MarzellCrypto separately identifies $365 and $290 as potential support areas if the macro breakout retest fails.
On the upside, initial resistance sits around $697–$702, followed by the $710–$722 supply zone. A sustained move through these levels could improve the short-term technical outlook and bring the $746 50-day moving average into focus.
Beyond these immediate barriers, the $813 weekly resistance identified by WhaleFactor remains a significant level. A weekly close above it would invalidate the analyst’s current corrective setup and challenge the bearish Elliott Wave interpretation.
For now, BNB’s technical outlook remains neutral to mildly bearish. The token is holding above its 200-day moving average, but weak momentum and resistance from shorter-term averages suggest that buyers have yet to regain control.
The $690 region therefore remains an important area to watch. A successful defense followed by a recovery above $722 could strengthen the bullish retest scenario. Conversely, a breakdown below $657 would increase the risk of further losses, with $625 emerging as an intermediate downside target before the deeper bearish projections come into consideration.
Ultimately, BNB’s next major move will depend on whether buyers can defend the former breakout structure and restore momentum. Until the price reclaims key resistance levels or breaks its longer-term support, both the bullish recovery and bearish correction scenarios remain open.
 Brave New Coin reaches 1M+ engaged crypto enthusiasts a month through our website, podcast, newsletters, and YouTube. Get your brand in front of key decision-makers and early adopters in 2026. Limited slots remaining! Find out more today!