Curve Price Analysis – Stablecoin swaps

![]()
Non-custodial decentralized exchanges (DEXs) have quickly risen to prominence since mid-2020, along with the rise of various other DeFi mechanisms. Curve Finance is unique amongst its peers, filling the stablecoin swaps niche exclusively.
Curve is an Automated Market Maker (AMM) based Decentralized Exchange (DEX) protocol, similar to Uniswap, Sushiswap, and 1inch. Unlike the other DEXs, most of Curves 23 available pools aim to swap between tokens of the same value, such as stablecoins. The Curve DAO token (CRV) is a governance token with the ability to accrue Curve exchange fees based on a time-based staking system.

Source: curve.fi
DEX trading volumes have increased rapidly in recent months. Curve (maroon) saw US$6.3 billion in volume throughout the month of January, its largest month on record. Uniswap (pink) led the pack in January with US$26.2 billion in trading volume. Curve currently holds 9.34% of all DEX trading volume.


Source: Dune Analytics
According to founder Michael Egorov, the Curve Finance protocol prototype first began in October 2019 and was modeled after the NuCypher NU token. The UI was released in December 2019 and officially launched in January 2020. On August 14th, 2020, the CRV token was airdropped to Curve users with a four-year vesting period. The token has a 219 million circulating supply with a 3.3 billion max supply. CRV currently has a market cap of US$673.5 million, placing it 77th on BraveNewCoin’s market cap table, with US$249 million in trading volume over the past 24 hours.

CRV tokens can be staked with a time-locked reward ranging from one to four years. CRV tokens staked for four years receive 1 veCRV while CRV tokens staked for one year receive 0.25 veCRV tokens. veCRV holders receive 50% of the exchange fees while the other 50% of the exchange fees are collected by Liquidity Providers (LPs).
LPs provide their capital for a specific liquidity pool. LPs replace the traditional order books of centralized exchanges. Nearly US$4.0 billion is locked within the Curve protocol in a mixture of assets, including BTC, ETH, and dai. The total value locked into contracts on Curve is 4th, behind the MakerDAO, AAVE, and Compound.

Source: DefiPulse
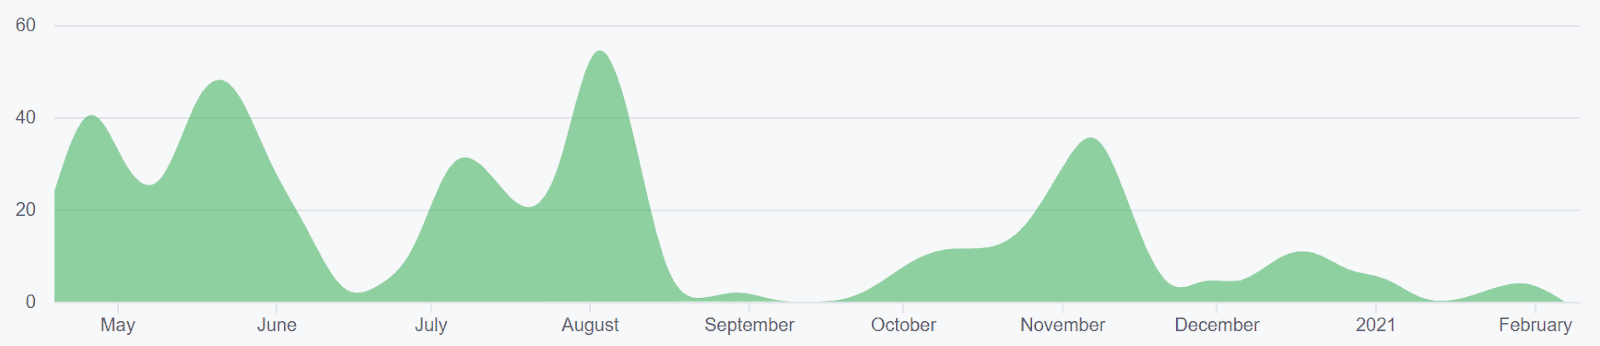
On-chain CRV token stats reveal ranging transaction counts and steadily increasing transaction sizes. Transactions per day hit an all-time high of 23,500 on August 14th, 2020, the day of the initial token distribution. Average transaction sizes hit an all-time high of US$54,000 on February 6th. Since late December, transaction counts have doubled and transaction sizes have increased by 6x.

Source: CoinMetrics
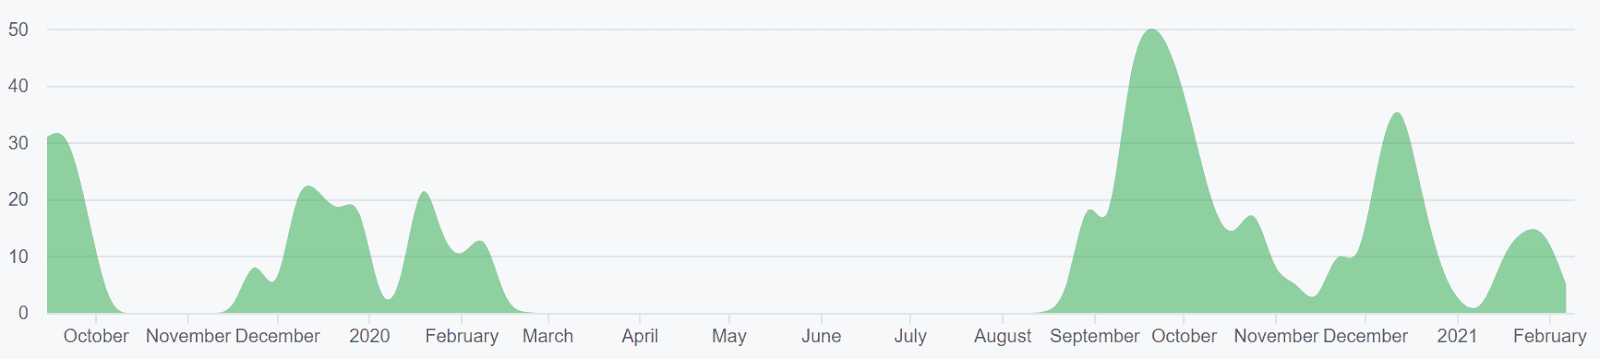
The weekly Kalichkin network value to estimated on-chain daily transactions (NVT) ratio (red line) has ranged from 24 to 177 over the past few months. A clear downtrend in NVT suggests a coin is undervalued based on its economic activity and utility, which should be seen as a bullish price indicator. Weekly active addresses stabilized in October and have slowly increased over the past four months to 1,500.

On the development side, the Curve Finance GitHub account has 20 repos with 10 active developers. Most coins use the developer community of Github where files are saved in folders called "repositories," or "repos," and changes to these files are recorded with "commits," which save a record of what changes were made, when, and by who. Although commits represent quantity and not necessarily quality, a higher number of commits can signify higher dev activity and interest.
Source: GitHub – curvefi/curve-contract
Source: GitHub – curvefi/curve-dao-contracts
Technical Analysis
Roadmaps for future market movements can be found on high timeframes using Exponential Moving Averages, Volume Profile Visible Range, Pivot Points, Ichimoku Cloud, and divergences. Further background information on the technical analysis discussed below can be found here.
CRV has a limited trading history and needs to be analyzed on lower timeframes, as opposed to the daily chart. On the four-hour timeframe, the 50-period Exponential Moving Average (EMA) and 200-period EMA crossed bullish on January 4th, which has resulted in a 390% increase. Upside resistance, based on monthly pivots, sits at US$3.40 and US$4.34.
Price is currently nearly 1.4x from the 200-period EMA and has not touched the 200-period EMA since January 13th. If the horizontal support fails, the next significant support sits at US$2.00 to US$2.17 based on monthly pivots and the 200-period EMA. Additionally, there are no current bearish divergences on volume or RSI to suggest weakening bullish momentum.

Turning to the Ichimoku Cloud, four metrics are used to indicate if a trend exists; the current price in relation to the Cloud, the color of the Cloud (red for bearish, green for bullish), the Tenkan (T) and Kijun (K) cross, and the Lagging Span. The best entry always occurs when most of the signals flip from bearish to bullish, or vice versa.
Cloud metrics on the four-hour timeframe, with doubled settings (20/60/120/30) for more accurate signals, are bullish; the spot price is above the Cloud, the Cloud is bullish, the TK cross is bullish, and the Lagging Span is above the Cloud and below the current spot price. The trend will remain bullish so long as the spot price remains above the Cloud, currently at US$2.85. Kijun support also sits at US$3.00.

On the six-hour CRV/BTC pair, trend metrics are neutral to bullish with price above the 200-period EMA and just above the Cloud. A definitive long entry signal will trigger once the TK lines recross bullish. Downside support based on the 200-period EMA, VPVR, and monthly pivots sit in the 4,500 to 5,900 sat zone. Upside resistance based on monthly pivots sits at the 10,000 sat and 12,000 sat horizontal levels. Additionally, there are no current bearish divergences on volume or RSI to suggest weakening bullish momentum.

Conclusion
Non-custodial decentralized exchanges (DEX) have quickly risen to prominence since mid-2020, along with the rise of various other DeFi mechanisms. Curve Finance is unique amongst its peers, filling the stablecoin swaps niche exclusively. The CRV token was airdropped to early users in August 2020 with a four-year vesting period and has complex time-locked staking payoffs, based on total fees on the accrued by the protocol. Volume, total value locked, and on-chain token stats suggest increasing interest in the Curve protocol and CRV token over the past few months.
Technicals for the CRV/USD pair show a bullish trend with prices over the 33-day EMA and four-hour Cloud. Upside resistance sits at US$3.40 and US$4.34 with significant support at US$3.00 and US$2.00. Technicals for the CRV/BTC pair are neutral to bullish with downside support in 4,500 to 5,900 sat zone and upside resistance at the 10,000 sat and 12,000 sat horizontal levels.
 Brave New Coin reaches 1M+ engaged crypto enthusiasts a month through our website, podcast, newsletters, and YouTube. Get your brand in front of key decision-makers and early adopters in 2026. Limited slots remaining! Find out more today!


