DASH Price Analysis: Inertia reigns

![]()
DASH is one of the blockchain sector's original 'jack-of-all-trades' networks, attracting buyers with good Masternode investment returns, accessible peer-to-peer payment infrastructure, and the ability to make transactions private. Despite this diversity, it has offered little price resistance against 2018's bear market.
DASH, a perennial top-15 digital asset by market cap, has been a longtime driver of blockchain innovations, pushing for both masternode and privacy solutions, and adding to the code of the Bitcoin network it was forked from.
Despite its unique value proposition and large marketing investment, the native token of the network has struggled for price momentum in 2018 and has yet to achieve scale or tangible industry adoption.
Down ~90% (Weighted Price) from an all time high achieved in late December 2017, it currently trades at ~$153, having started the year valued well above $1000.
Value in the Masternode
One contributing factor to DASH maintaining a top-15 position, is its Masternode offering.
For the price of 1000 DASH, a user/computer can become a DASH network masternode and earn added block production rewards by taking a greater role in network mining and governance.
DASH offers a unique block reward system. Unlike Bitcoin where miners earn 100% of the reward for every block created, DASH offers a 45/45/10 reward cascade with miners earning 45%, masternodes earning 45% and 10% going to the DASH treasury
A key transactionary aspect of DASH is its PrivateSend feature. When switched on, PrivateSend is analogous to coin-mixing and involves jumbling multiple identical inputs from users into a single transaction with several outputs. DASH runs this system as a two-tiered structure by implementing Masternodes at the top, acting as facilitators of every PrivateSend transaction and performing all high-level functions on the network.
Network statistics indicate that the Number of DASH masternodes have steadily increased during 2018 (the falling cost of entry in USD terms is likely a major factor in this growth). DASH is by far the largest Masternode network in the ecosystem, both in terms of market cap and value of an individual masternodes, on average ~ USD 150,000. There are currently 4,885 masternodes on the DASH network
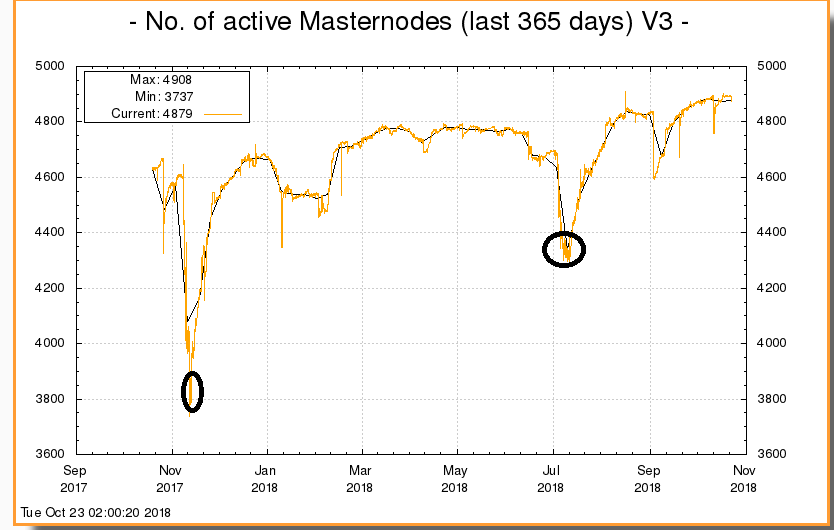
DASH historical masternode, positive speculative price bubbles have generally coincided with Masternode sell-offs. With price currently trending downwards, masternode growth rate is rising with cheaper buy-in now available.
The average return on investment currently stands at 6.87%, or an average USD return of ~$10515 for running a masternode. masternode rewards at these levels, appear to still be attracting DASH masternode participants keen to deepen mining participation at selected price thresholds, and this is likely to be a continued factor in the token’s ability to retain value in the bear market.
Trading pairs and exchanges
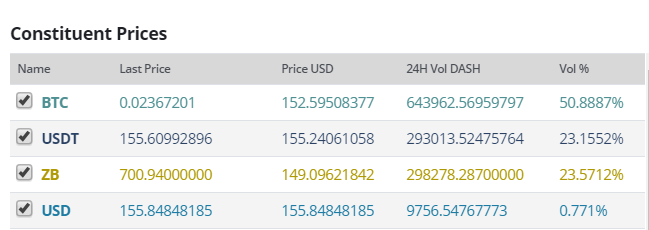
The most popular trading pairs for DASH are currently the generally popular crypto on-ramps, Bitcoin and Tether. Together they make up close to 75% of the daily trading volume of DASH, over $141 million. The third most popular pair is DASH/ZB. The ZB coin is the native token of the zb.com exchange and offers reduced trading fees and regular buybacks for users. The DASH/USD pair is offered by a number of recognizable exchanges including Bitfinex and Kraken.

BTC and USDT pairs populate the top-5 reported exchange volumes for DASH, with China-centric zb.com dominating a large chunk of trading. The DASH/BTC and DASH/USDT pairs on zb.com make up over 50% of overall DASH trading volumes, the exchange offers extremely low rates on USDT pairs. Potential users, however, should be wary of counterparty risk. The exchange, which has been historically popular with traders in Mainland China because of previously available Chinese Yuan trading options, is registered off-shore in Samoa.
Network fundamentals
NVT signal
The NVT signal, a responsive blockchain valuation metric, developed & tested by Willy Woo and Dmitriy Kalichkin was derived from the NVT ratio. With NVT signal, the simplified framework that crypto markets are prone to bubbles of speculative purchasing, not backed up by underlying network performance and activity, and the NVT signal gives off a signal for what stage of the price cycle a token may be in.
A high NVT signal is indicative of a network that is going through one of these bubble periods, and may move towards a position of becoming overbought/overvalued, because of the market’s speculative assessments running out of steam.

Figure 1: DASH historical NVT signal data. (NVT signal = Market Cap/onchain transaction volume, smoothed with 30 day MA, Overbought range >145, Oversold range <5, Mean : 52)
In recent months, however, contrary to general intuition & theory, a rising NVT signal has actually coincided with a falling price level. This is surprising because falling price & rising onchain volume should put downward pressure on NVT signal.
DASH’s rising NVT signal indicates onchain volume has been exiting the network at a faster rate than price has been dropping. This can be a dangerous position for a digital asset to be set in, because if DASH’s NVT signal crosses into historical ‘overbought’ region, then the capability of ‘speculative’ factors to drive upward price momentum, becomes tight and marginal.
Additionally if NVT signal keeps rising without a check of rising onchain volume, then an inflection is likely to eventually be hit, and this will bring further downward pressure on price.
A number of factors may be driving DASH’s exodus of onchain volume alongside price.
Within the payment cryptographic space, Bitcoin has maintained a ‘best bet in a dangerous market’ appeal, because of its size & network effects, supported infrastructure (Bitpay, Lightning network) and institutional participation from recognizable entities like Fidelity. This has meant Bitcoin alternatives like DASH, have not just lost the interest of traders and speculators but also onchain participants who have begun to migrate off the altcoin networks.
WIthin the privacy token space, the Monero network has recently impressed with the new Bulletproof updates that have driven down transaction costs and transaction times, further eating into DASH’s relevance as payment & privacy solution within the ecosystem.
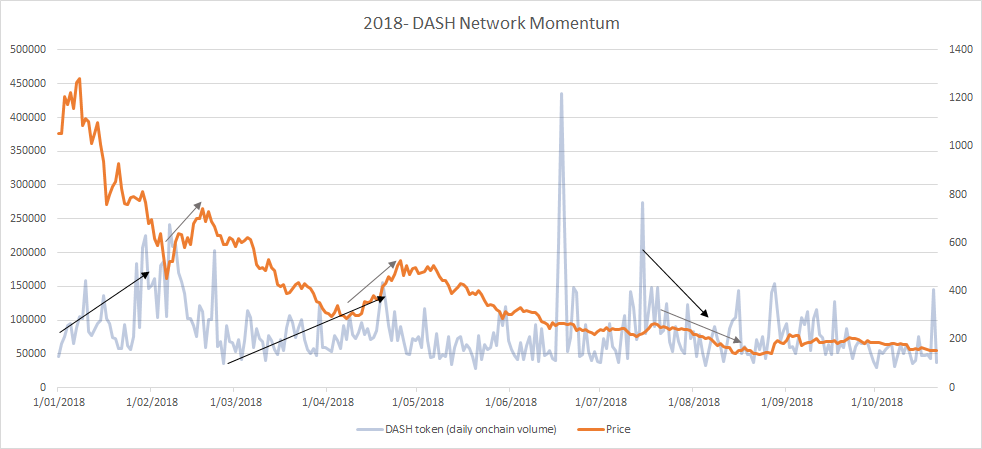
Figure 2: DASH network momentum 2018
Network momentum is a Blockchain indicator metric conceived by analyst Positivecrypto. Indicated by the faded grey line in figure 3, it assesses onchain volume as an indicator for future price movements. Where it differentiates from NVT signal is that the daily volume of token transactions, rather than USD value of onchain transaction volume, is used for assessments.
The simple intuitive idea is that a rising rate of onchain volume (in token terms not USD terms) is a signal for growing ‘momentum’ within the network, and vice versa for falling onchain volume in token terms.
For a network like DASH, periods of increased token momentum driven by factors such as increased usage as a payment tool, or improved Masternode rewards, are fundamentals that feed back into price — eventually driving it forward.
Although external factors not accounted for, make the metric at times appear unresponsive. Potential patterns have been indicated with grey and black arrows on figure 2.
Unlike NVT signal patterns, or onchain volume in USD terms, network activity in the DASH token appears to be relatively stable across 2018. For the most part keeping a tight range around 50000-150000 DASH.
This means that the DASH network has retained consistency across 2018 despite falling token value, indicating a number of network users have likely retained the perspective that ‘one DASH is always worth one DASH’.
Present network momentum appears to be trending marginally downwards or middling. This indicates, that at least in the short run, DASH is lacking the forward onchain ‘momentum’ that may fuel a positive price run.
Price to Metcalfe Ratio
Metcalfe’s law is a measure of connections in a network, as established by Robert Metcalfe the founder of Ethernet. It has subsequently been used to analyze the true value of network-based financial products like Facebook and Bitcoin, and by comparing it to price, can provide a useful tool to assess whether a token is over or undervalued.
It is also a more straightforward metric to implement versus onchain transaction volume, which can be challenging to measure accurately in USD terms. Active addresses are measured as the number of unique sending and receiving addresses conducting transactions on the given day.
This makes it a relatively transparent metric as compared to onchain volume. However, there may be a question of the granularity of the data, and who controls these addresses, whether say it is controlled by masternodes.
The Kalichkin PMR methodology is used because of its responsiveness and smooth indication.
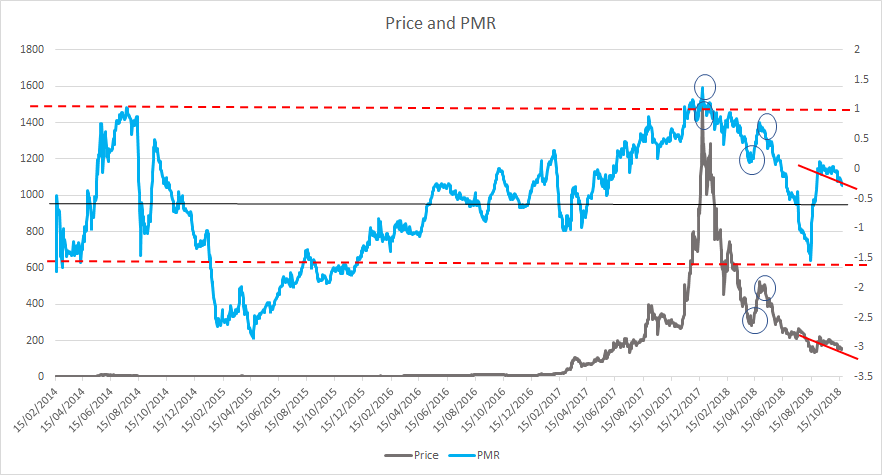
**(Fig 3. DASH Kalichkin’s PMR or Price to Metcalfe, Natural log of Token value/Metcalfe Ratio. Meltcalfe Ratio = Active Addresses Squared, Overbought >0.99, Oversold<-1.55, Mean : -0.66) **
Historically, the PMR for DASH has appeared to move very closely with price.
An inflection point for PMR being hit, with a subsequent sharp upward or downward movement, has generally coincided with very similar price movements in the same direction.
However, for an extended period, post August 2018, despite PMR surging, DASH token price improvements were marginal. This indicated that falling active addresses were a larger factor for rising PMR, rather than increasing token value driven by positive speculation, that one would generally observe when PMR rises quickly.
The falling rate of active addresses may have been tied to factors such as bearish sentiment surrounding the ability of the network to ever deliver viable payment solutions, causing members of the DASH community to lose faith in the network and shift elsewhere.
PMR however appears to have leveled off/ move downwards in the last month (since 02/09/2018 PMR has fallen by 0.4 log points). While this indicates a lack of ongoing speculative price momentum within DASH, PMR moving more closely alongside price/token value than it did in previous months, may be observed as a positive fundamental indicator
This recent pattern means active addresses have ‘caught up’ with token value. If PMR keeps moving downwards driven by negative speculation this may fuel a run towards an ‘oversold’ inflection point, roughly measured, based on historical patterns, by the lower red dotted line on figure 3. Meaning DASH may beginning an approach towards a price reversal driven by active address momentum pushing back against negative speculation.
DASH has long been renowned for a faithful legion of long term believers, with active Twitter & Reddit groups continuing to show strong long term faith in the network. The project is also known for a strong internal marketing force, that consistently provides news updates to the community and creates content like weekly podcasts.
This in mind, there is a chance that active address growth may be the fundamental lifeline that provides fuel for a price reversal from the ongoing bear trend.
Technical analysis
Long Term Trends
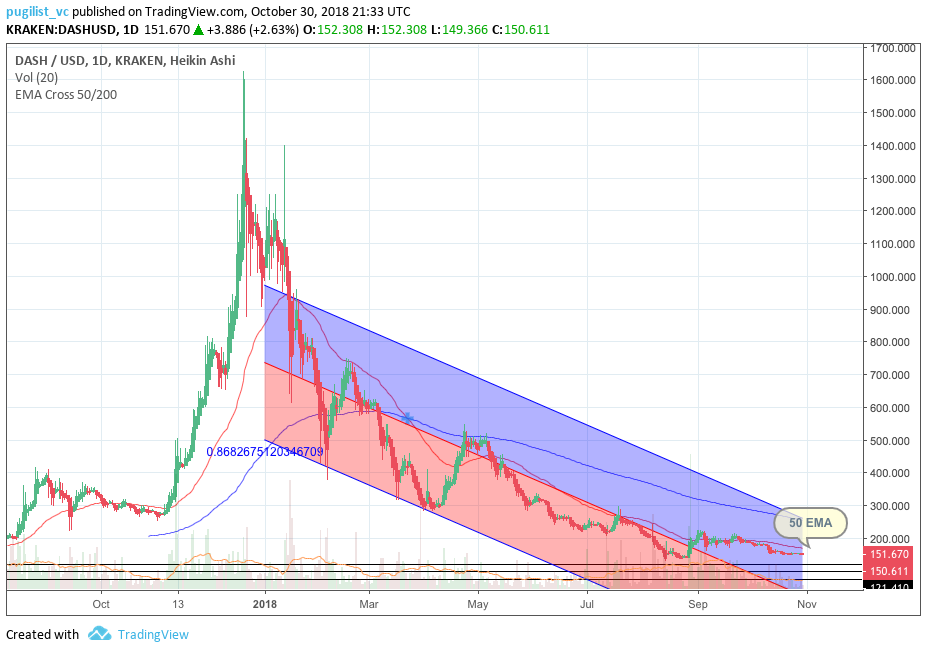
In 2018, the price of DASH has been hit particularly hard visualized by its negative linear price trend with a Pearson R correlation coefficient between time and price of 0.86, on the 1 day chart. Additionally, the death cross has persisted since late March, and the 50 day EMA (red line) is currently acting as price resistance. DASH is currently sitting at ~$153 and appears to be basing out above the average trend path.
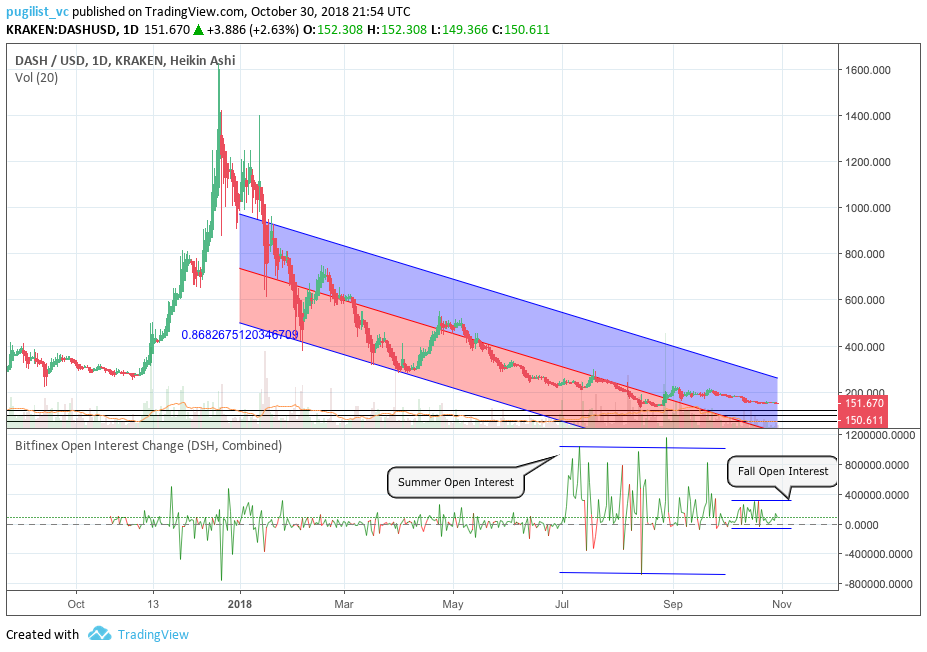
Sentiment towards DASH spiked during the summertime with open interest increasing drastically, and primarily from the long side. However, since mid-September, as volatility has dampened, so has open interest. These patterns may indicate that buyers are awaiting an indication of upward buying pressure before they re-enter the market, i.e. hoping that a bottom has formed after dropping over 85% year to date.
As mentioned prior, price volatility for DASH has been diminishing since mid-September, visualized by the compressing bollinger bands and historically low historical volatility (blue line).
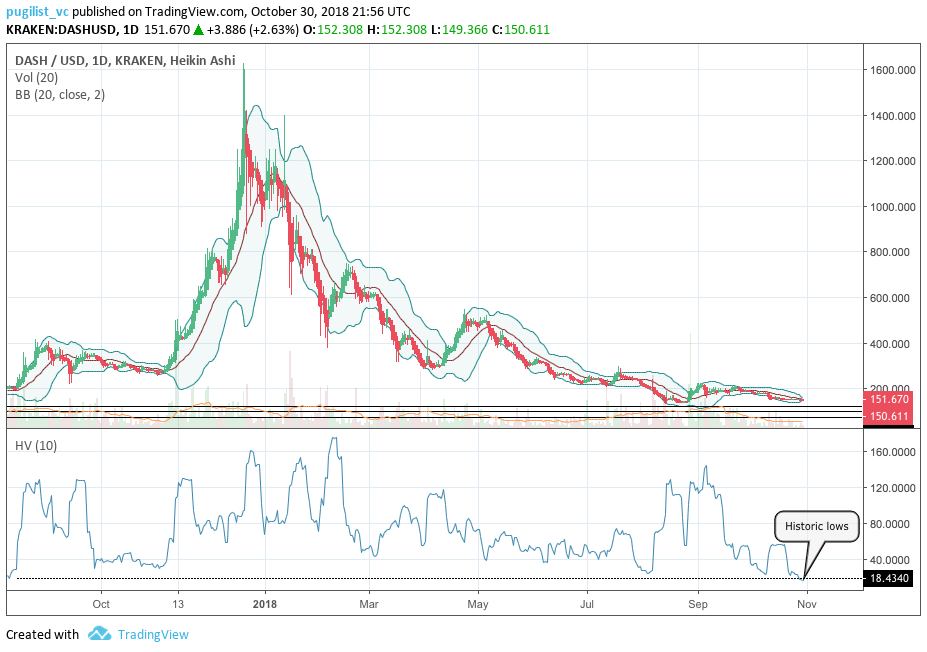
Compression typically precedes a price breakout in one direction. Currently, price is confined within a trading range between $145 and $180. Given the high market dependence on bitcoin (BTC), coupled with the 0.83 correlation between BTC (red line) and DASH (blue line) in 2018, the success of a positive breakout, largely hinges upon the price movement of BTC over the coming weeks, probabilistically speaking.

- onchainfx.com
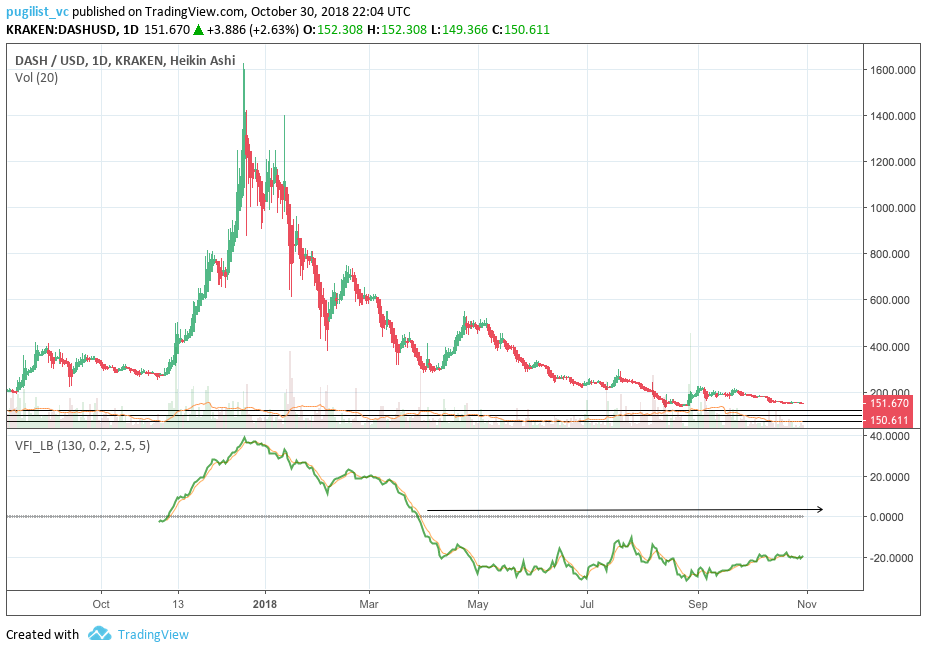
Lastly, the volume flow indicator (VFI) fell below 0 in early April 2018 and has never recovered; nor has it even come close. The VFI interpretation is: a value above 0 is bullish and below 0 is bearish, with divergences between price and oscillator being high probability signals.
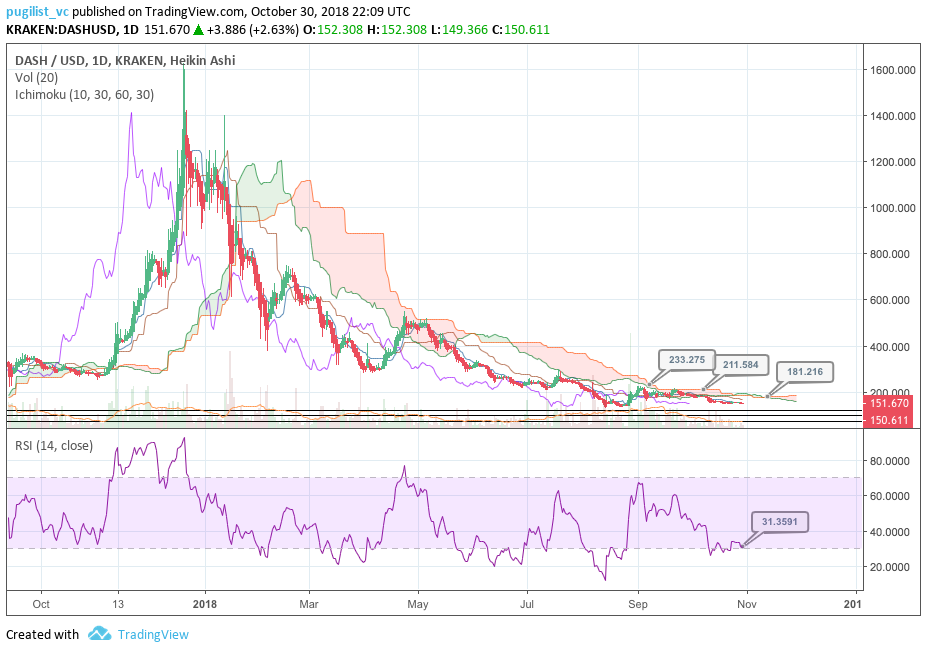
Ichimoku Clouds with Relative Strength Index (RSI)
The Ichimoku Cloud uses four metrics to determine if a trend exists; the current price in relation to the Cloud, the color of the Cloud (red for bearish, green for bullish), the Tenkan (T) and Kijun (K) cross, Lagging Span (Chikou), and Senkou Span (A & B).
The status of the current Cloud metrics on the 1 day time frame with singled settings (10/30/60/30) for quicker signals is bearish; price is below the Cloud, Cloud is bearish, the TK cross is bearish, and the Lagging Span is below the Cloud and price.
A traditional long entry would occur with a price break above the Cloud, known as a Kumo breakout, with price holding above the Cloud. From there, the trader would use either the Tenkan, Kijun, or Senkou A as their trailing stop.
DASH is currently sitting at $152 with its RSI in oversold territory (31), which may present a short term boost to price to re-attempt a Kumo breakout. Given the compressed volatility and historical patterns, a successful Kumo breakout is probabilistically low; even if a positive price breakout occurs. The support levels for price are $140, $120, and $100; while price targets for a successful Kumo breakout (breaking above $181) are $211 and $233.
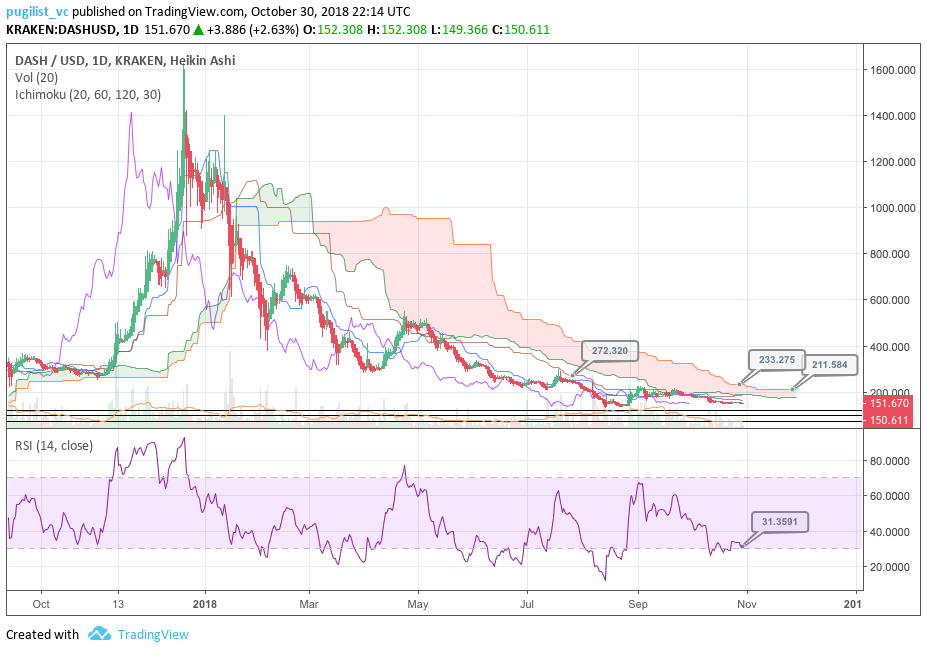
The status of the current Cloud metrics on the 1 day time frame with doubled settings (20/60/120/30) for more accurate signals is bearish; price is below the Cloud, Cloud is bearish, the TK cross is bearish, and the Lagging Span is below the Cloud and price.
As mentioned, DASH is currently sitting at $152 and potentially setting up for a Kumo breakout attempt. Using the slower Ichimoku settings, the probability for Kumo breakout success is even lower than the faster settings. In the unlikely event of a successful Kumo breakout, price will need to breach $211 with price targets of $233 and $272.
Conclusion
DASH has been one of the blockchain sector’s most enduring and recognized projects.
Its unique approach to Masternode settlement and privacy payment solutions has made it a perennial top-15 digital asset, allowed it to build one of the strongest community relationships in crypto and helped set up impressive infrastructure like DASH evolution, a light wallet that provides payment merchant and consumer ready POS solutions.
Despite this, the network performance has stagnated in 2018, and fundamentals indicate diminishing network activity, suggesting that DASH’s downward price movements goes beyond just general negative sentiment in crypto markets.
The continued and growing popularity of competitors like the Bitcoin and Monero blockchains is a concern, however, DASH retains underlying support because of the appealing offering for users to become Masternodes.
The technicals for DASH in 2018 have been strongly bearish, but may be in store for a brief reprieve given lightening volatility and oversold RSI. Both, the prudent short term trader (10/30/60/30) and longer term trader (20/60/120/30), on the 1 day chart, will await a positive TK cross and Kumo breakout above $181 and $211, respectively, before entering a long position. Both trader’s support levels are $140, $120, and $100. Additionally, the (10/30/60/30) trader’s price targets are $211 and $233, and the (20/60/120/30) price targets are $233 and $272.
 Brave New Coin reaches 1M+ engaged crypto enthusiasts a month through our website, podcast, newsletters, and YouTube. Get your brand in front of key decision-makers and early adopters in 2026. Limited slots remaining! Find out more today!


