Ethereum Price Analysis – Bullish leanings

![]()
With the Constantinople hardfork imminent, Ethereum technicals are trending more bullish by the day — but price remains in a high resistance zone
Ethereum (ETH) is a decentralized computing platform with smart contract capabilities whose mainnet went live in 2015. The crypto asset is currently 2nd on Brave New Coin’s market cap table, at US$14.25 billion, with US$2.15 billion traded in the past 24 hours. Ethereum’s spot price is down 91% from the all time high set in January 2018.
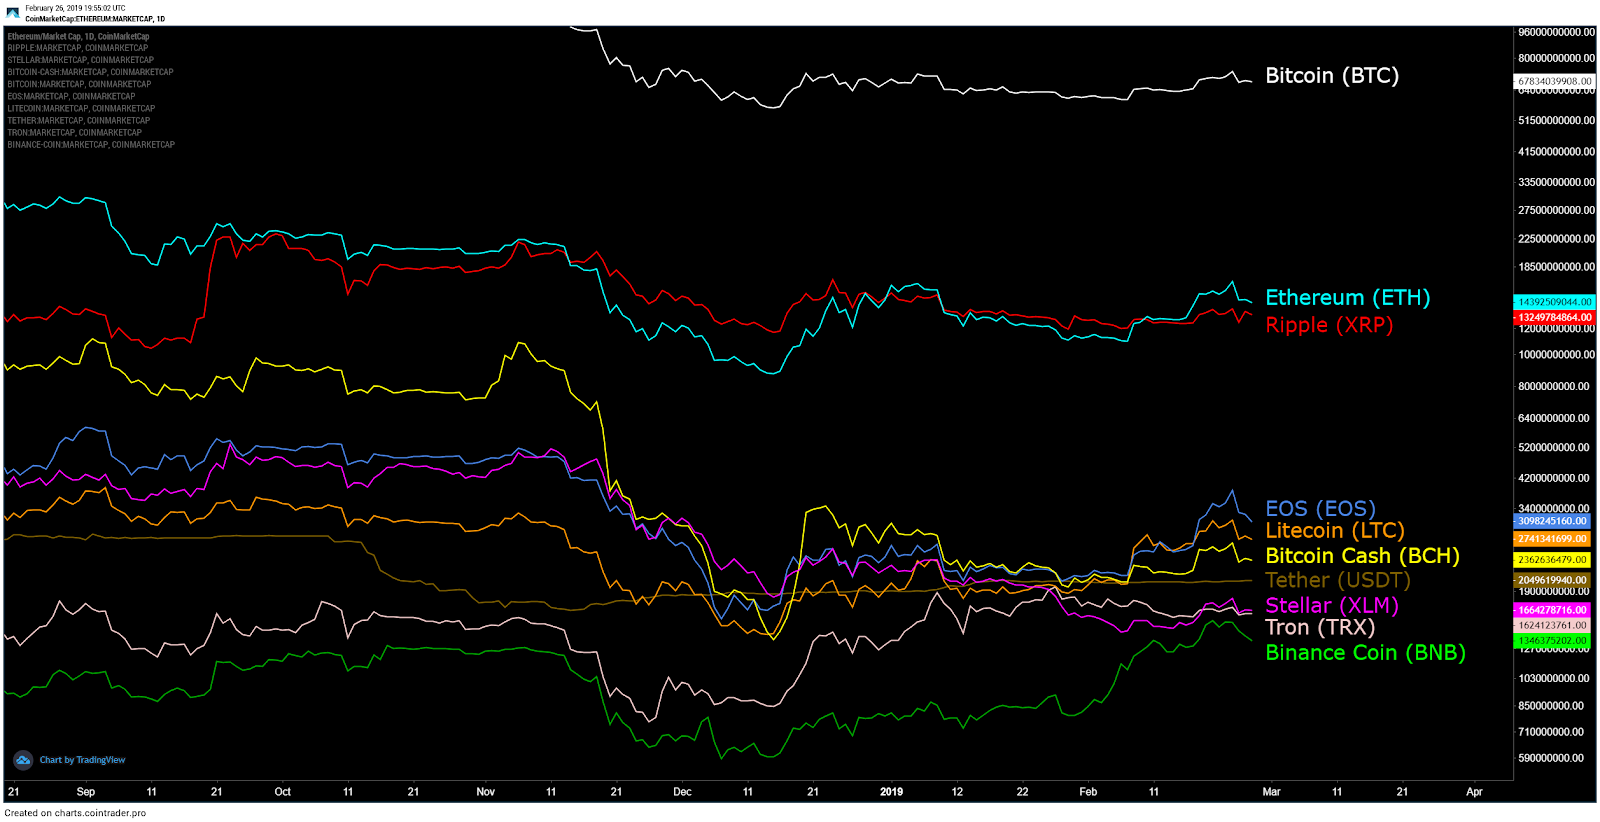
Since the beginning of February, ETH has essentially moved in line with the other 10 top coins by market cap and has outperformed Bitcoin (BTC), Ripple (XRP), Stellar (XLM), and Tron (TRX) .
The Constantinople hard fork (HF), originally slated for January 16th, is set to active imminently. The HF was delayed after a blockchain audit by Chain Security found a vulnerability in one of the Ethereum Improvement Proposals (EIPs). The exploit, which has since been patched, would have allowed for re-entry attacks to drain funds from a wallet. The bug was similar to the catastrophic failure in the DAO during June 2016, an event which led to a split of Ethereum and the creation of Ethereum Classic (ETC).
The HF will include five EIPs total; lower gas fees for smart contracts (EIP 1283), improved scaling for off-chain transactions (EIP 1014), improved smart contract execution (EIP 145 & EIP 1052), a "Difficulty Bomb" delay for 12 months (EIP 1234), and reduced mining rewards from 3 ETH to 2 ETH per block (EIP 1234).
Since the HF was not implemented, the difficulty bomb delay was also never applied, and difficulty has been rising in a stepwise fashion since the original HF date (dashed line, chart below). On February 28th, difficulty will be reset to January 16th levels. Hash rate (solid line, chart below) has continued to decline since January, with mining profitability near all-time lows. As ETH price has risen slightly over the past few weeks, so has hash rate. However, mining profitability remains near all-time lows.
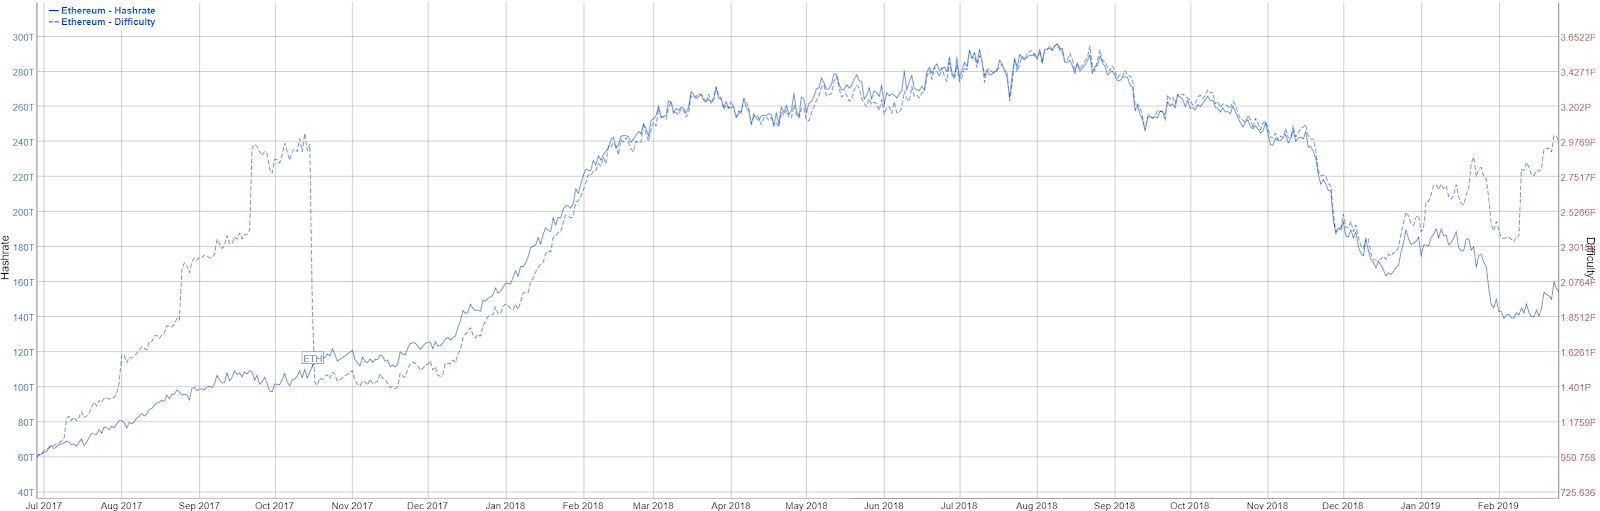
Source: bitinfocharts.com
Block times have also been increasing, and are currently at 20.2 seconds (not shown). This metric will decrease to levels prior to January 16th after the HF. The block count per day (line, chart below) is currently the lowest since July 2017 with inflation per day (fill, chart below) at the lowest levels ever recorded. Inflation per annum is currently 4.65% and will sit at ~4.78% after the Constantinople HF.
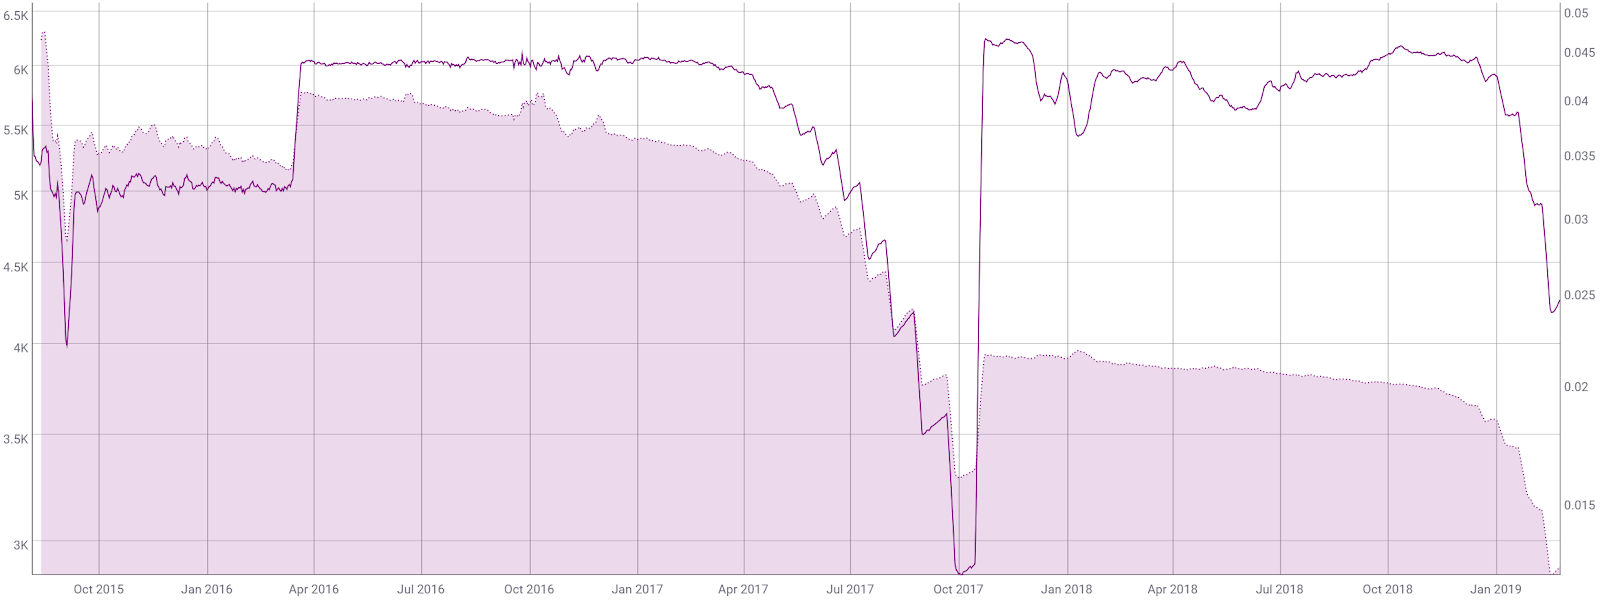
Source: coinmetrics.io
There has also been continuing talk of ETH 2.0 development, which will include a full rewrite and redesign of ETH 1.0. However, both ETH 1.0 and ETH 2.0 will likely exist concurrently for several years before a complete migration to ETH 2.0.
ETH 2.0 includes Casper and Sharding, which will drastically alter the ETH network and include a consensus algorithm shift from solely Proof of Work (PoW) to solely Proof of Stake (PoS). Sharding refers to a scaling solution for horizontally partitioning data within a database. The full implementation of Casper, slated for release in 2022, will remove PoW altogether, leaving a PoS block reward at 0.22 ETH/block for stakers. Currently, there are no plans to cap the total amount of ETH created.
Last month, Vlad Zamfir, one of the chief architects of Casper’s PoS solution, revealed he was negotiating a research agreement with CasperLabs. Zamfir clarified that his "number one priority is obviously my work on ETH" and him "leaving ETH was never on the table".
Additionally, there has also been an ongoing discussion around changing the ETH PoW consensus algorithm to "ProgPoW" (EIP-1057) in a separate hard fork, before Casper goes live and PoS is implemented. ProgPoW would be an attempt to reduce the use of ASIC mining by making GPU mining more efficient. Innosilicon and Bitmain currently each have three ASIC miners available for ETH. A third mining company, Linzhi, is also in the research and development phase of a new ETH mining chip.
The ETH network currently has 7,550 network nodes, down from over 8,000 nodes last month. Of the current nodes, 33% are located in the United States. Many of these nodes are run by Infura, which provides access to the network for developers, due to the somewhat cumbersome hardware requirements of running a node. ETH nodes have several sync modes, with fast sync ~130GB of storage and full GETH archival node exceeding 2TB of required storage. Node services like Infura have become increasingly important for ETH as the blockchain continues to grow.
The number of transactions per day on the network (line, chart below) has increased to ~530,000 over the past two weeks, up from a yearly low of 430,000. Transactions per day will likely continue rise after the Constantinople hard fork as smart contract fees are set to decrease. The average transaction value per day (fill, chart below) is currently around US$800 and is sharply down from a high of US$20,000 in June 2017. Pending transactions are currently holding at 34,000, with the average transaction fee near May 2017 levels at US$0.28 (not shown).
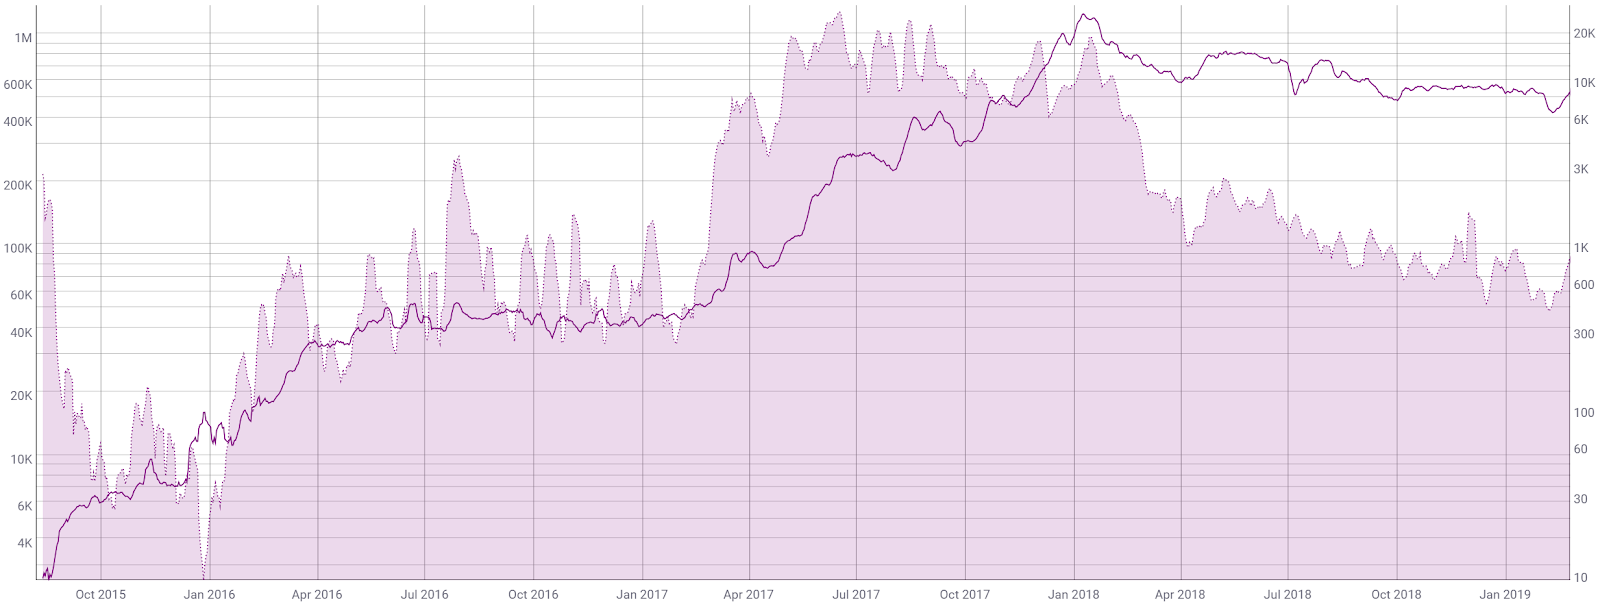
Source: coinmetrics.io
The 30-day Kalichkin network value to estimated on-chain daily transactions (NVT) ratio (line, chart below) has oscillated between 25 and 30 since December last year. Inflection points in NVT can be leading indicators of a reversal in an asset’s value. A clear uptrend in NVT suggests a coin is overvalued based on its economic activity and utility, which should be seen as a bearish price indicator, whereas a downtrend in NVT suggests the opposite. An NVT holding below 20 would likely signify bullish market conditions, as was the case from April 2017 to May 2018.
Active and unique addresses are important to consider when determining the fundamental value of the network when using Metcalfe’s law. Daily active addresses (DAA) have declined (fill, chart below) since January 2018 to a new yearly low over the past few weeks. However, DAA remain well above levels seen throughout most of 2017. Unique ETH addresses continue to grow at a rapid rate, and are currently at over 57 million (not shown). While addresses can never be deleted, this metric indicates a growing use of the Ethereum blockchain.
Furthermore, there are over 500 ETH-related job postings on LinkedIn, down from 1,000 postings in July 2018 but up from 350 earlier this year. There are almost 1.2 million members in 3,763 ETH groups on meetup.com and over 330,000 subscribers on Reddit’s /r/Ethereum.
Source: coinmetrics.io
ICO fundraising declined significantly towards the end of 2018 and the beginning of 2019. However, 2018 saw both the highest number of ICOs, 1,075, and the largest USD sum raised in one year, US$21.48 billion. Thus far in 2019, there have been 25 ICOs raising a total of nearly US$294.5 million. In contrast, the total USD raise January 2018 was US$2.15 billion.
ICOs are also increasingly moving away from public sales, which is likely due to fear of regulatory reproach. Britain’s Financial Conducts Authority (FCA) recently released a 46 page guidance report for crypto assets in an effort to clarify regulations. The Monetary Authority of Singapore (MAS) released similar guidelines in November 2018. Japan’s Financial Services Agency (FSA) will also be releasing guidelines this year. Switzerland and Liechtenstein continue to be among the most welcoming of crypto companies with expected changes to six laws in 2019 to increase blockchain and crypto regulatory certainty.
In December 2018, the United States Congress introduced the "Token Taxonomy Act," a bipartisan bill which aims to amend the Securities Act of 1933 and the Securities Exchange Act of 1934 to exclude "digital tokens from the definition of a security." This is a partial diversion from a comment last year by SEC chief Jay Clayton who said, "we are not going to do any violence to the traditional definition of security that has worked for a long time." In a speech earlier this year, SEC commissioner Hester Peirce noted that "supplemental guidance" is coming soon to help projects determine "whether their crypto-fundraising efforts fall under the securities laws."

Source: coinschedule.com
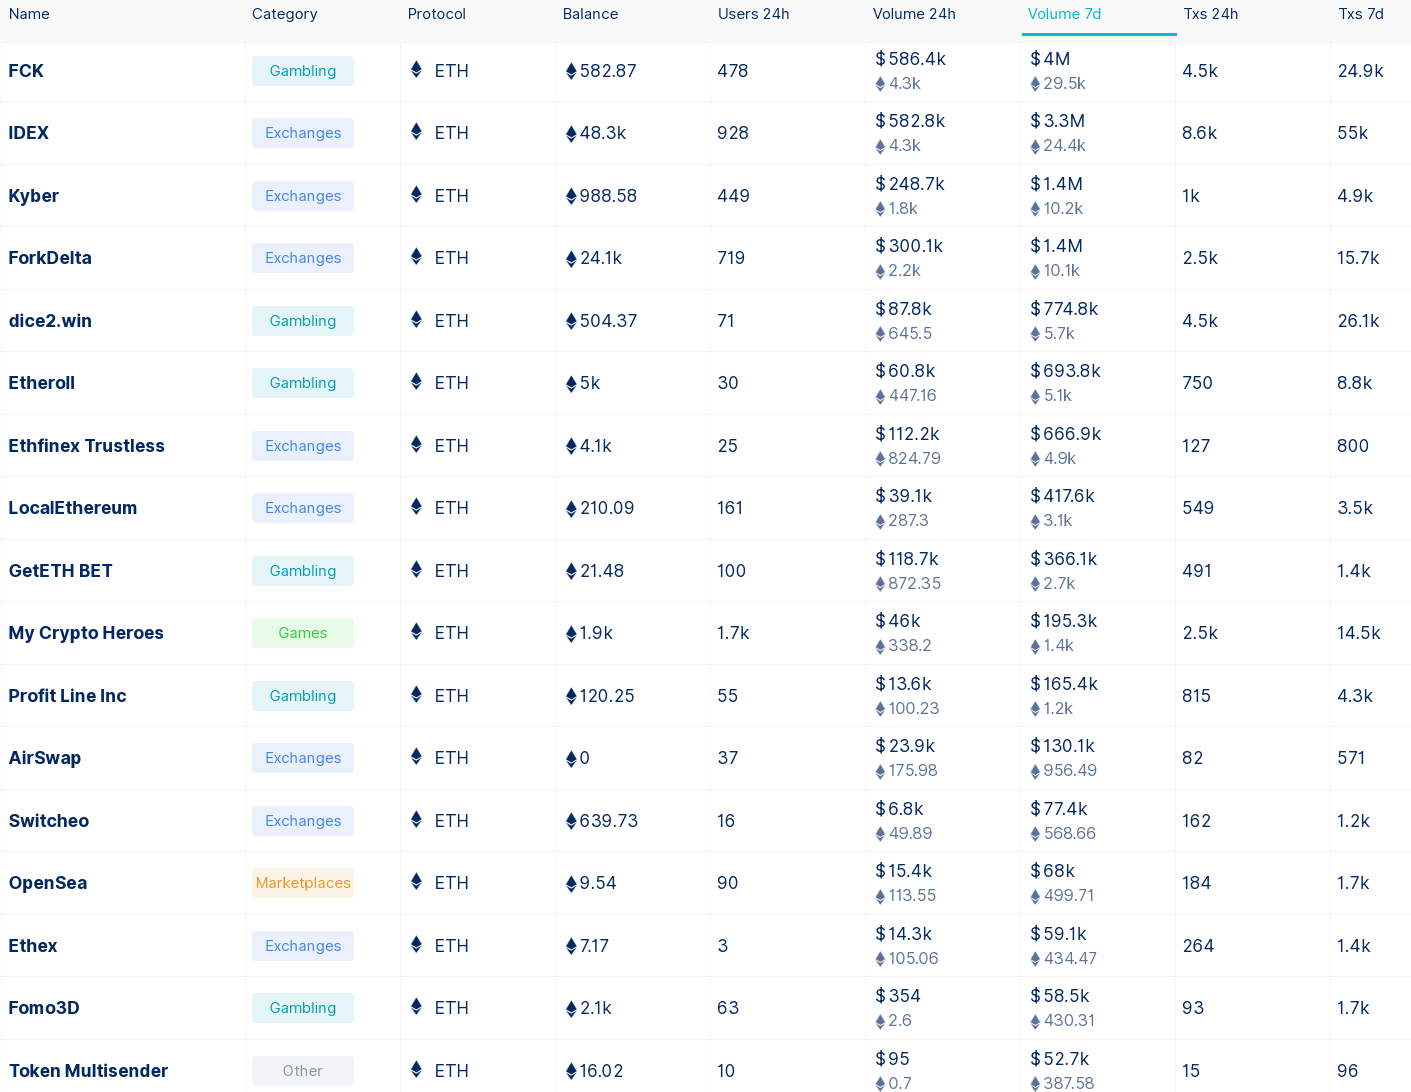
The top Ethereum based Dapps over the past week, ranked by volume, continue to be led by gambling and exchange Dapps. In the game category, MyCryptoHereos, an HTML5 RPG, has dethroned CryptoKitties as the game Dapp with the most users and volume. Overall, ETH has a considerably lower number of users and transactions compared to other Dapp platforms like EOS (EOS) and Tronix (TRX), both of which have no transaction fees. On February 9th, Twitter user Kevin Rooke pointed out that of the 1,375 ETH Dapps, 86% had zero users and 93% had zero transaction volume.
Source: dappradar.com
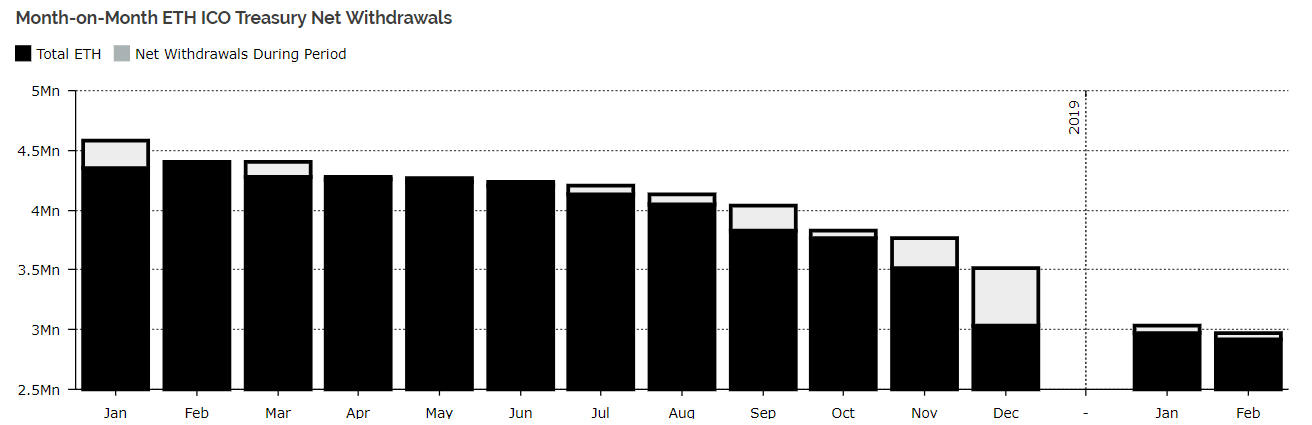
ICO treasury balances also shrank significantly throughout 2018, both in USD value and in ETH quantity. December saw the largest outflows of the year at ~484,000 ETH. ICOs and Dapps continue to hold 2.914 million ETH, or 2.77% of the circulating ETH supply. The MakerDAO alone also holds 2.00% of the circulating ETH supply.
In early December, the Kyber Network, a decentralized token swap platform, saw outflows totaling 50,000 ETH, one of the largest of the year. DigixDAO, a project which has attempted to tokenize gold deposits, continues to hold 395,430 ETH, which is valued higher than the market cap of the entire DigixDAO project token. The frozen Polkadot wallet holds 306,000 ETH, or third highest among all projects. On November 27th, the Aragon Project took a novel approach by moving 40,000 ETH into a US$1 million DAI loan, a stablecoin, to protect against market volatility.
Source: diar.co/ethereum-ico-treasury-balances/
Turning to developer activity, almost 1,000 developers have contributed a cumulative ~28,000 commits to the ETH project on 197 GitHub repos over the past year. Most coins use this development platform, where files are saved in folders called "repositories," or "repos," and changes to these files are recorded with "commits," which save a record of what changes were made, when, and by who. Although commits represent quantity and not necessarily quality, a higher number of commits can signify higher dev activity and interest.
Most of these commits occured in the Solidity repo (top chart). Solidity is the programming language used to write smart contracts on Ethereum. The ETH 2.0 repo has also become active over the past few months (bottom chart), with most of the commits coming from devs Danny Ryan and Vitalik Buterin. Overall, over the past year, ETH related repos have had more commits than any other crypto project.

Source: https://github.com/ethereum/solidity/graphs/contributors
Source: https://github.com/ethereum/eth2.0-specs/graphs/contributors
In the markets, ETH exchange traded volume over the past 24 hours has predominantly been led by the Tether (USDT), Bitcoin (BTC), and U.S. Dollar (USD) pairs. Non-USDT stablecoin volume has slowly increased over the past few weeks, including Dia (DAI), Paxos-Standard (PAX), Gemini-dollar (GUSD), and TrueUSD (TUSD), but continues to remain a fraction of total traded volume. The majority of trading has occurred on Bibox, OEX, and OKEx.
In Asia, the Korean Won (KRW), Yen (JPY), and Yuan (CNY) pairs have USD prices for ETH at US$135, US$136, and US$151 respectively. Together, all three regions show relatively low interest in their fiat pairs, with ~2.2% of the total traded volume combined.

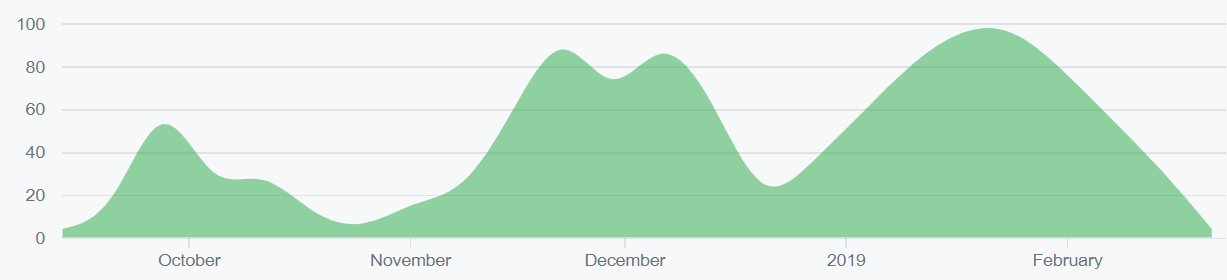
The over the counter (OTC) exchange LocalEthereum facilitated 3,500ETH in transaction volume last week, which is up significantly when compared to most of 2018. In comparison, LocalBitcoins exchanged over 13,000BTC last week according to coin.dance.
Throughout 2018, ETH traders on the exchange decreased while volumes increased. The two spikes in volume on November 25th and December 7th correspond with local lows in ETH price. While traditional OTC desks often require a minimum order of between US$100,000 and US$250,000, these peer-to-peer marketplaces have no minimum order size.

Source: https://dappradar.com/app/148/localethereum
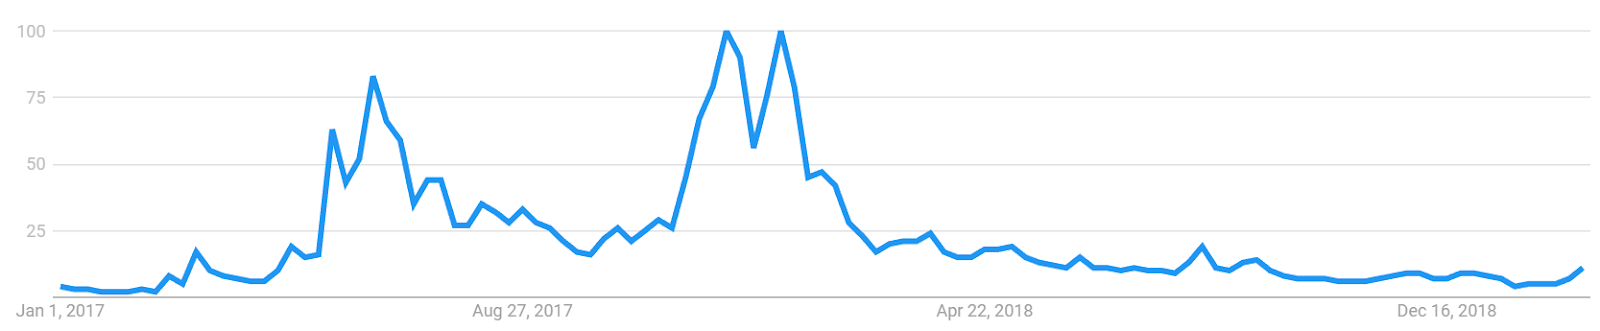
Google Trends data for the term "Ethereum" remained down sharply throughout 2018 and into early 2019 with a slight increase over the past few weeks. This is likely related to Google searches and media regarding the delayed HF. A slow rise in searches for "Ethereum" preceded both highs in June 2017 and January 2018, likely signaling interest from new market participants at that time. A 2015 study found a strong correlation between the Google Trends data and BTC price, while a May 2017 study concluded that when the U.S. Google "bitcoin" searches increased dramatically, BTC price dropped.
Technical analysis
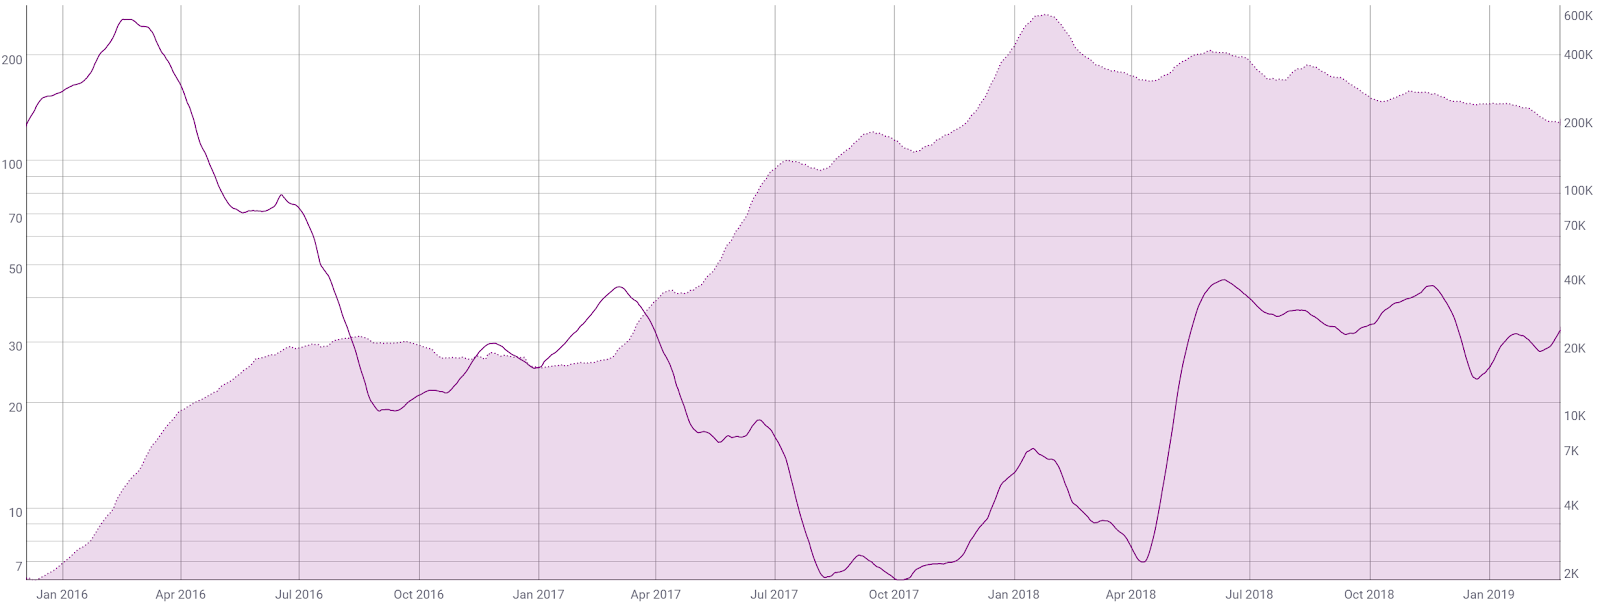
Ethereum has had significant gains over the past week with a swift and steep decline over the past few days. This likely indicates a need for consolidation before further price action. As price approaches key resistance levels, price roadmaps can be found on high timeframes using exponential moving averages (EMAs), Chart Patterns, and Ichimoku Cloud. Further background information on the technical analysis discussed below can be found here.
Based on key support and resistance zones, ETH is unlikely to again break the US$380 level without a considerable amount of consolidation. If the local low at ~US$80 does not hold, then the next zone of supports sits at the previous consolidation level of US$50. This zone also represents psychological support, as does the US$100 level.
However, an Adam and Eve double bottom, a bullish reversal pattern, has completed and reversed strongly at horizontal resistance. The hallmarks of the pattern include a V and U-shaped price action which increased in volume once resistance is broken. The 1.618 fib extension and measured move yield price targets of US$210 and US$250 respectively.
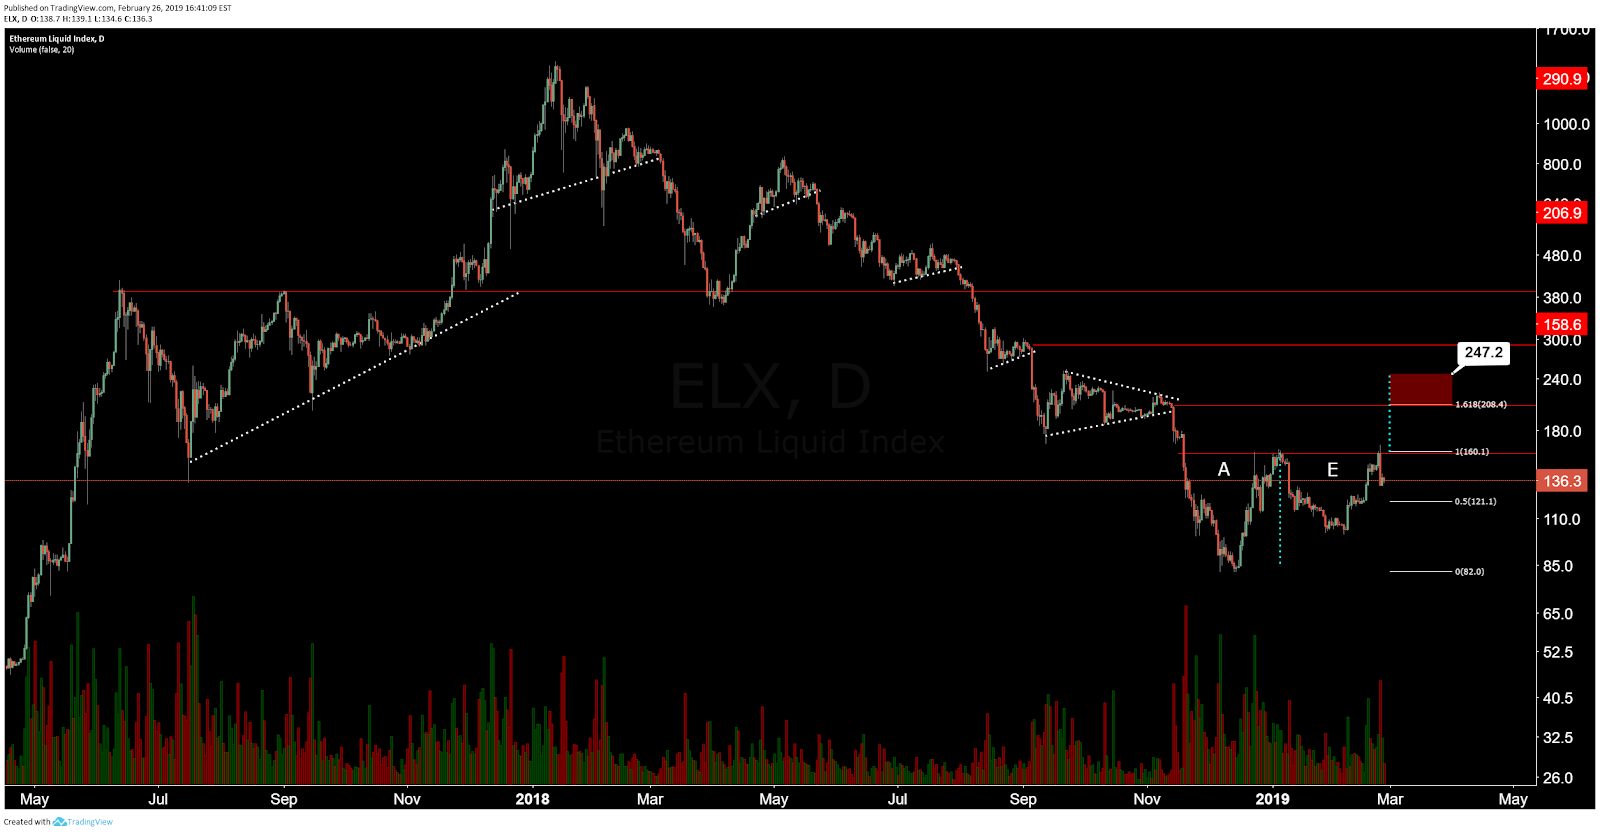
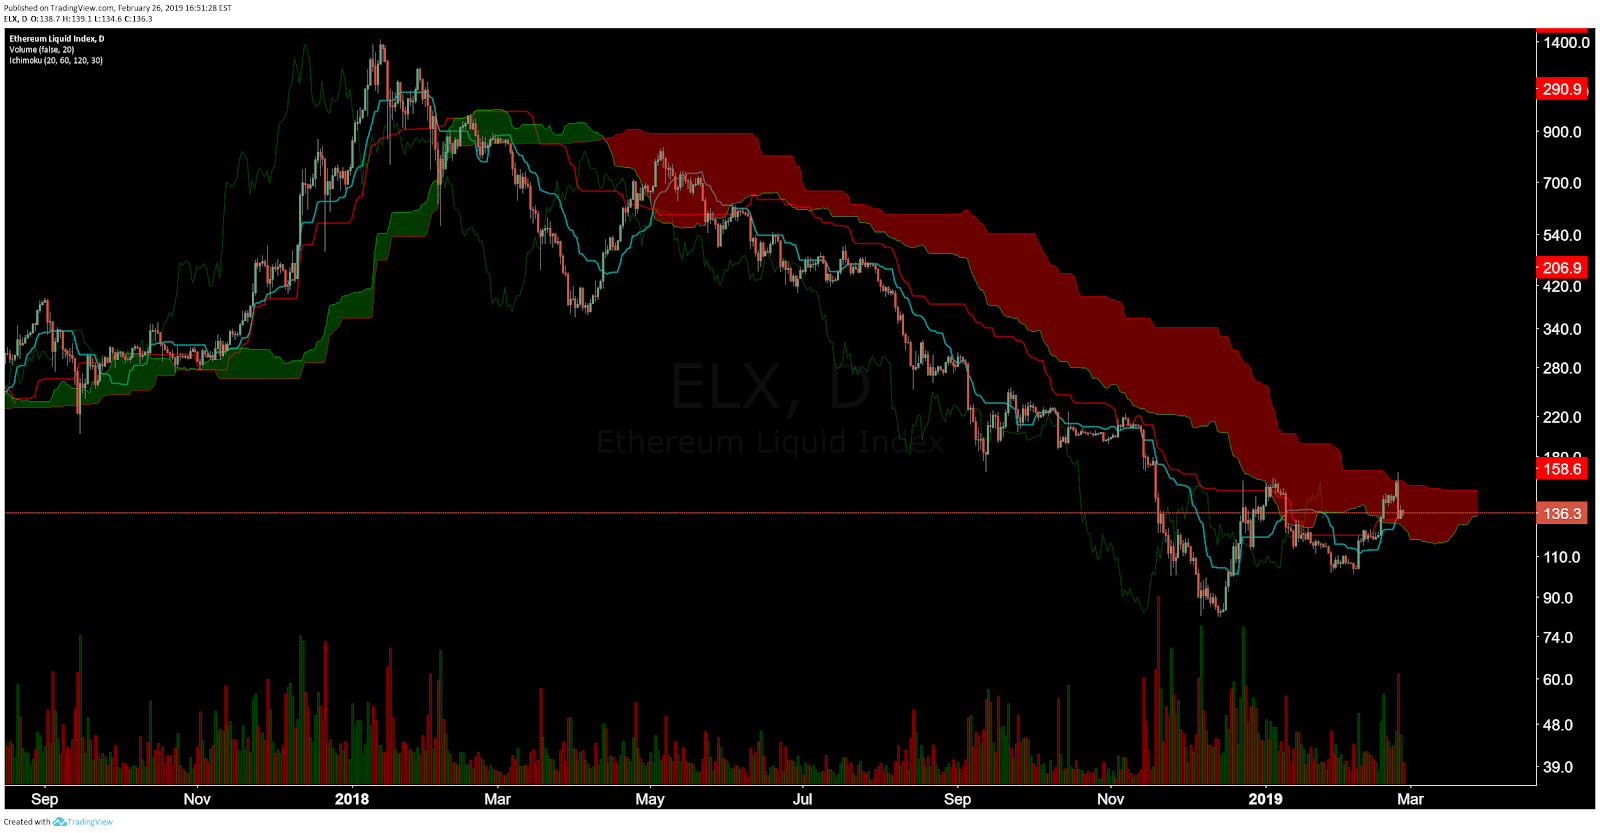
On the daily chart, the 50/200EMA bearish Death Cross occured on June 2018. The previous bullish Golden Cross in May 2018 was overshadowed by a bearish reversal pattern, the head and shoulders. Although the EMA cross is currently bearish, the 200EMA will act as a mean reversion level for price, currently at US$206. This resistance zone also matches the Adam and Eve chart pattern target and a previous increase in volume (horizontal bars).
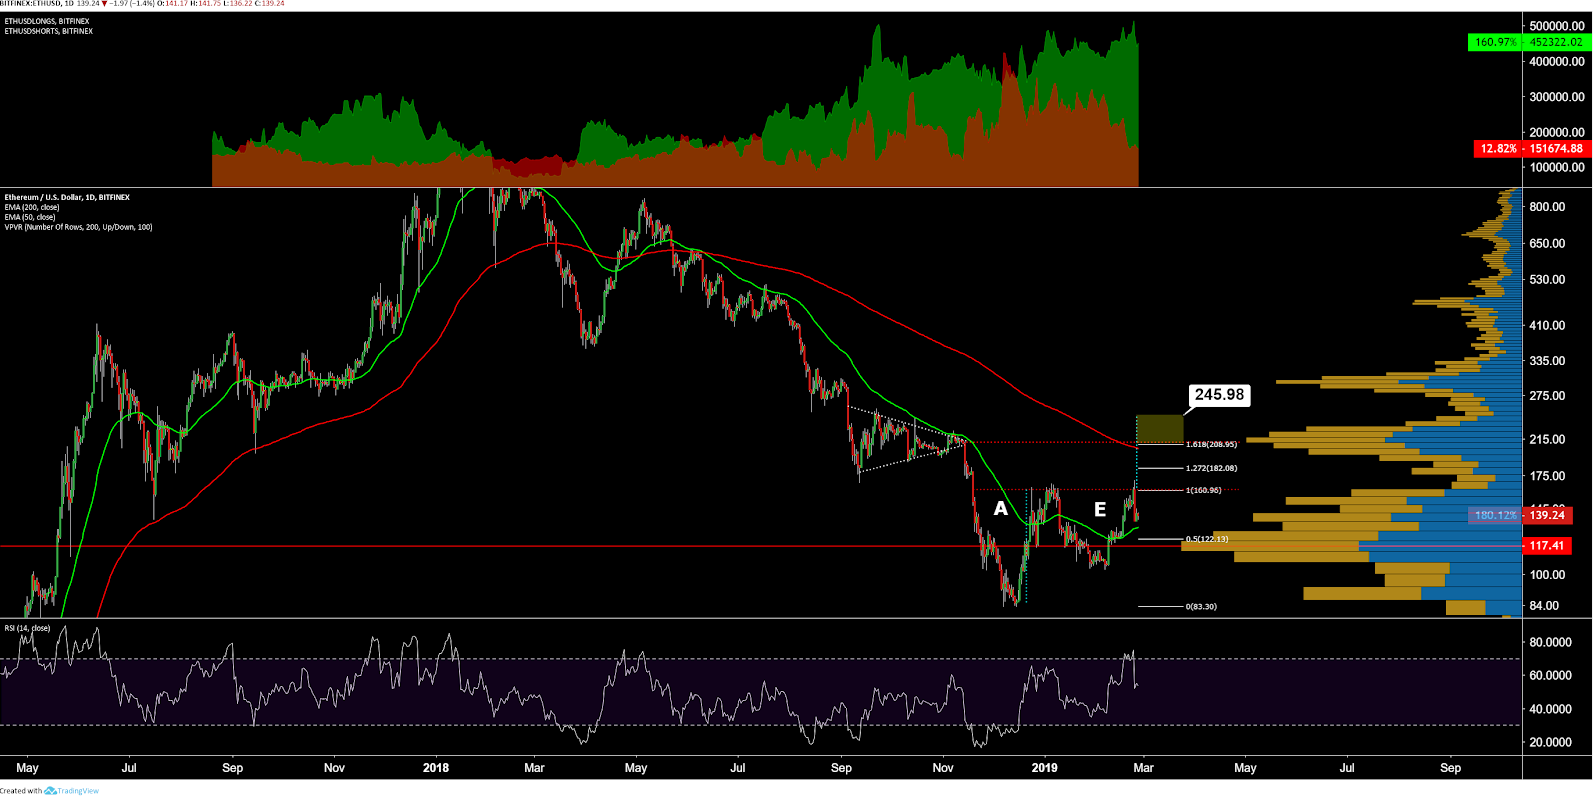
The long/short open interest on Bitfinex (top panel, chart below) is net long, with long positions recently reaching ATHs. Shorts have decreased significantly over the past few weeks and are currently sitting at a three-and-a-half month low. A significant price movement downwards will result in an exaggerated move as the long positions will begin to unwind. This is known as a "long squeeze." A further move down will likely find support at the 50EMA and high volume price level, between US$130 and US$120 respectively. There are currently no active RSI or volume divergences.
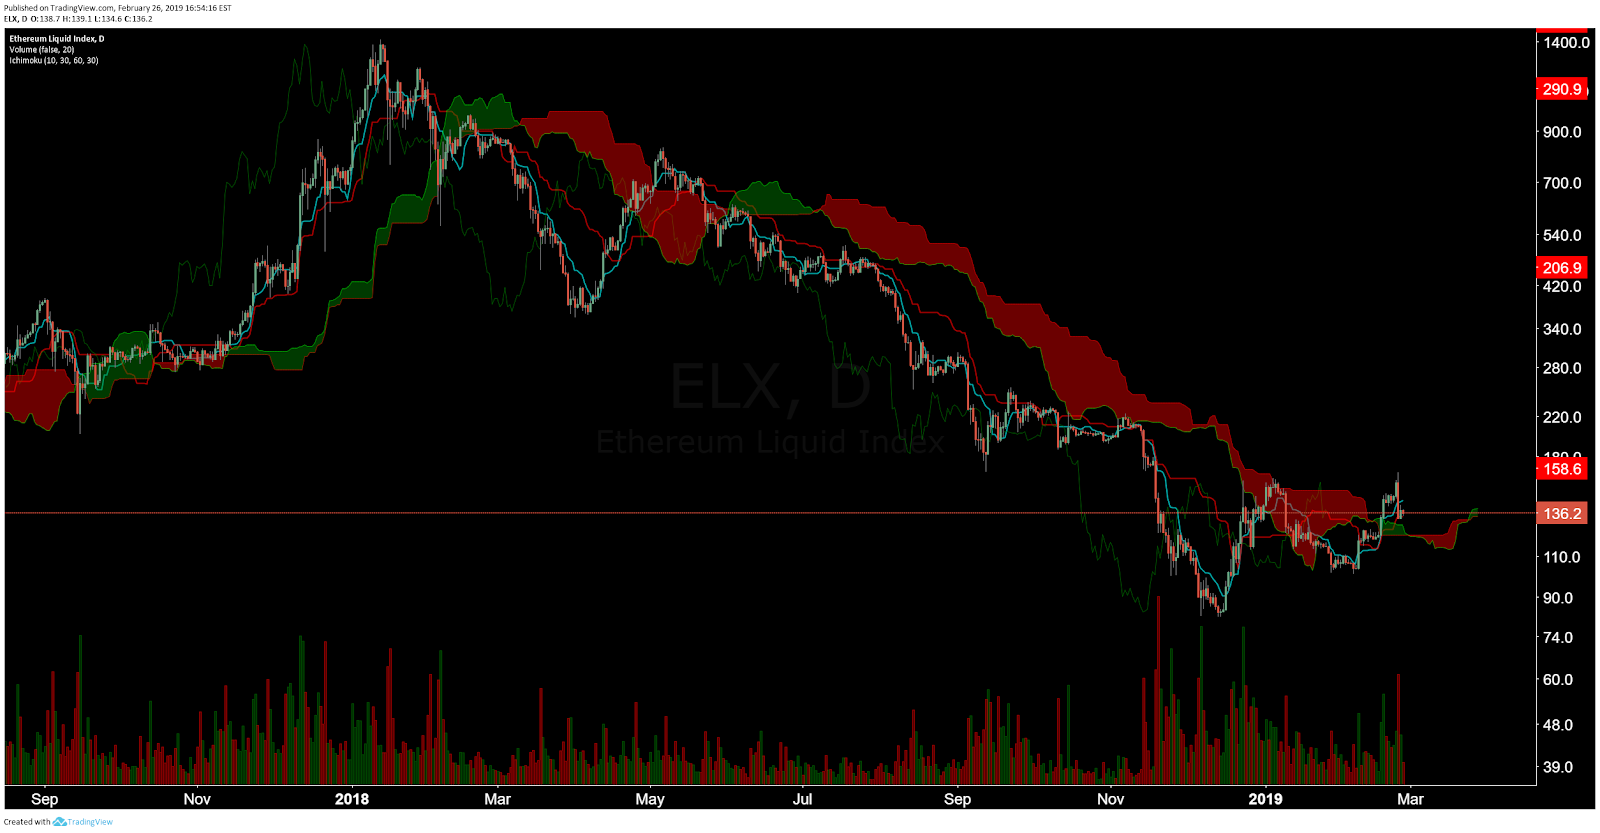
Turning to the Ichimoku Cloud, four metrics are used to indicate if a trend exists; the current price in relation to the Cloud, the color of the Cloud (red for bearish, green for bullish), the Tenkan (T) and Kijun (K) cross, and the Lagging Span. The best entry always occurs when most of the signals flip from bearish to bullish, or vice versa.
Cloud metrics on the daily time frame, with singled settings (10/30/60/30) for faster signals, are bullish; price is above Cloud, Cloud is bullish, TK cross is bullish, and Lagging Span is in Cloud and above price. A traditional long entry triggered on February 17th with an on-volume Kumo breakout. Price is currently sitting at Kijun support. The most conservative approach for a long entry going forward would be to wait until the Lagging Span is above both the Cloud and price. However, even without a clearly bullish Lagging Span position, trend is the most bullish leaning since May 2018.
Cloud metrics on the daily time frame, with doubled settings (20/60/120/30) for more accurate signals, are neutral; price is in Cloud, Cloud is bearish, TK cross is newly bullish, and Lagging Span is below Cloud and above price.
Again, a traditional long entry will not trigger until price is above the Cloud. Price has not been above the Cloud since January 2018. A Kumo twist or Kumo breakout does not appear likely until after March of this year. Price is likely to meander within the Cloud until a breach above or below Cloud resistant or support. For Cloud traders, this is a distinct "no-trade zone" until a decision on the trend is reached.
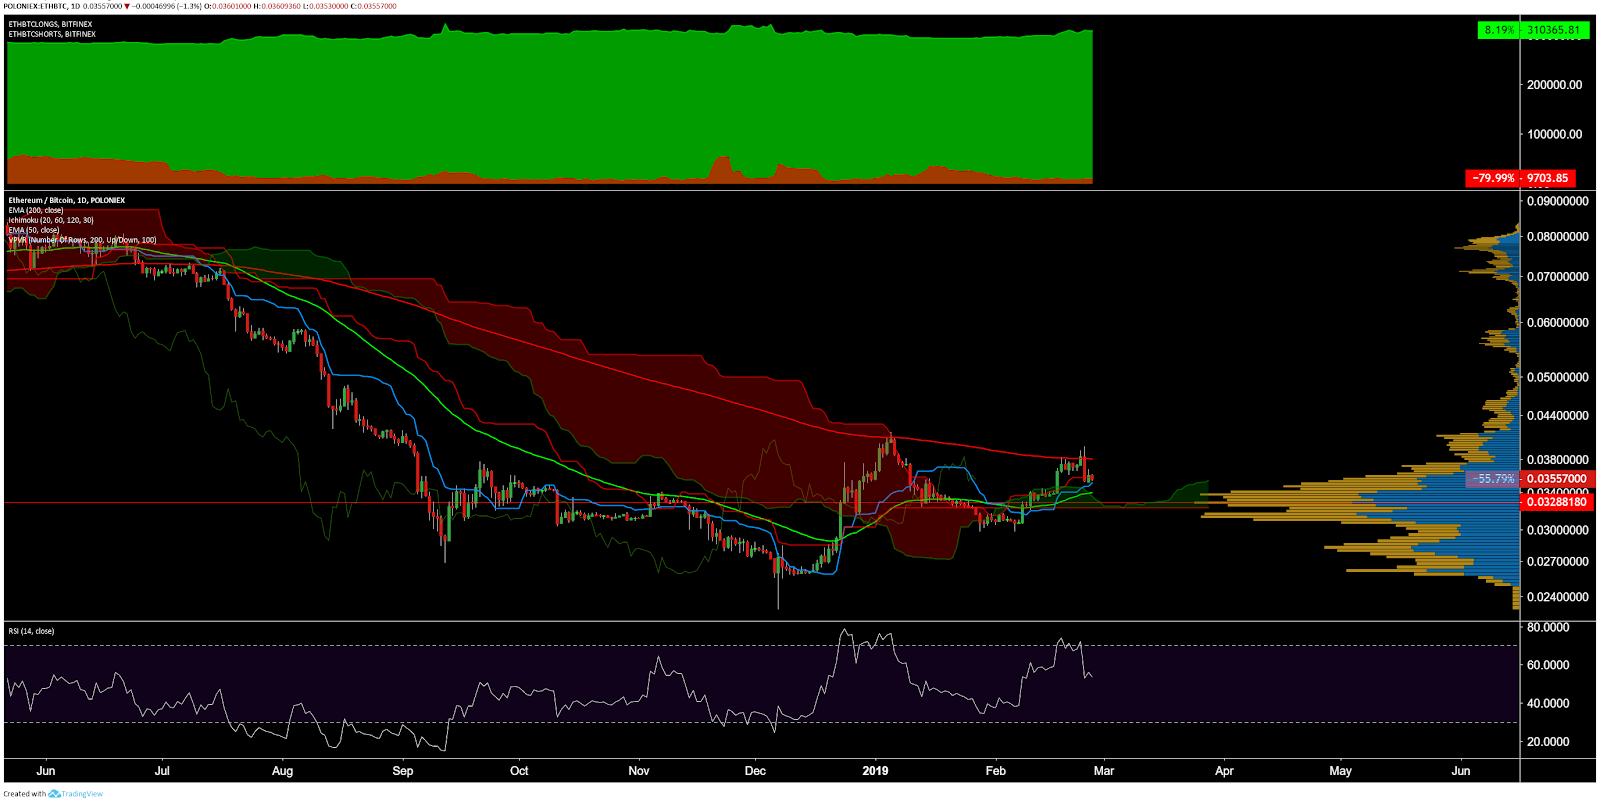
Lastly, on the ETH/BTC pair, doubled Cloud metrics are bullish for the first time since May 2018 with a pending bullish TK cross. The 50/200EMAs are currently bearishly crossed with price tapping the 200EMA on January 5th. A bullish 50/200EMA cross with should act as a strong buy signal for many traders. ETH/BTC open interest (top panel, chart below) on Bitfinex is almost exclusively dominated by long positions. There are currently no active RSI or volume divergences. Any further pullback is likely to find buyers near the 0.032BTC zone with Cloud, 50EMA, and volume support all at these levels.
Conclusion
Ethereum fundamentals from a user standpoint have declined slightly over the past few months, likely in preparation for the Constantinople Hard Fork, due for February 28th. Metrics for ETH will likely continue to increase for the next few months going forward. However, a continued reduction in ETH issuance will affect not only the annual inflation but also mining profitability. If ETH prices remain low, many miners will no longer be able to mine ETH at a profit and ETH hashrate will continue to fall. This will consolidate the remaining hashing power into fewer and fewer entities and may provide additional ammo for the ProgPoW EIP. Although ETH 2.0 is still in early stages, the changes are actively being discussed, debate, and coded.
ICO inflows and outflows are down significantly since 2018. Any ICO holding-related selling pressure is likely to continue until the next wave of potential Security Token Offerings hits the market. Globally, shifting regulatory clarity is pushing most crypto asset raises towards private sales to accredited investors and away from public sales entirely. As ICO ETH holdings have declined, MakerDAO ETH holdings have increased substantially, although this may change with the introduction of multi-collateral DAI coming later this year.
Over the next month, price volatility will likely continue post hard fork. Technicals lean more and more bullish by the day but price remains in a high resistance zone. Although trend indicators show no immediate signs of reversal, a bullish reversal chart pattern yields a reversal target of US$200 over the next two months, which also matches the daily 200EMA resistance. ETH/BTC holds a resistant target of 0.05BTC. The US$50 and US$100 zones remain important levels of psychological support, as well as previous zones of consolidation in 2017, should price turn South.
 Brave New Coin reaches 1M+ engaged crypto enthusiasts a month through our website, podcast, newsletters, and YouTube. Get your brand in front of key decision-makers and early adopters in 2026. Limited slots remaining! Find out more today!


