Ethereum Price Analysis – Fundamentals continue to increase

![]()
On-chain fundamentals including hash rate, transactions per day, and daily active addresses, have increased over the past two months, and are up significantly from year-end 2019 lows.
Ethereum (ETH) is a distributed ledger and decentralized computing platform with smart contract capabilities. The crypto asset is currently second on the BraveNewCoin market cap table, with a market cap of US$23.74 billion and US$3.71 billion in trade volume over the past 24 hours.

Watch a summary of this analysis on YouTube
The ETH project was proposed by Vitalik Buterin in 2013. Other co-founders include Anthony Di Iorio, Charles Hoskinson, Mihai Alisie, Amir Chetrit, Joseph Lubin, Gavin Wood, and Jeffrey Wilcke. An Initial Coin Offering (ICO) followed in 2014. The ICO raised nearly US$16 million, with each token selling for US$0.31. The ETH ICO would eventually become one of the most profitable in history.
The network mainnet went live in July 2015 with 72 million pre-mined coins, which currently accounts for 65.7% of the circulating supply. On Christmas day 2019, Wilcke sent 92,000 ETH, US$11.5 million, to the Kraken exchange, presumably to sell. ETH was launched with no vesting schedule or lock-in period for the pre-mined coins.
Thus far, protocol upgrade milestones have included; Olympic in May 2015, Frontier in July 2015, Homestead in March 2016, Metropolis Part 1: Byzantium in October 2017, Metropolis Part 2: Constantinople in February 2019, Istanbul in December 2019, and Muir Glacier in January 2020.
Ethereum is upgraded through a series of Ethereum Improvement Protocols (EIPs), which are then bundled into each hard fork. The Github repository for EIPs has been extremely active since January 2019.
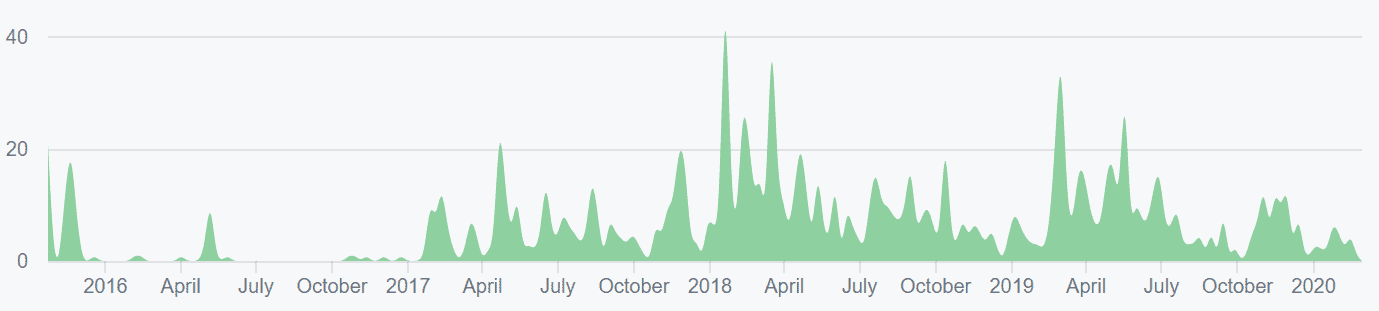
Source: Github – EIPs
In total, almost 1,000 developers have contributed a cumulative 28,000 commits to the ETH project in the past year, across 218 Github repos. Most of the commits over the past year have occurred in the Solidity repo, the programming language used to write smart contracts on Ethereum.
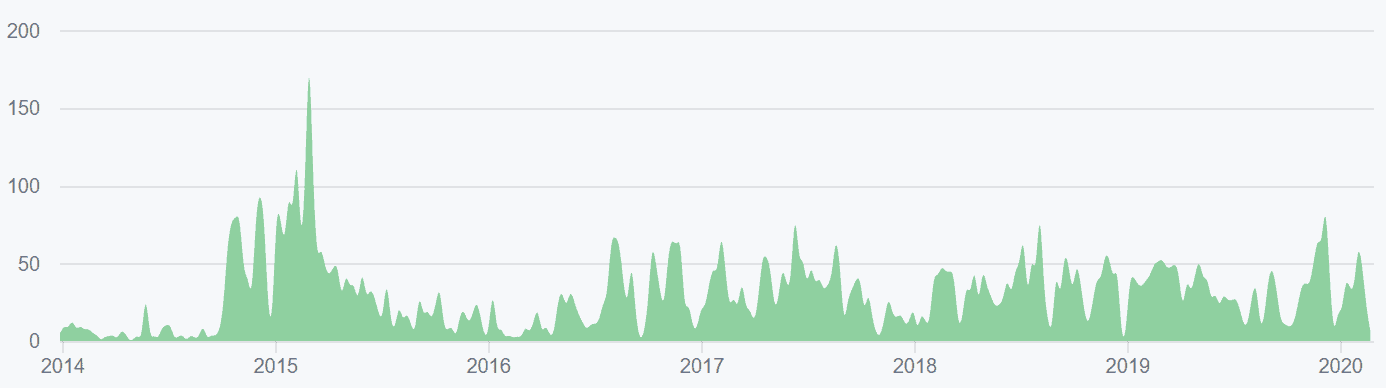
Source: Github – solidity
An adjacent protocol overhaul, Serenity, is currently in development and includes a full
rewrite and redesign, which will result in Ethereum 2.0. Phase zero of the herculean task could launch as early as January 2020. Both versions of ETH will exist concurrently for some time before a migration is completed. Danny Ryan, Justin Drake, and Vitalik Buterin have the most commits in the ETH 2.0 repo.
Overall, ETH related repos have had more commits than any other crypto project over the past year. In December, Buterin also released an alternative proposal for merging ETH 1.0 to ETH 2.0 on an accelerated schedule and less re-architecturing.
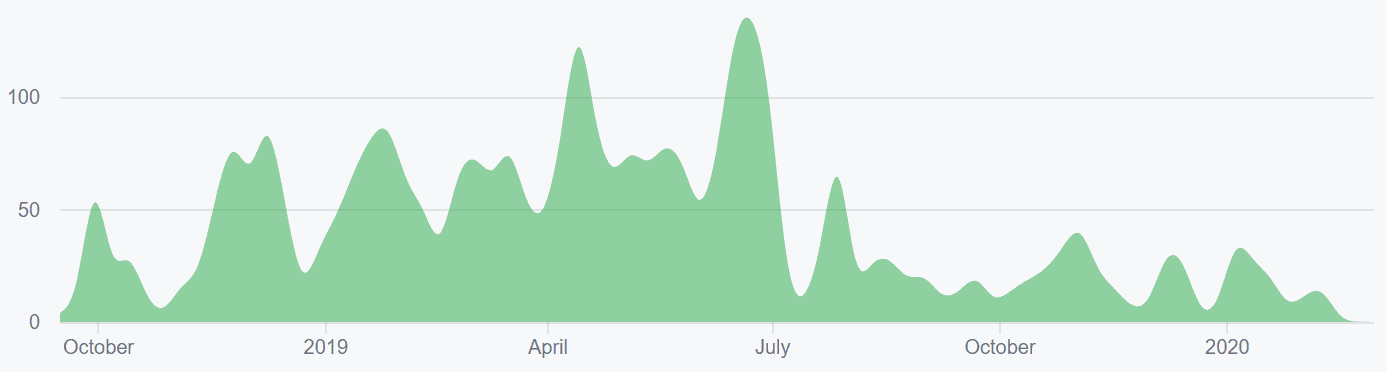
Source: GitHub – eth2.0-specs
ETH 2.0 includes Sharding and Casper, which will drastically alter the network. Sharding refers to a scaling solution for horizontally partitioning data within a database. The full implementation of Casper, slated for release in 2022, will remove Proof of Work (PoW) from the network and replace it with Proof of Stake (PoS), with a block reward at 0.22 ETH/block. Currently, there are no plans to cap the total amount of ETH created.
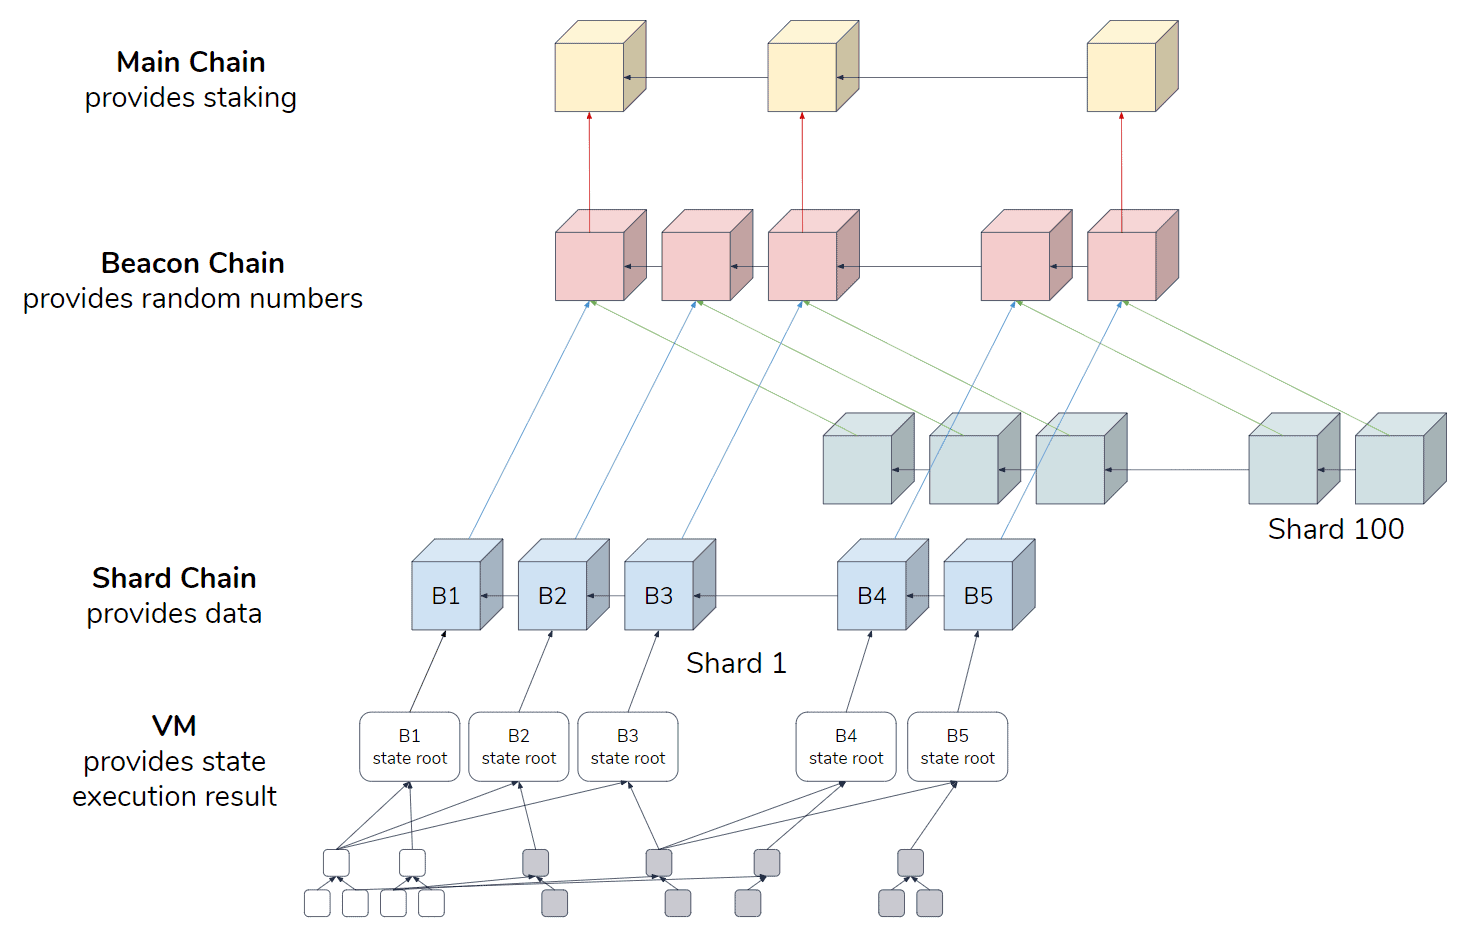
Source: Hsiao-Wei Wang
While the network is still PoW based, Programmatic PoW (EIP 1057) will likely be implemented this year and is designed to reduce ASIC mining on a network by increasing the efficiency of GPU and FPGA mining. Bitmain, Innosilicon, and PandaMiner all have at least three ASIC miners available for the EtHash algorithm, while a new ASIC mining chip from a fourth mining company, Linzhi, was released in October 2019.
If implemented, EIP 1057 will make all current Ethash ASICs unable to mine the chain. Those using Ethash ASICs may choose to continue mining the pre-fork chain. Another possibility is that ASICs will be used to mine the Ethereum Classic (ETC) chain, which also uses the Ethash algorithm. In any case, the goal of decreasing ASIC use on the ETH chain will be successful, although likely temporary. At US$0.04/KWh, all currently available Ethash ASICs are profitable. Mining profitability has increased since January, thanks to rising ETH prices, but remains near all-time lows and if ETH prices fall significantly, hash rate will likely follow suit.
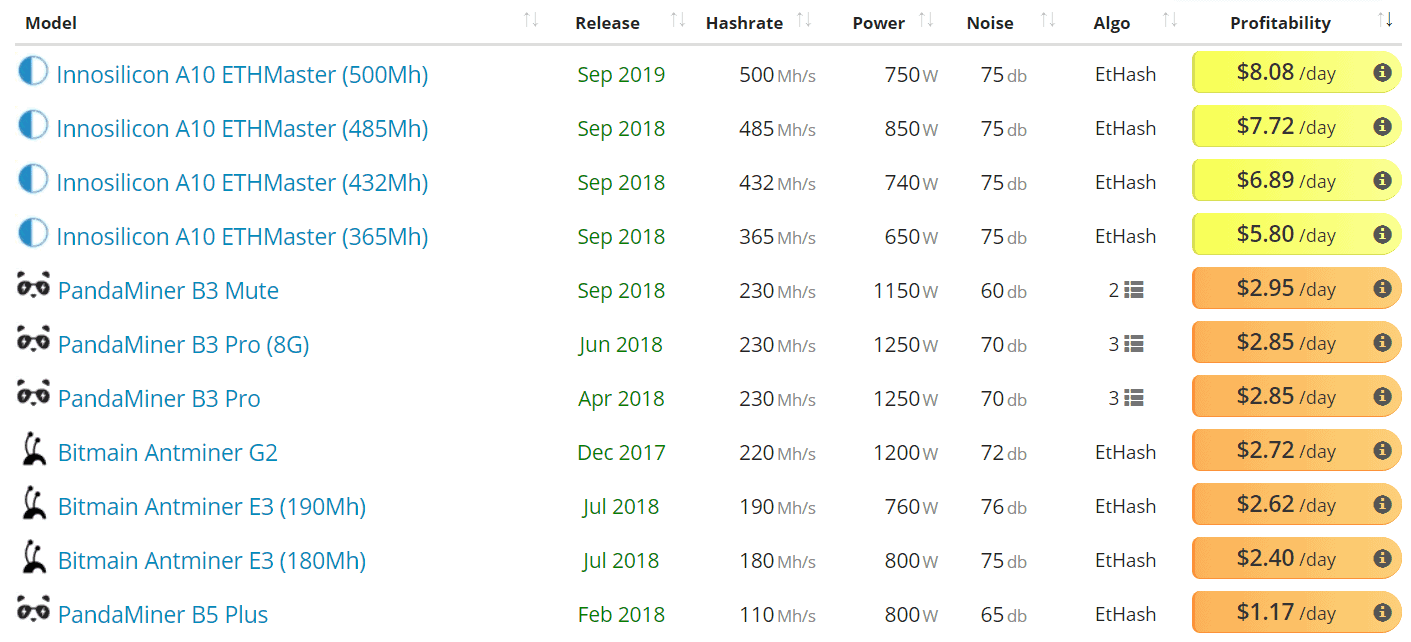
Source: asicminervalue
Hash rate (solid line, chart below) has steadily increased from January lows. Difficulty (dashed line, chart below) had risen steadily since April 2019, becoming disconnected from hash rate in October. This rise in difficulty despite a fall in hash rate is coded into Ethereum and known as an Ice Age, or difficulty bomb, which has activated twice before on Ethereum, once in 2017 and once in late 2018.
The most recent Ice Age was meant to serve as a transition from ETH 1.0 to ETH 2.0 and phase out PoW mining completely. However, because ETH 2.0 is not currently ready, the Ice Age was pushed back another four million blocks, to block 13.2 million, via a hard fork on January 2nd.
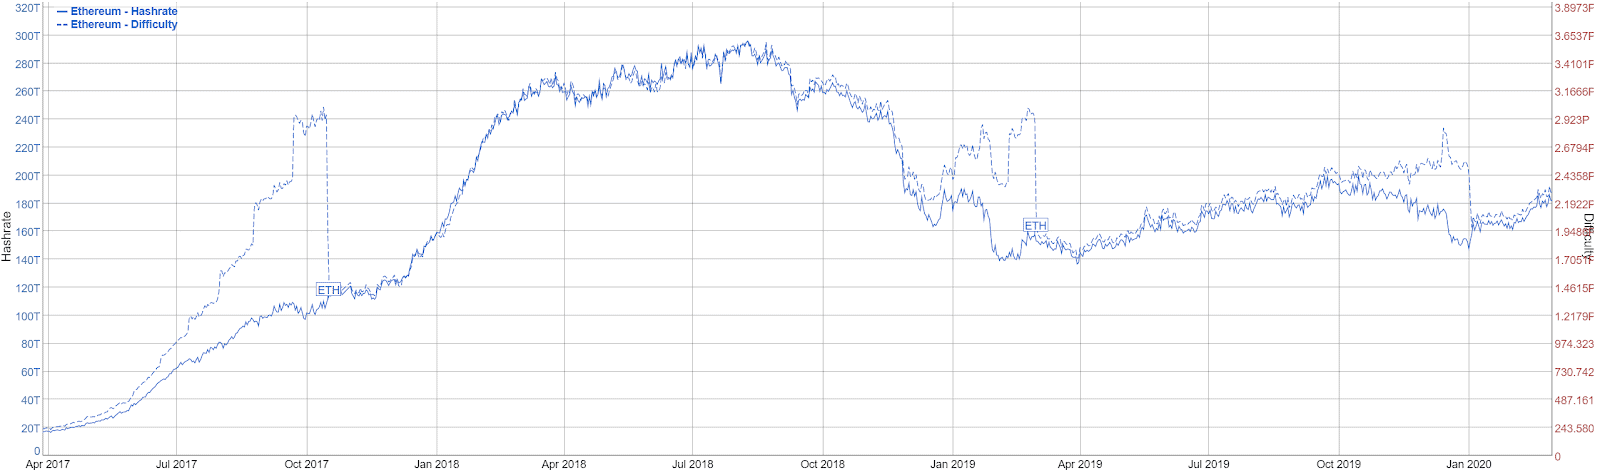
Source: BitInfoCharts
Average block times are currently 13 seconds and blocks per day (line, chart below) are currently at an all-time high. There are nearly 109.5 million ETH in circulation with inflation per annum currently at 4.51% (fill, chart below), which sits near an all-time low. Despite record fast block times, pending transactions are holding near 66,000, with only a few smart contracts accounting for most of the transactions.
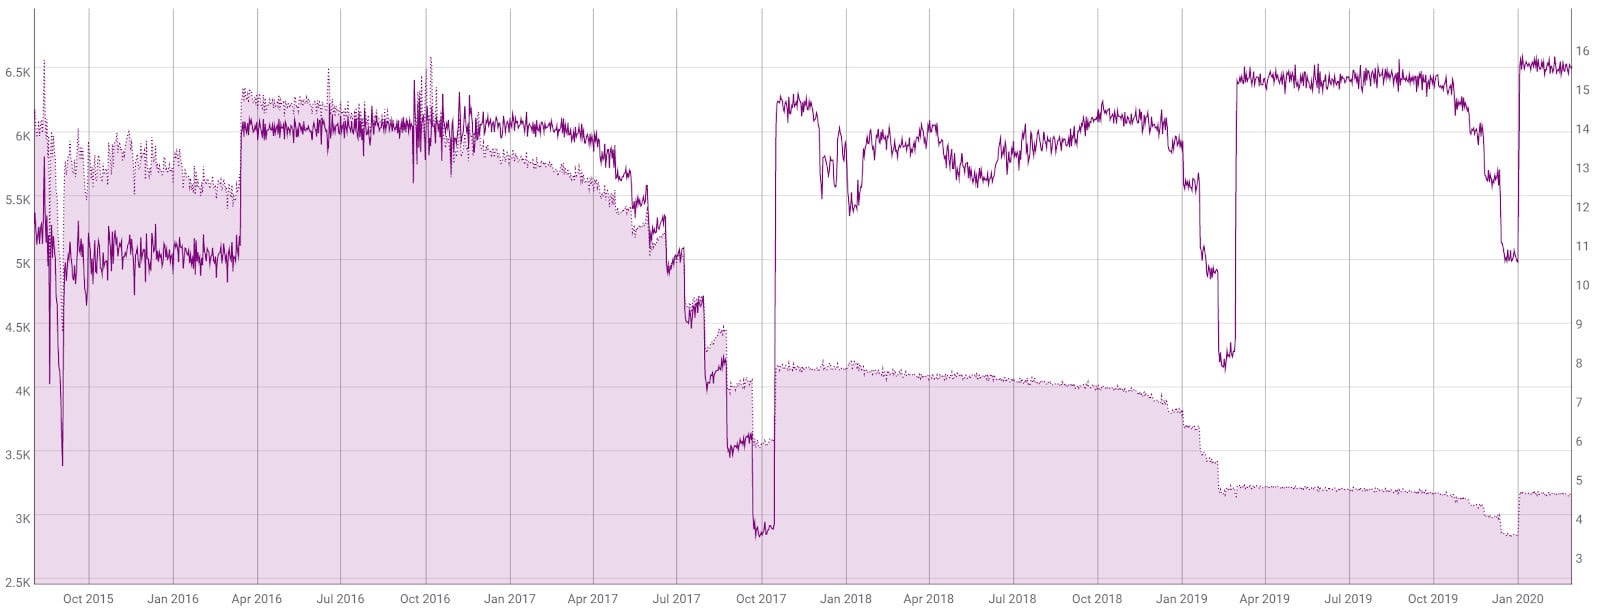
Source: CoinMetrics
Tether (USDT) was originally issued on the OMNI chain in 2015, but has been aggressively swapped to an ERC-20 token over the past few months. In total, nearly 50% of all circulating USDT is now on the ETH chain. ERC-20 transfers are both cheaper and faster than OMNI transfers, thus many exchanges have added the option for ERC-20 USDT in recent months. ERC-20 USDT transactions per day (light green line, chart below) and average transaction values (light green fill, chart below) have quickly surpassed OMNI transactions per day (dark green line, chart below) and average transaction values (dark green fill, chart below).

Source: CoinMetrics
The Ethereum network currently has 7,100 active network nodes, 25% of which currently syncing to the network, 29% of which are located in the United States and at least 40% of these nodes are running through Cloud hosting services. Due to the somewhat cumbersome hardware and time requirements of running a node, many of these nodes are run by Infura, or similar node servicers, who provide access to the network for developers. These services have become increasingly important as the blockchain continues to grow.
Nodes have several sync modes, with fast sync requiring approximately 252 GB of storage and a full archival node requiring nearly 3.68 TB of storage. To contrast, a Bitcoin full node requires just over 300 GB of storage.
The number of on-chain transactions per day (line, chart below) is currently 670,000, increasing from the late January low of 490,000. This remains up from a multi-year low of 430,000 in February 2019, but down from the record high of 1.24 million on January 9th, 2018.
The average transaction fee (fill, chart below) is currently US$0.17, down from over US$0.40 in late September. On February 19th and March 18th, 2019, the average transaction fee spiked to US$1.22 and US$0.63 respectively. Fees had been rising, despite declining transactions per day, because of a lack of efficient scaling methods. In September, miners voted to increase gas limits by 25%. Overall, fees are lower than during much of 2018.
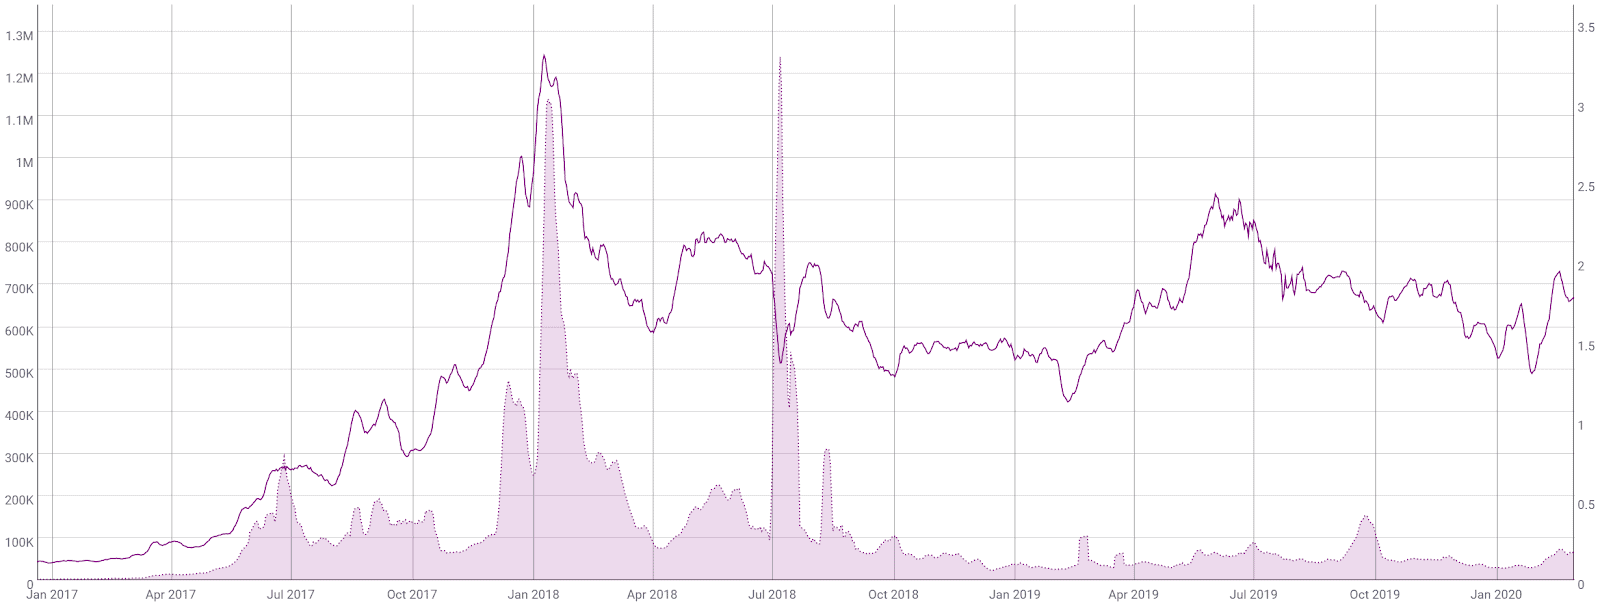
Source: CoinMetrics
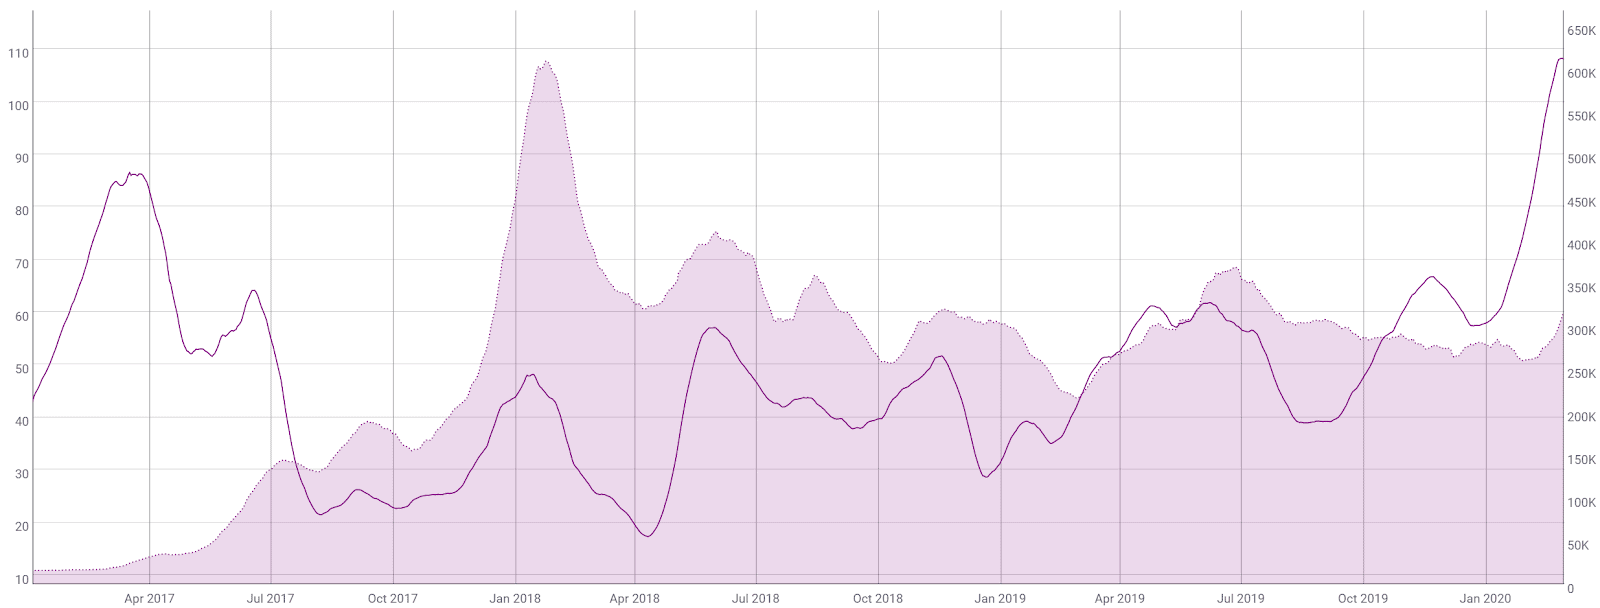
The 30-day network value to estimated on-chain daily transactions (NVT) ratio (line, chart below) is currently 108, representing a three-year high. A clear uptrend in NVT suggests a coin is overvalued based on its economic activity and utility, which should be seen as a bearish price indicator, whereas a downtrend in NVT suggests the opposite. An NVT holding below 30 would likely signify bullish market conditions, as was the case from April 2017 to May 2018.
Monthly active addresses (MAAs) have risen to an eight-month high, currently at 316,000 (fill, chart below). MAAs are up from a yearly low of 192,000 in February, but down from an all-time high of nearly 610,000 in January 2018. Overall, MAAs remain above levels seen throughout 2017 and earlier. Unique addresses continue to grow at a rapid rate, and are nearly 88.6 million (not shown). However, addresses can only be added to the network, and are never deleted.
Source: CoinMetrics
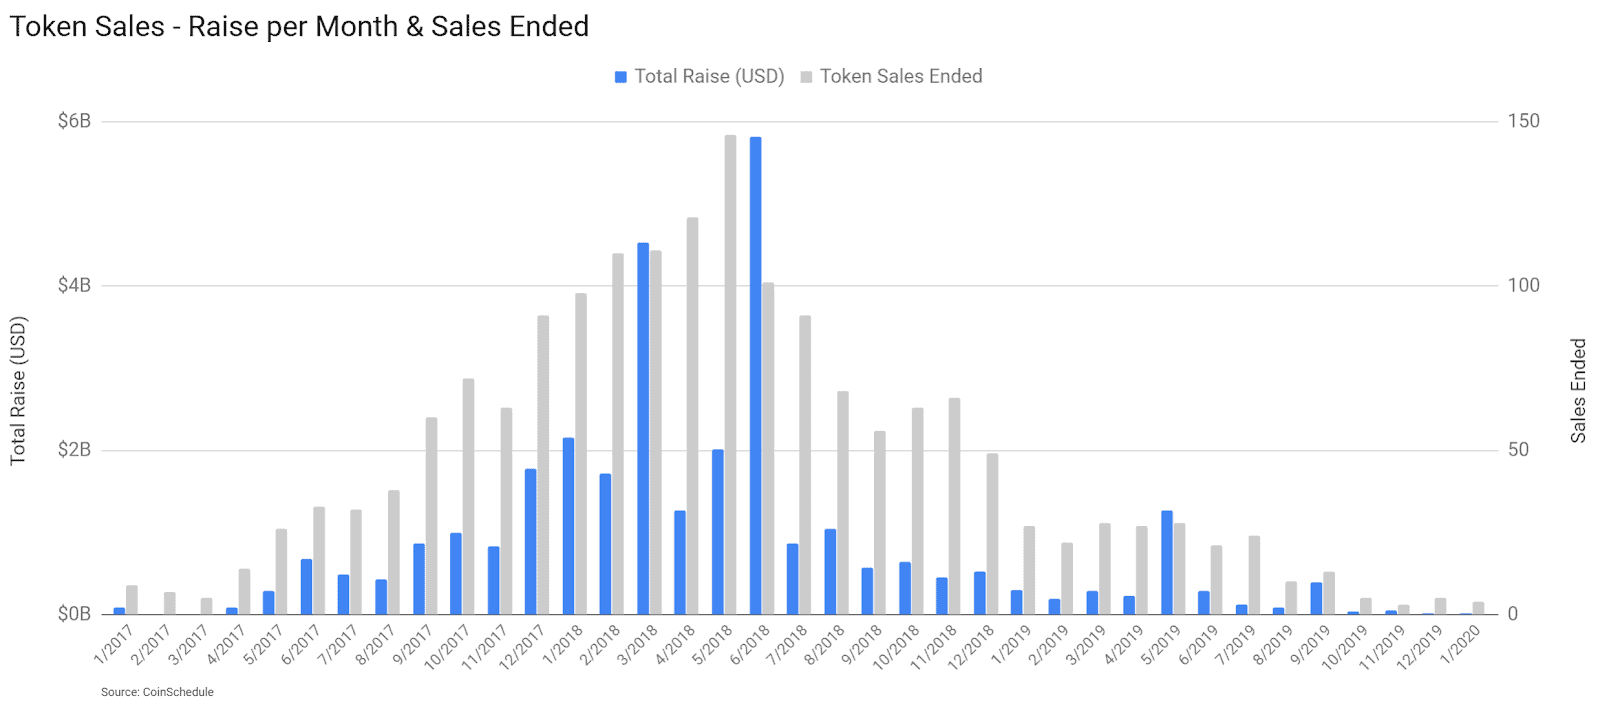
The month of May 2019 marked an almost 12 month high for ICO funding, thanks to Bitfinex’s non-ETH token raise, LEO. At the same time, Initial Exchange Offerings (IEO), where crowdsales are facilitated by an exchange, are increasing in popularity. However, these IEOs typically do not use ETH or have a native blockchain.
Globally, ICOs are increasingly moving away from public sales, likely due to fear of regulatory reproach and a shifting regulatory landscape. 2018 saw both the highest number of ICOs, at 1,075, and the largest USD sum raised in one year, at US$21.48 billion. In 2019, 123 token sales ended raising a total of US$3.265 billion. In contrast, the total USD raise in January 2018 was US$2.81 billion.
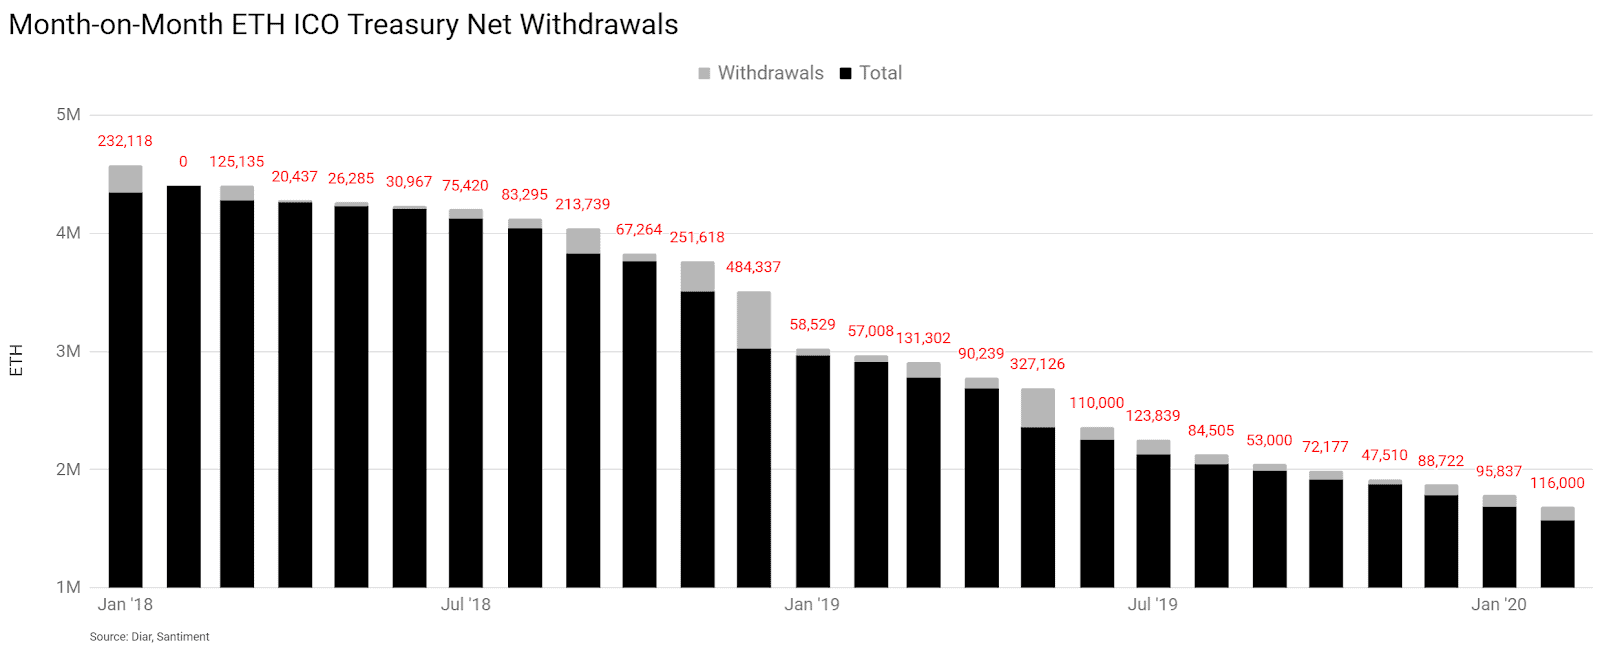
Transparent ICO treasury balances have reduced significantly from 2018 to present, both in USD value and in ETH quantity. May 2019 saw outflows totaling over 327,000 ETH, the largest of the entire year. In 2019, withdrew 1.24 million ETH and continue to hold over 1.5 million ETH. Since January 2020, ICOs have withdrawn 212,000 ETH with Aragon, Kyber, Monetha, Mysterium, SingularDTV, Gnosis, and Status all withdrawing at least 10,000 ETH from their respective treasuries over the past month.
The three largest remaining treasuries are DigixDAO, Golem, and Polkadot, at 386,000 ETH, 356,000 ETH, and 306,000 ETH, respectively. Polkadot’s funds were frozen in November 2017 when a bug was executed which deleted a code library for the Parity multi-sig wallet. In January, DigixDAO stakeholders approved a measure to return all current funds to investors, which should take by around Q2 2020.
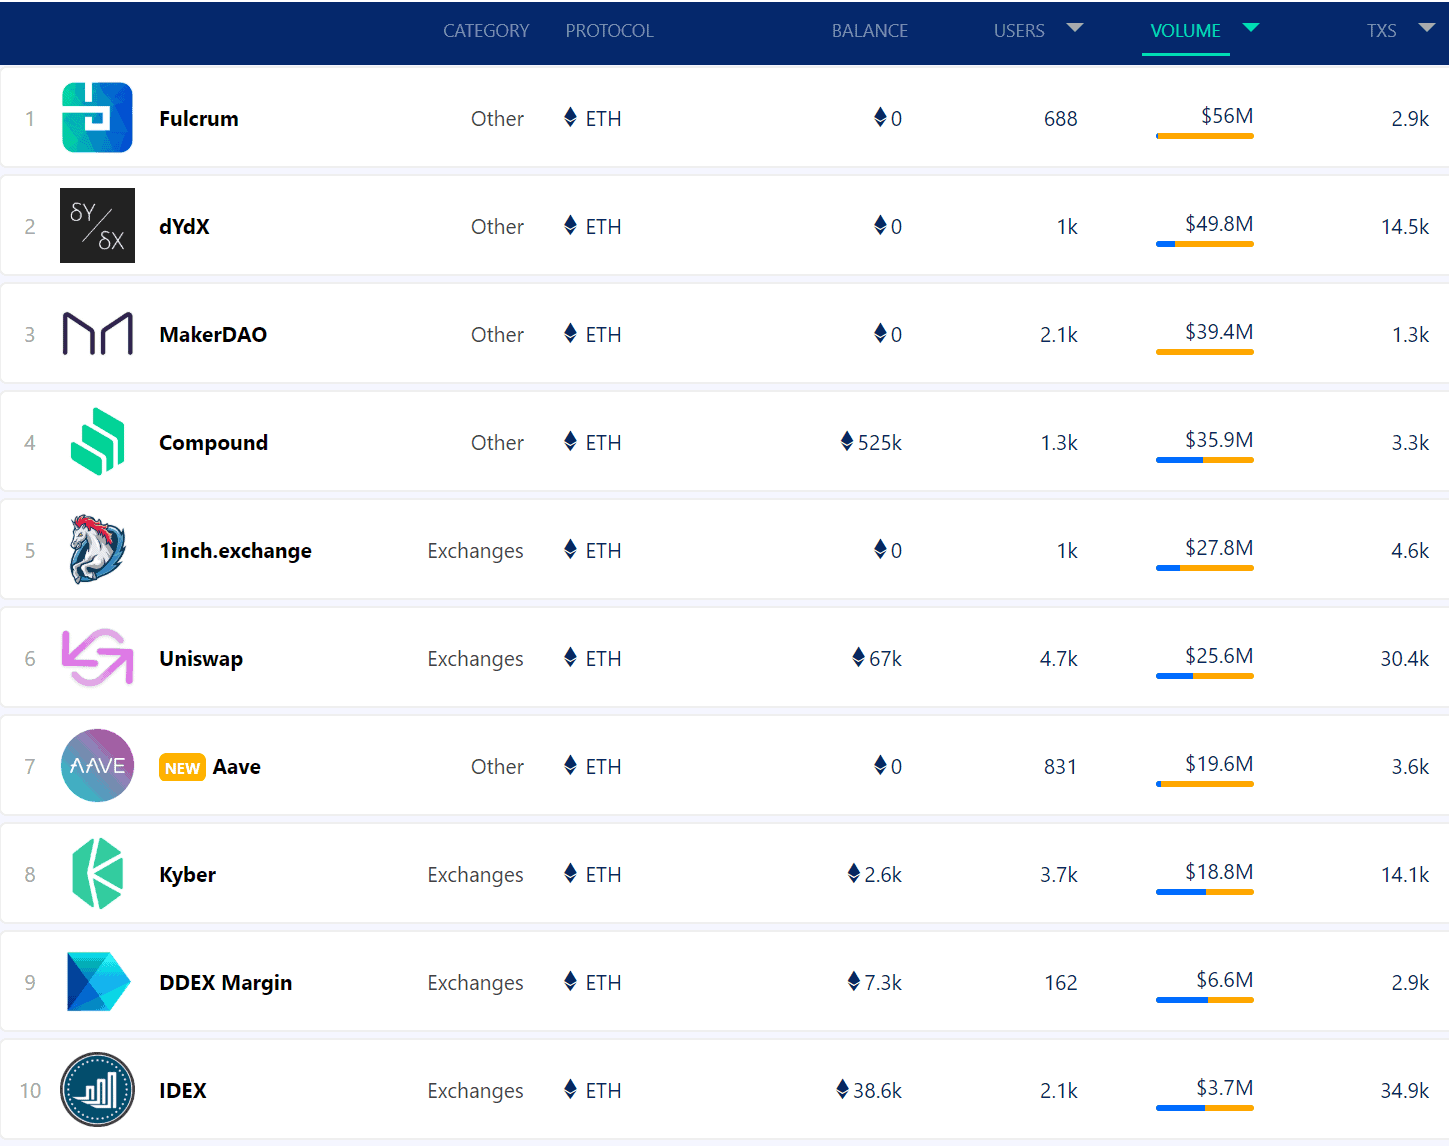
The top Ethereum based dapps over the past week, ranked by volume, are led by DeFi and exchange dapps. The 0xUniverse dapp had the most transactions over the past week at a reported 47,700.
Overall, ETH has a considerably lower number of users and transactions compared to other dapp platforms like EOS (EOS) and Tronix (TRX), both of which have no transaction fees. In February 2019, Twitter user Kevin Rooke pointed out that of the 1,375 ETH dapps, 86% had zero users and 93% had zero transaction volume.
Source: DappRadar
The Decentralized Finance movement, or DeFi, has increasingly gained in popularity with the total ETH held in DeFi currently at 2.86 million ETH or nearly US$920 million. Lending dapps have seen the biggest influx of money as their products began to provide a return for users. The Maker DAO, which uses collateralized debt positions to back the semi-stablecoin Dai, currently holds around 57% of all ETH in the DeFi ecosystem.
Last month, bZx, the eleventh-largest DeFi protocol with over US$7.5 million worth of funds locked currently, lost $350,000 and $645,000 worth of ETH in two separate exploits. The incidents highlight the current risk of using the DeFi products.
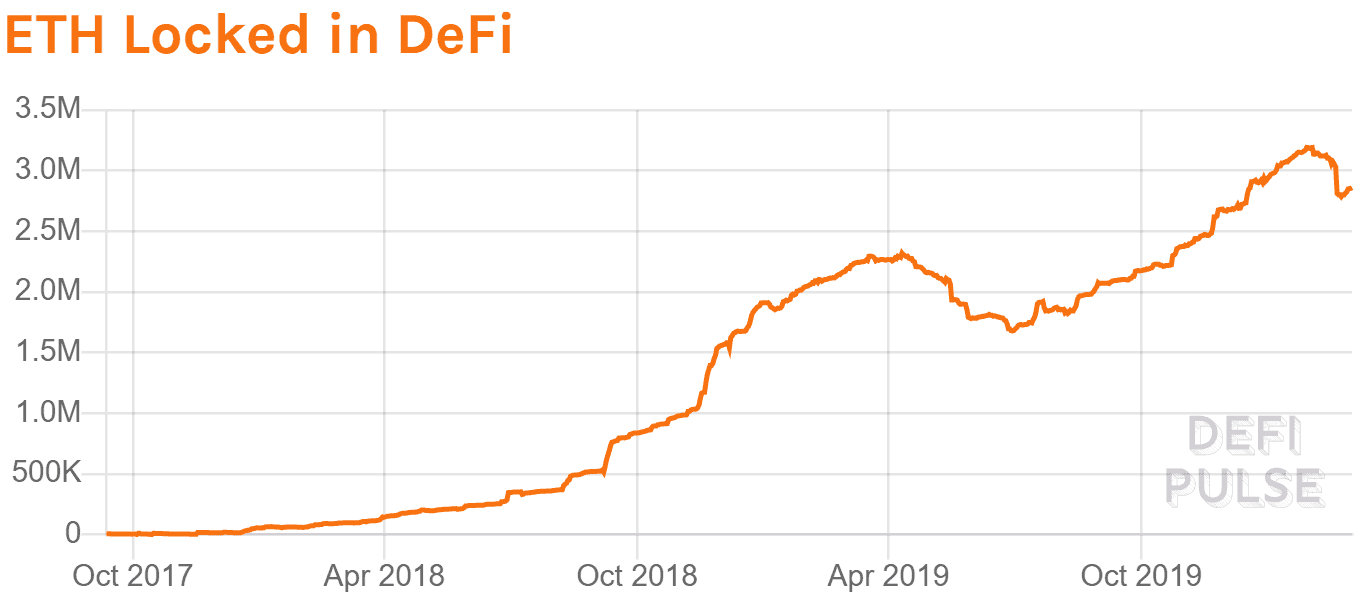
Source: DefiPulse
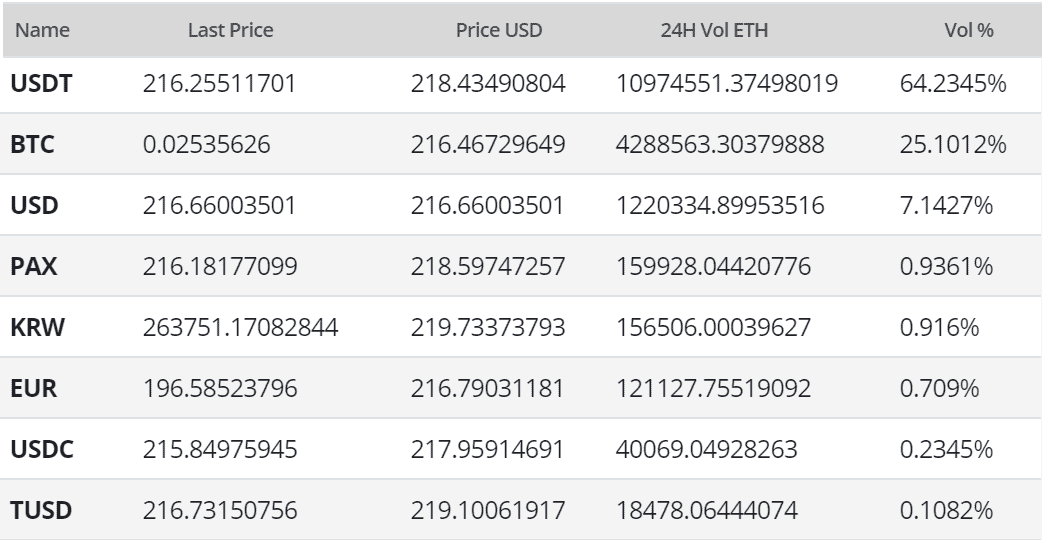
In the markets, ETH exchange-traded volume over the past 24 hours has predominantly been led by Tether (USDT) pairs. Non-USDT stablecoin volume has slowly increased over the past six months, including USD Coin (USDC), Dai (DAI), Paxos-Standard (PAX), Gemini-dollar (GUSD), and TrueUSD (TUSD), but continues to remain a fraction of total traded volume. A CME Group ETH futures product is also rumored to be approved sometime this year by the U.S. Commodity Futures Trading Commission.
In Asia, the Korean Won (KRW) and Yen pairs have ETH at approximately US$220 and US$216, respectively. Together, both regions show relatively low interest in their fiat pairs, with nearly 1.17% of the total traded volume combined. A return of a significant premium in South Korea would signify a return to bull market conditions. Both the lack of premium and drop in trading pair percentage suggest a significant drop in retail trading on these South Korean exchanges.
In November 2019, the South Korean exchange Upbit reported 324,000 ETH, or about US$50 million, stolen during a cold wallet migration. Upbit has announced it will reimburse users through company funds. Over the past few years, South Korean exchanges have become a prime target for North Korean hackers, although no suspects for the most recent loss of funds are currently being released.
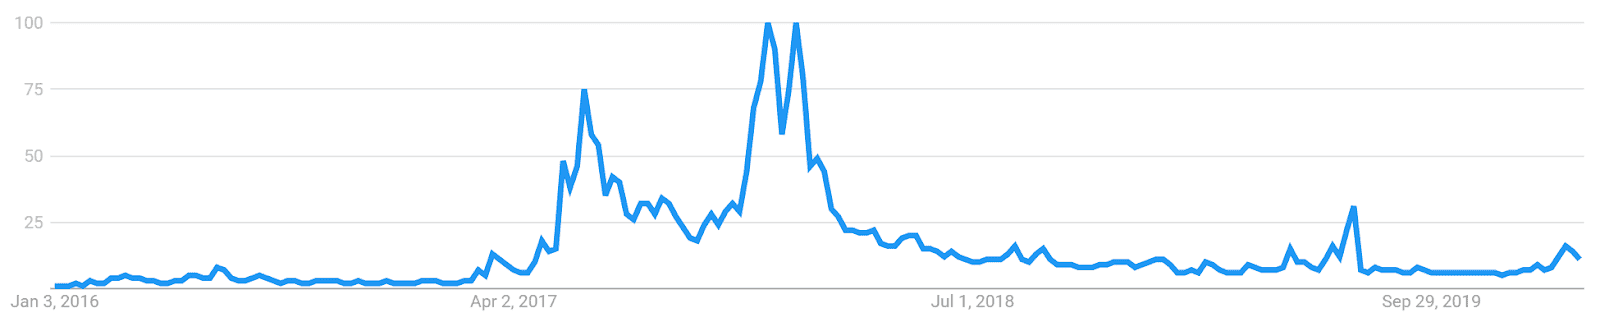
Worldwide Google Trends data for the term "Ethereum" spiked in July 2019 and February 2020, which matched a swift increase in price. Overall, searches for “Ethereum” remain down significantly from early 2018. A slow rise in searches for "Ethereum" preceded both highs in June 2017 and January 2018, likely signaling interest from new market participants at that time.
A 2015 study found a strong correlation between the Google Trends data and BTC price, while a May 2017 study concluded that when the U.S. Google "Bitcoin" searches increased dramatically, BTC price dropped.
Technical Analysis
The current ETH/USD spot price is down 85% from the all-time high set in January 2018, and down 40% from the June local high. However, the crypto asset remains up 85% from the December 2018 low.
The ETH/USD spot price has undergone several swift reversals over the past several months, and is now essentially back to where the previous bullish move in April 2019 began. As a macro bear trend dissipates, roadmaps for future market movements can be found on high timeframes using Exponential Moving Averages, Volume Profile Visible Range, Pitchforks, Ichimoku Cloud, and divergences. Further background information on the technical analysis discussed below can be found here.
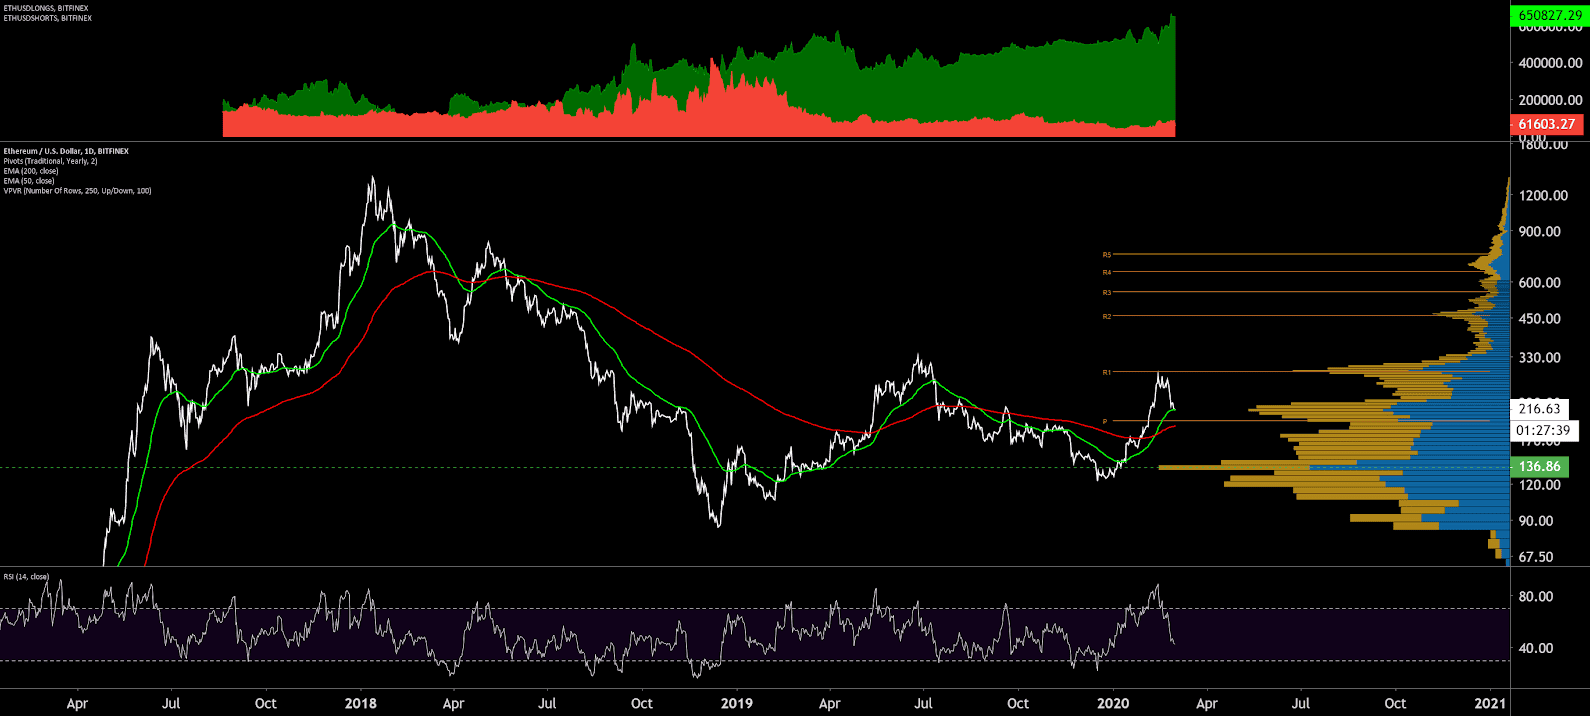
On the daily chart for the ETH/USD pair, the 50-day Exponential Moving Average (EMA) and 200-day EMA Golden Cross occurred on February 11th, a signal for bull market conditions. Based on the Volume Profile Visible Range (VPVR – horizontal bars, chart below), the current spot price now sits between the US$215 support node and US$290 resistance node. Yearly Pivots, or mathematical support and resistance based on the highs and lows of the previous year, also sit near these VPVR zones. There are no RSI or volume divergences on the daily chart at this time.
The long/short open interest on Bitfinex (top panel, chart below) is currently 91% long with long positions reaching a record high over the past month. A significant price movement downwards will result in an exaggerated move further, as the long positions will continue to unwind. This is known as a “long squeeze.” However, Bitfinex long/short ratios have historically had little bearing on Ethereum price action.
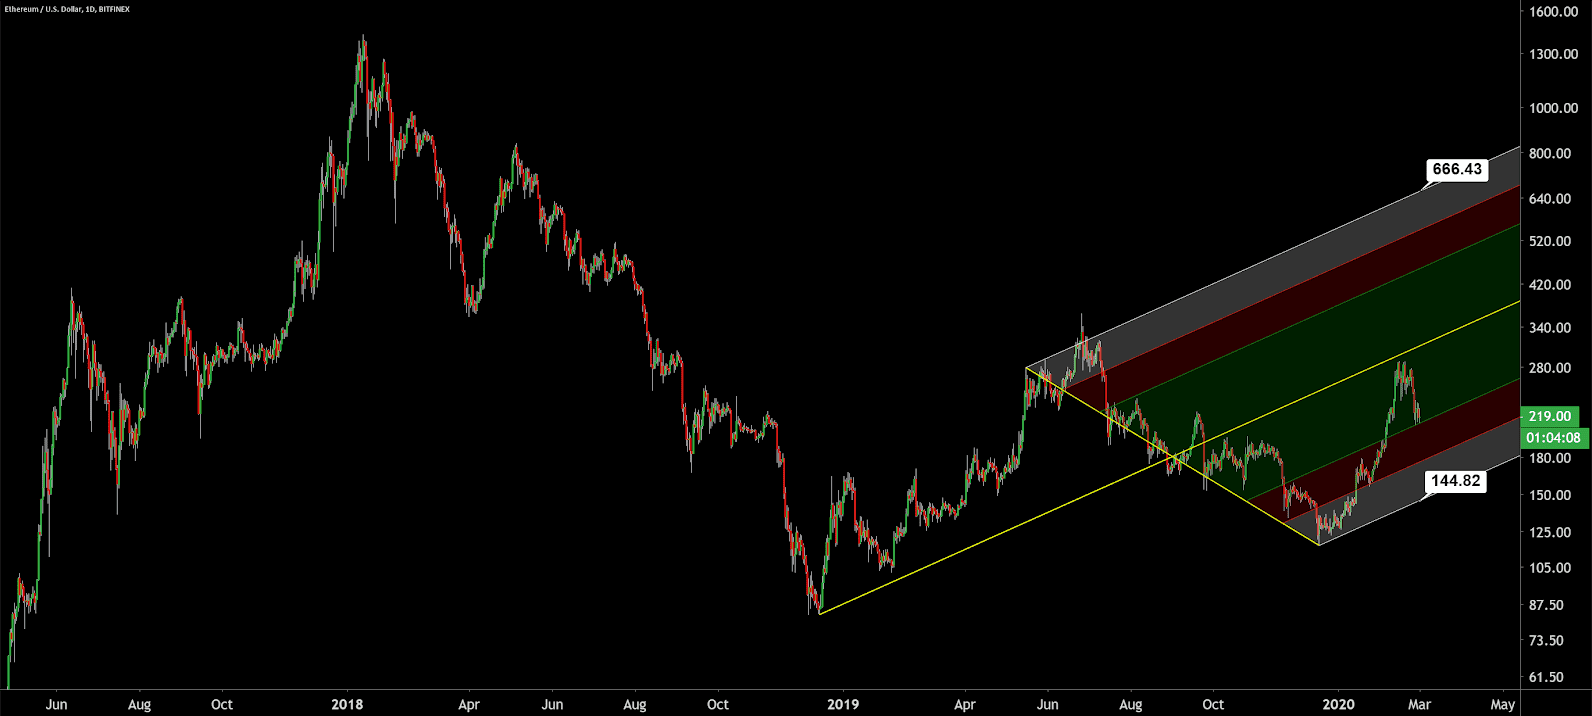
This market has also established a new bullish Pitchfork (PF). Once the trend is defined, the spot price will continually attempt to return to the median line (yellow). A bullish PF is invalidated once the spot price falls below the lowest support, currently at the psychological support of US$150. The upper most resistance currently sits at the psychological resistance of US$666.
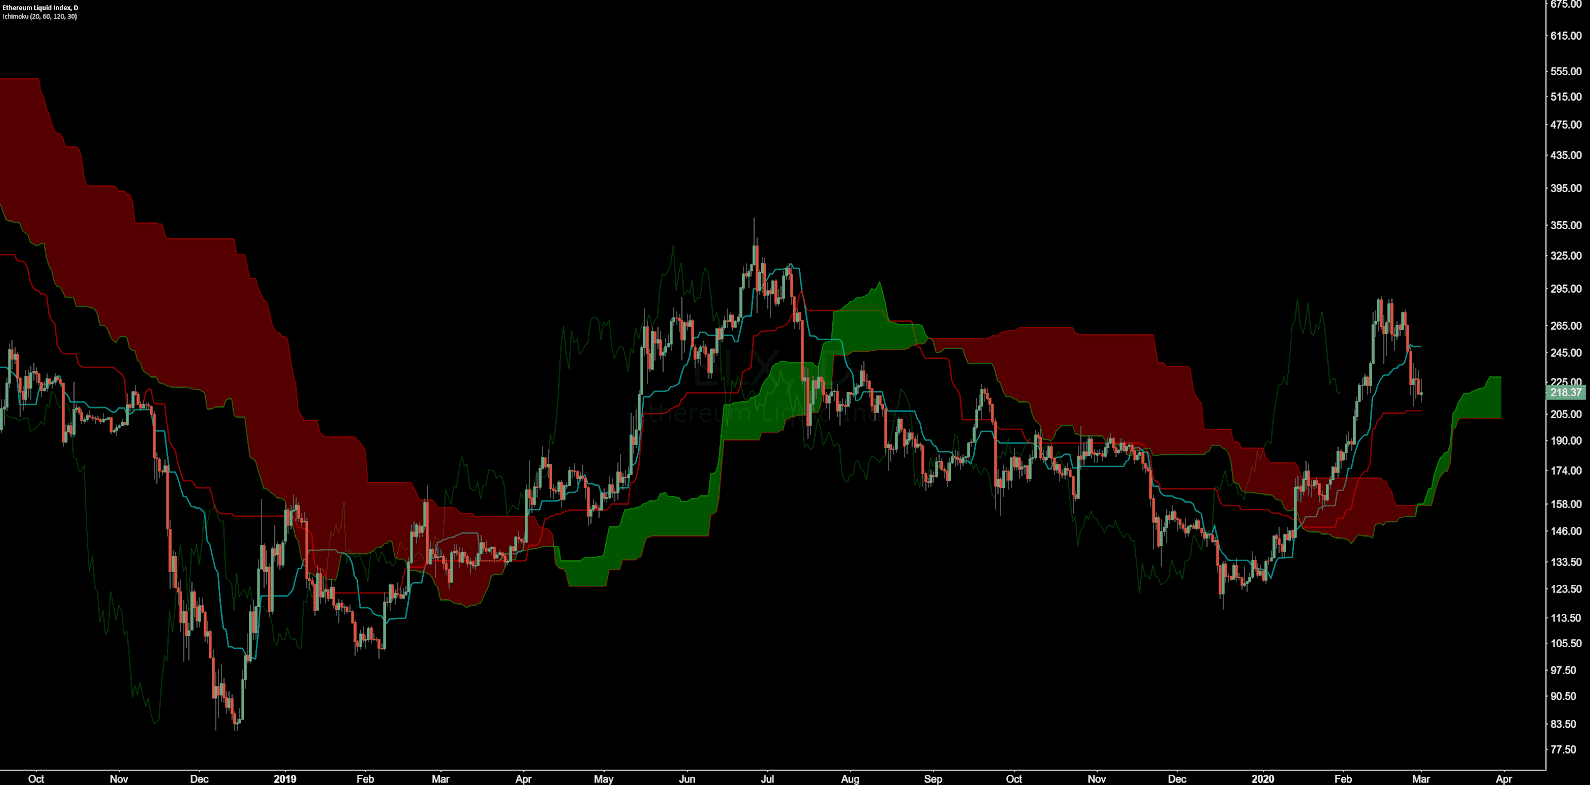
Turning to the Ichimoku Cloud, four metrics are used to indicate if a trend exists; the current price in relation to the Cloud, the color of the Cloud (red for bearish, green for bullish), the Tenkan (T) and Kijun (K) cross, and the Lagging Span. The best entry always occurs when most of the signals flip from bearish to bullish, or vice versa.
Cloud metrics on the daily time frame, with doubled settings (20/60/120/30) for more accurate signals, are bullish; the spot price is above the Cloud, the Cloud is bullish, the TK cross is bullish, and the Lagging Span is above Cloud and above the spot price. The trend will remain bullish so long as price remains above the Cloud. Kijun support is currently US$206 and Cloud support is currently US$202.
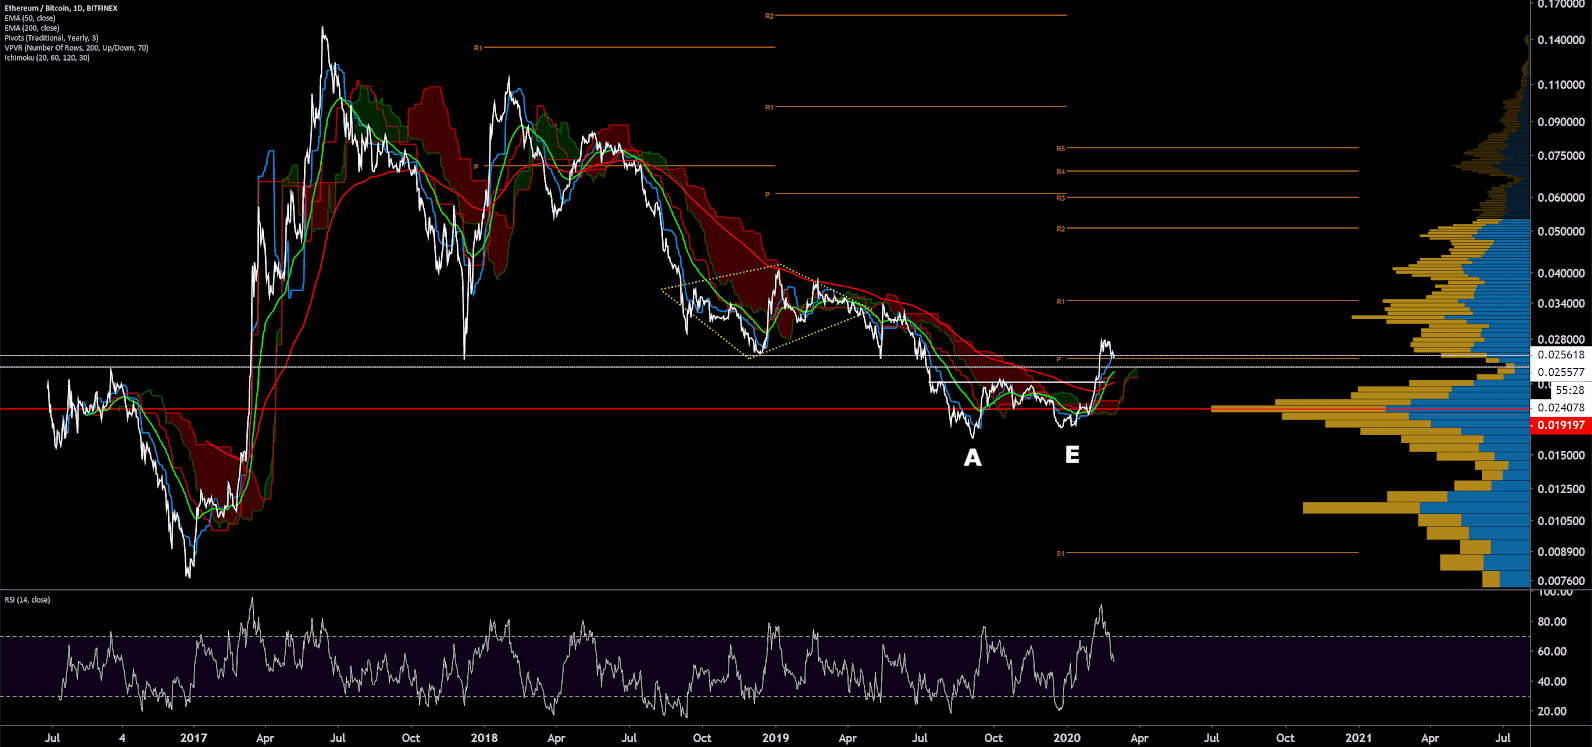
Lastly, on the daily ETH/BTC chart, trend indicators are bullish with a 50-day EMA and 200-day EMA Golden Cross and the spot price above the Cloud. This market also completed an Adam and Eve double bottom reversal pattern, adding to the bullish confluence. The spot price is now above a key long term support and resistance and Yearly Pivot level of 0.025 BTC. Further upside will find resistance at the VPVR and psychological level of 0.03, as well as the Yearly Pivot at 0.0345 BTC. There are also no bullish or bearish divergences at this time.
Conclusion
On-chain fundamentals including hash rate, transactions per day, and daily active addresses, have increased over the past two months, and are up significantly from year end 2019 lows. The ProgPoW consensus algorithm change is likely coming this year, and will drastically change the current Ethash mining landscape. Although ETH 2.0 is still in the early stages of development, the changes are actively being discussed, debated, and coded, with a phase zero release slated for release this year as well.
The amount of ETH locked in DeFi apps continues to increase as ETH held by ICO treasuries continues to decrease, potentially providing a new avenue to decrease the circulating ETH supply. ICOs on the ETH chain trended toward zero throughout 2019. As DeFi usage increases, on-chain metrics need to be retooled to better represent and include smart contract activity, such as Dai transfers. NVT, an inverse metric of economic utility, is currently above multi-year highs, despite significant DeFi activity.
Technicals remain bullish for the ETH/USD pair based on current trend metrics, as the spot price is currently above both the 200-day EMA and the daily Cloud. In the near term, this market will likely find support near the daily Kijun at US$206, which represents a 25% decline in the past 10 days. Over the next few months, a target of US$285 to US$300 is likely based on a newly established bullish PF and yearly pivots.
Technicals for the ETH/BTC pair are bullish based on trend metrics, as the spot price is currently above both the 200-day EMA and the daily Cloud. In the near term, support will need to confirm and consolidate near the 0.025 BTC level. Overall, this is the first sign of bullishness for the pair since ICOs peaked in mid 2018.
 Brave New Coin reaches 1M+ engaged crypto enthusiasts a month through our website, podcast, newsletters, and YouTube. Get your brand in front of key decision-makers and early adopters in 2026. Limited slots remaining! Find out more today!


