FLOKI Price Faces Market Fatigue as Open Interest Declines

![]()
After weeks of sideways action, FLOKI’s volatility tightens while traders show signs of stepping back.
The price shows considerable volatility with frequent swings, including a sharp spike followed by a retracement and a phase of sideways movement at a slightly elevated level.
Drop in Open Interest and Slowing Momentum
Data shows that open interest has steadily declined after reaching a local high, suggesting that traders are closing rather than opening new positions. This typically reflects waning bullish conviction or a more cautious approach, as market participants take risk off the table.
If FLOKI’s price continues to hover near current levels while open interest falls, it could point to a lack of new entrants and less momentum for any substantial upside breakout in the near term.
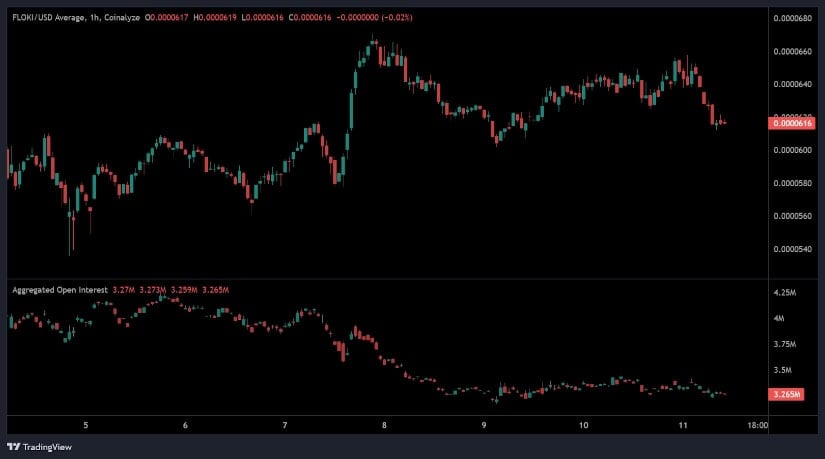
Source: Open Interest
The simultaneous drop in open interest alongside relatively stable prices indicates a “holder’s market,” where fewer active participants drive price discovery. This can suggest either accumulation by long-term investors or a simple lack of conviction.
If open interest continues to fall, volatility may re-emerge quickly either through a short squeeze if buyers return aggressively, or a selloff if holders begin exiting on renewed bearish sentiment.
FLOKI Down -2.23%as Market Cap Nears $608 Million
According to BraveNewCoin, FLOKI is currently trading at $0.00006286, marking a -2.23% decline over the past 24 hours. The token holds a market capitalization of $608.1 million, with $64.04 million in daily trading volume and a circulating supply of 9.65 trillion tokens.
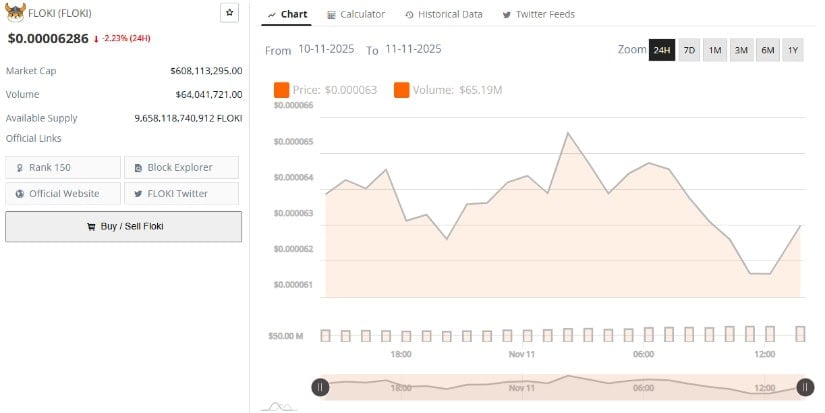
Source: BraveNewCoin
The con ranks #150 by market cap, maintaining liquidity and visibility among mid-cap meme coins. Despite the modest pullback, on-chain activity suggests sustained community engagement and minor inflows to decentralized exchanges.
Technical Analysis: Near Lower Bollinger Band with Bearish Bias
On the other hand, TradingView data shows FLOKI’s current market structure retains a bearish bias, with price trading near $0.00006185, below the middle Bollinger Band at $0.00006719.
The Bollinger Bands have narrowed, reflecting reduced volatility but continued downside pressure. The lower band at $0.00005586 remains a key support area, and a decisive close below it could invite further declines toward $0.000052. Resistance is seen near $0.0000785.
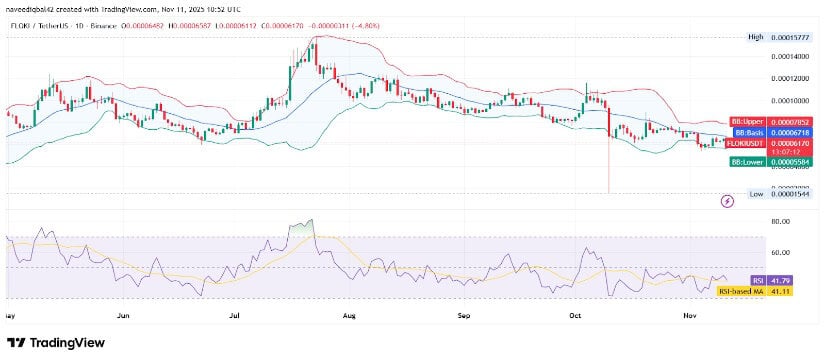
Source: TradingView
The RSI stands at 41.93, signaling weak buying momentum, with the RSI-based MA flat at 41.12, confirming a lack of strong directional bias. The coin continues to trade within a descending channel, indicating mid-term consolidation.
For bulls to regain control, the price must reclaim the $0.000070–$0.000080 zone with notable volume expansion. Until that happens, traders should expect range-bound price action and cautious accumulation within the current support band.
 Brave New Coin reaches 1M+ engaged crypto enthusiasts a month through our website, podcast, newsletters, and YouTube. Get your brand in front of key decision-makers and early adopters in 2026. Limited slots remaining! Find out more today!


