GNT Price Analysis: The long road to utility


Golem (GNT) prices have suffered heavily in 2018 with the token lacking fundamental utility, and facing FUD surrounding the quality of the current ICO and Dapp ecosystem. With product development still, only in early stages, price remains exposed to the volatile wrath of crypto markets without any real protection.
Golem (GNT) is one of the crypto spaces most ambitious, discussed, and well funded projects. The Ethereum-based solution aims to create global decentralized supercomputer that fluidly combines the computing power of each node in the network, ensuring any one may process computational tasks fully to desired capabilities.
This style of far-ranging Web 3.0 product would clearly be challenging for any team to deliver. The Golem network has been around since its ICO in 2016; however, it is still only at a ‘mid-term’ beta stage of development. On popular Dapp aggregator Stateofthedapps.com it is listed as being ‘prototype’ stage.
Because of the project’s high aspirations and apparent radio silence surrounding dates of tangible/market ready product delivery, GNT is beginning to send signals that it may be another ERC20 ‘futility token‘.
With price down ~86% from an all-time high achieved in early January, and major network updates still appearing to be a long way away based on official roadmaps, how long can remaining Hodler’s wait before selling prangs become too strong? Are they willing to potentially see out a few more years of sideways/bearish movements given the heavy cooling down of sentiment surrounding ICO and DApps, and long horizons for final product delivery?
The team behind Golem may also be facing similar doubts, recent figures suggest that the Golem project sits with a war chest of 369,023 ETH (worth over $75 million based on current prices), having already sold over 451,000 tokens. How much of these sales were for operational expenses versus panic liquidation is unclear. For reference, other Ethereum projects like Gnosis have sold much smaller percentages of raised ETH ICO earnings than Golem.
The challenge for utility tokens like Golem, which have underlying value as tools to participate in network operations, is that until their networks are fully operating the tokens are essentially useless.
This appears to have created significant selling pressure for a number of not-yet-there utility tokens like GNT and OMG. They do not have the security-like value of tokens like Binance coin (BNB), where value can be retained by leveraging the strong financial position of a connected organization.
Exchanges and Trading Pairs
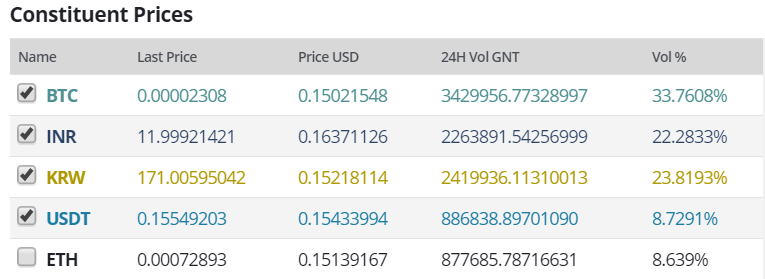
The most popular onramp onto GNT tokens is BTC. The BTC/GNT pair makes up over a third of the daily exchange volume within the Golem token market. 3 of the top 5 pairs are crypto-to-crypto, with USDT and ETH pairs also active within GNT markets. Interestingly, GNT shows strong popularity with Asian fiat pairs, particularly the Indian Rupee and Korean Won options. A potential explanation may be the appeal of a web 3.0 solution to the technology savvy retail customers.

The most popular exchange by single pair is Indian crypto exchange Buyucoin, that has been operating since 2016 and offers 30 digital asset trading options. Traders using the BuyUcoin platform should be aware of the significant premium trading the INR/GNT pair, ~10% vs the BTC/GNT option offered on international platform Binance (USD 0.164 vs USD 0.149). This may present some potential arbitrage opportunities to Indian traders.
The Golem network solution and the purpose of its token
The basic idea of the Golem ecosystem is that users loan out their computer’s spare resources, to other users who need the extra power to complete desired tasks. The projects value proposition is akin to business models like AirBNB, where underused resources are efficiently allocated because of an established monetary incentive.
A requestor (user who needs processing power to complete) broadcasts a task to the Golem marketplace, based off a set task template. There are currently two templates available in Brass, the current build of Golem, Blender and Luxrender. The templates focus on allocations to users seeking to participate in CGI rendering tasks.
This makes the current scope of the project very limited, however with future builds: Clay, Stone and Iron, the network will steadily become more accessible with greater functionality and consumer friendly interfaces. For the time being, the Golem team in Poland is taking a slow and steady approach to building an industry disruptive shared processing power solution.
A provider receives the broadcasted tasks via the Golem shop, it can view the reputation of nodes broadcasting tasks, rejecting ones with low reputation. When a provider finds a suitable offer, it sends computing power information to the requestor, and in return the requestor verifies that the the provider has a high enough reputation.
If everything checks out, the requestor receives the appropriate resources via the Interplanetary File System (IPFS) and begins computation on the task computer. An external task manager verifies the results with the respective nodes, and a requestor may choose to signal their results for further verification.
Payments are verified through a smart contract, with Golem transactions verified over the Ethereum blockchain. If all elements of the information and token exchange are verified, then both parties observe an increase in their reputation score, which leads to improved matchmaking across the network.
The GNT token is an ERC20 token operable within the Golem smart contracts, it is used to pay for the computing power you rent. As a provider you are free to set GNT rental price at your own discretion, it is hoped that the economic conditions of the open Golem marketplace of tasks will help regulate the price to fair level.
GNT also has utility as the token to participate in the Golem Application registry, an added feature of the network that lets developers publish their own Golem applications, and build features like more straightforward match-making between requesters and providers.
1,000,000,000 GNT tokens were issued during the ICO of which 82% was distributed to the crowd sale participants.
As mentioned earlier, the price of GNT is currently down 86% from an all-time-high achieved in early January 2018, and struggling for momentum. With general sentiment surrounding ICOs and Ethereum Dapps currently trending bearish, and the full utility of the token a long way from being fully functional/extending task templates to allow for resource sharing beyond activities linear activities like CGI rendering.
This may spell continued short-term pain for GNT hodler’s with potential upward price movements likely dependent on intangible news events like ‘Roadmap updates’, AMA’s and beta tests, which crypto markets in Q4 2018 are far more wary of, unable to generate the speculative price fuel they once did.
Do fundamentals backup the speculative movements?
NVT signal
The NVT signal, a responsive blockchain valuation metric, developed & tested by Willy Woo and Dmitriy Kalichkin was derived from the NVT ratio. With NVT signal, the simplified framework that crypto markets are prone to bubbles of speculative purchasing, not backed up by underlying network performance and activity, and the NVT signal gives off a signal for what stage of the price cycle a token may be in.
A high NVT signal is indicative of a network that is going through one of these bubble periods, and may move towards a position of becoming overbought/overvalued, because of the market’s speculative assessments running out of steam.
The historical NVT signal for Golem and GNT, particularly post Q2 2018, tell quite a surprising, unintuitive story. A sharp upward moving NVT signal generally comes with forward price momentum. It is normally indicative of speculative factors driving token value upwards, until on-chain volume catches up, gradually putting downward pressure on the NVT signal.
Or, more often the case in alt-coin markets, until an inflection point is hit, wherein the digital asset enters an overbought region and a short-term speculative bubble is popped, with price subsequently being pushed downwards.
Since 15/08/2018 NVT signal has ballooned straight upwards by over 523% crossing well into a historically indicated overbought region, over the same period price has risen by 23%, never crossing $0.20 level, and ranging tightly between ~$0.12 and ~$0.18.
As mentioned earlier, A rising NVT signal indicates a ratio where price is consistently winning out against onchain volume. With price barely moving, the indication is that onchain volume has deserted the network during this period.
Daily onchain volume (USD terms) on the 03/05/2018 was over 200 times more than it was on 10/10/2018. A decreasing onchain volume trend should not be the pattern for a blockchain project like Golem that is consistently working to improve the operability of the network.
The most recent major update to the network was introduced in August and appears to have driven minimal changes in network usage.This may mean external factors like the bearishness surrounding the general applicability & mainstream value of blockchain projects, is leading onchain volume away from Golem.
This narrative explains why NVT signal keeps rising irrespective of the middling price movements. There appears to be no room for an inflection point with price having already reduced significantly over the last 6 months, and without ochain volume to balance out the NVT signal ratio, it has kept rising.
If an inflection point is hit and NVT signal stops rising, GNT will eventually arrive at a new ‘overbought’ level. This may bring on an ever deeper price fall towards ICO price levels, and indicate that the market has fully lost faith in Golem’s ability to ever deliver a viable product.
This is a similar narrative to Arthur Hayes ‘double digit’ Ethereum sermon, which proposes that ICO and ERC20 speculators/investors bit off more than they could chew when pumping during the most recent crypto bull run, and now face a period of significant struggles as tokens battle to find utility and underlying value.
However, as mentioned earlier Golem remains a well funded project with significant remaining ETH holdings. The networks value proposition should develop over time. In the long run Golem may find its utility as decentralized power sharing supercomputer, but fundamentals point to more pain in the short run.
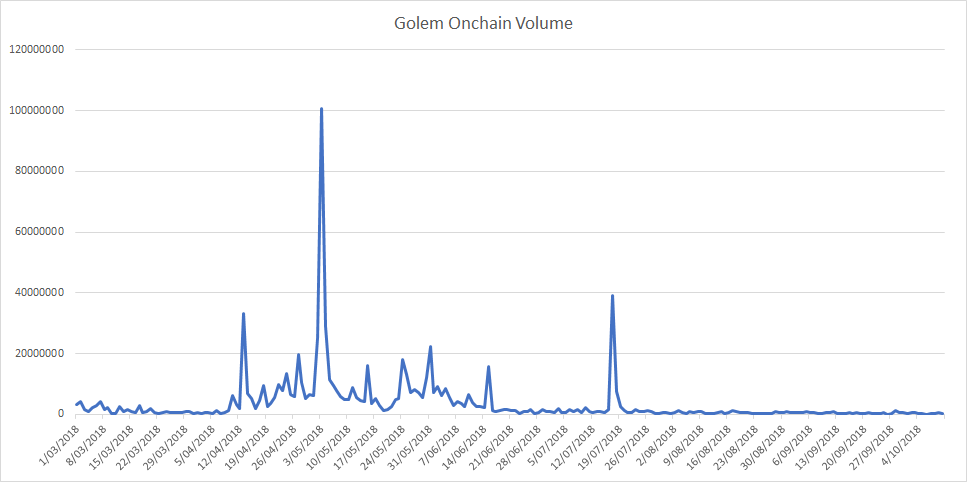
Figure 1: GNT historical Onchain Volume
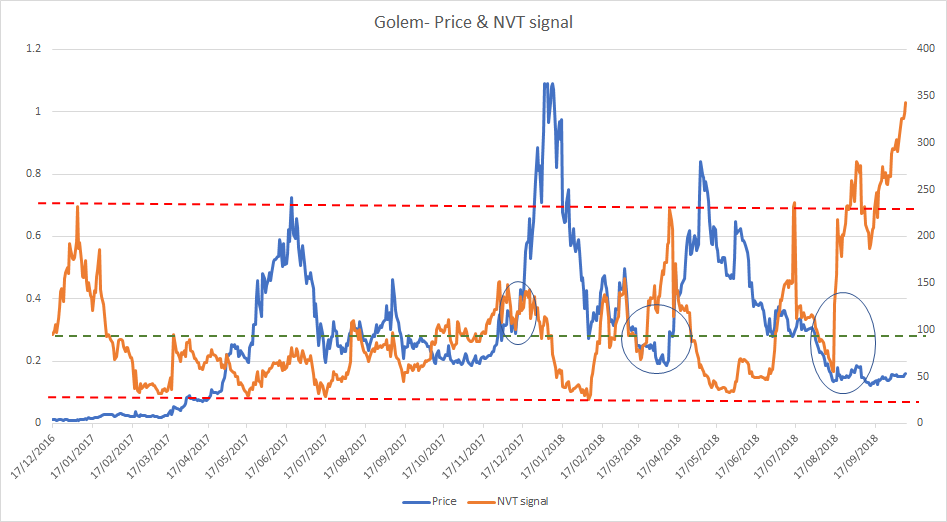
Figure 2: GNT historical NVT signal data. (NVT signal = Market Cap/onchain transaction volume, smoothed with 30 day MA, Overbought range >225, Oversold range <20, Mean : 95)
Onchain data sourced from Coinmetrics
Price to Metcalfe Ratio
Metcalfe’s law is a measure of connections in a network, as established by Robert Metcalfe the founder of Ethernet. It has subsequently been used to analyze the true value of network-based financial products like Facebook and Bitcoin, and by comparing it to price, can provide a useful tool to assess whether a token is over or undervalued.
It is also a more straightforward metric to implement versus onchain transaction volume, which can be challenging to measure accurately in USD terms. Coinmetrics.io measures addresses as ”the number of unique sending and receiving addresses participating in transactions on the given day.”
This makes it a relatively transparent metric as compared to onchain volume. However, there may be a question of the granularity of the data, and who controls these addresses.
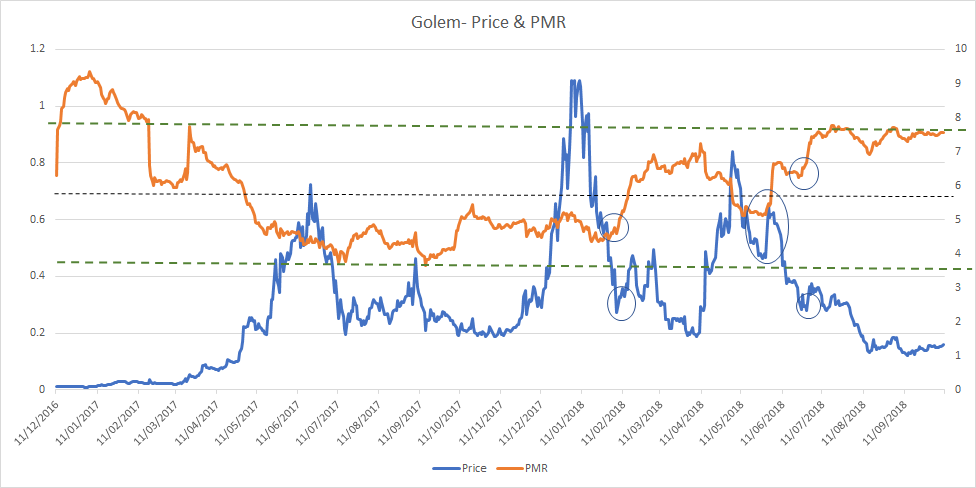
**(Fig 3. Kalichkin’s PMR or Price to Metcalfe, Natural log of Token value/Metcalfe Ratio. Meltcalfe Ratio = Active Addresses Squared, Overbought >7.6, Mean : 5.4) **
The PMR for GNT doesn’t quite tell the stark story that NVT signal does, currently the PMR signal appears to be approaching, but not yet shooting past, the indicated historical ceiling.
This means that there may still be some fundamental support from active addresses on the network that has pushed backed against negative speculation and allowed the token to retain some value.
In the past, as indicated by the circled sections on figure 3, an upward moving PMR has historically coincided with some upward price momentum.
Similar to NVT signal, in recent months the upward moving PMR signal has not coincided with upward price momentum as it normally should (until an inflection point is reached). The PMR signal hovering around the ~7.7 level over the last few months may indicate that there is a base of users actively participating in the network despite the falling price.
It may indicate that there is a base of users retaining fundamental belief in the network, despite the long timeframes and current lack of utility within the GNT token.
This tells a slightly different story to the NVT signal, where there appears to have been an exodus of onchain volume. For believers in the Golem project, the indicator that active addresses/network connections are putting some upward pressure on price may be a signal of long-term support once the network begins to fully deliver on its proposed utility.
Technical Analysis
Long-term trends
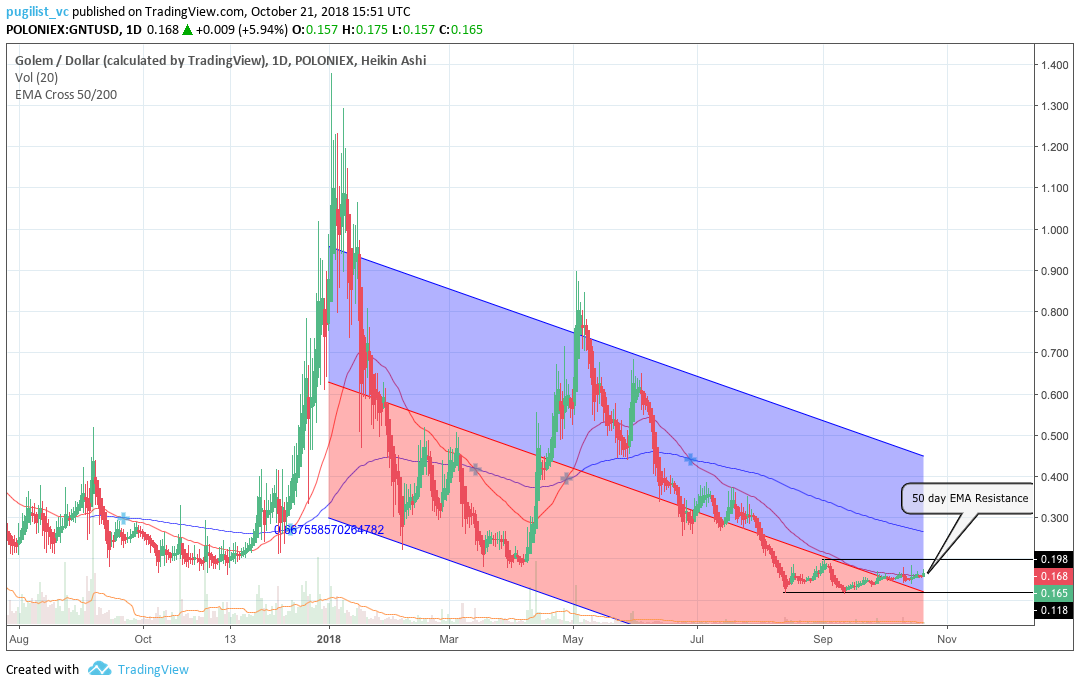
In 2018, the price of GNT has been consistently bearish visualized by a negative linear price trend with a Pearson R correlation coefficient between time and price of 0.67, on the 1 day chart. Additionally, despite several golden cross attempts in 2018, the death cross has persisted since late June, and the 50 day EMA (red line) is currently acting as price resistance. GNT is currently sitting at ~$0.17 and appears to be basing out above the average trend path, and looking for a breakout direction.
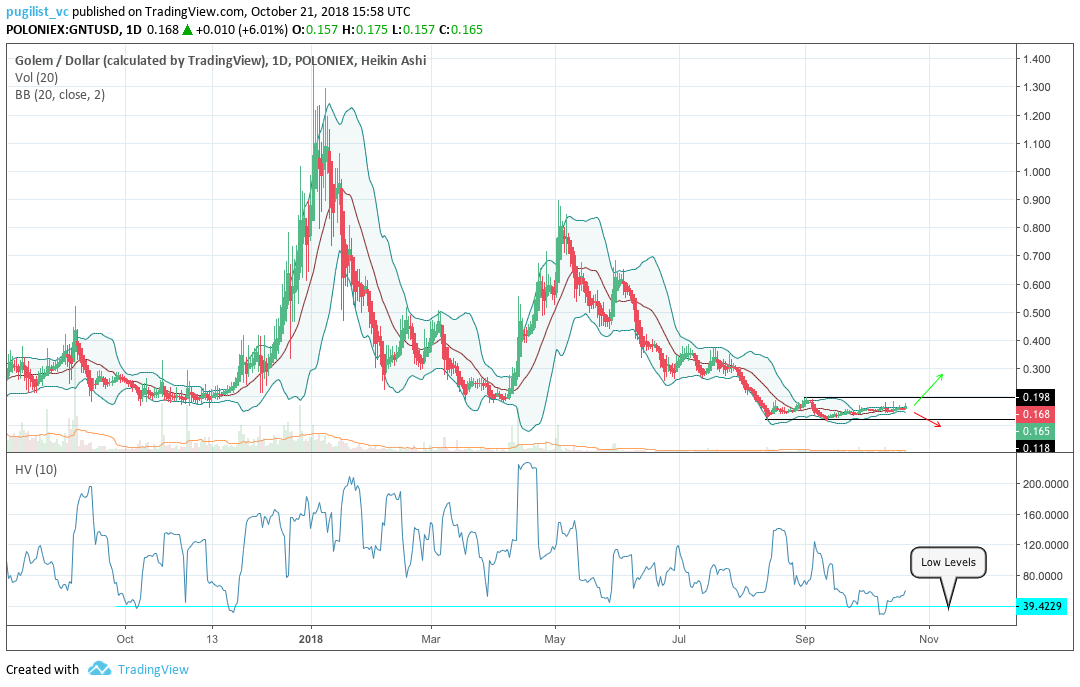
Additionally, price volatility for GNT has been diminishing since mid-August, visualized by the compressing bollinger bands and declining historical volatility (blue line). Compression typically precedes a price breakout. Currently, price is confined within a trading range between $0.12 and $0.20 (black lines). Given the high market dependence on bitcoin (BTC), coupled with the 0.49 correlation between BTC and GNT in 2018, the success of a positive breakout, largely hinges upon the price movement of BTC over the coming weeks, probabilistically speaking.
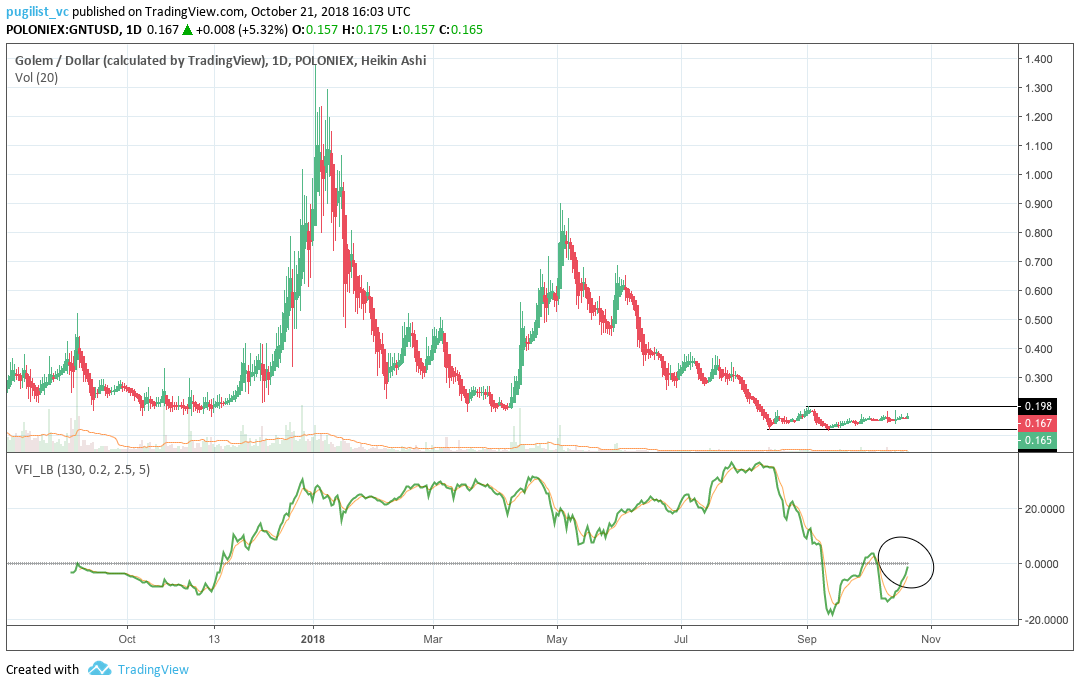
Lastly, the volume flow indicator (VFI) fell below 0 in early September 2018 and has struggled to regain that level ever since. Currently, price is attempting to break above 0 (black circle). Price successfully breaching and holding above 0 might be the key to whether GNT breaks out positively or not. If the VFI breaks above 0 and holds, while price is still confined within the trading band, this may be a leading indicator that a positive breakout is imminent. The VFI interpretation is: a value above 0 is bullish and below 0 is bearish, with divergences between price and oscillator being high probability signals.
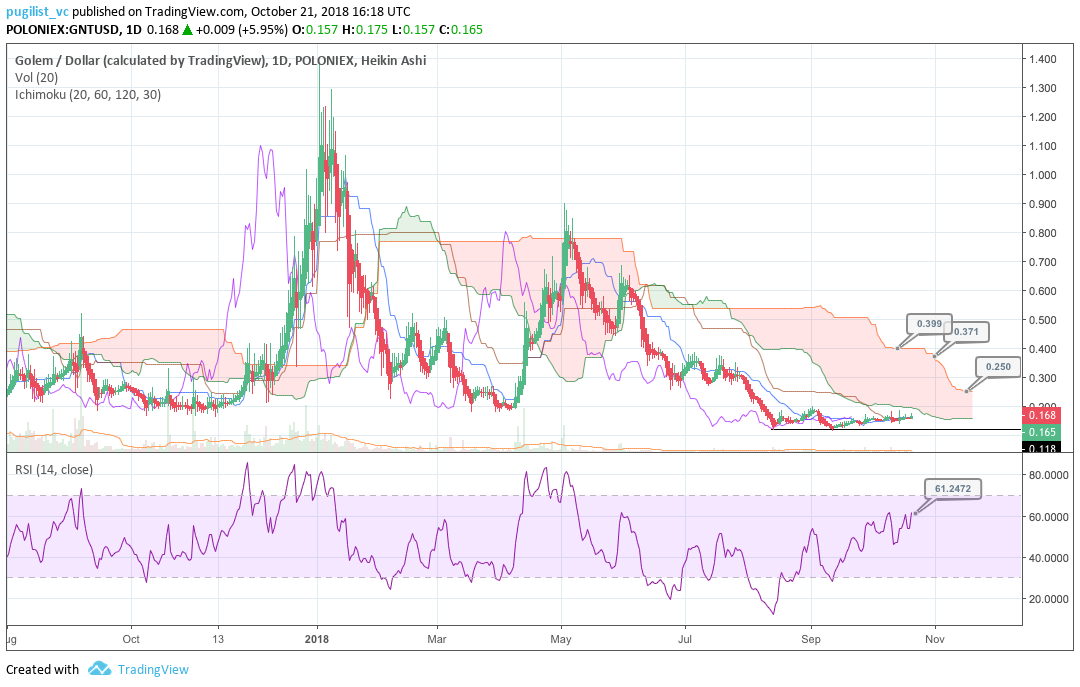
Ichimoku Clouds with Relative Strength Index (RSI)
The Ichimoku Cloud uses four metrics to determine if a trend exists; the current price in relation to the Cloud, the color of the Cloud (red for bearish, green for bullish), the Tenkan (T) and Kijun (K) cross, Lagging Span (Chikou), and Senkou Span (A & B).
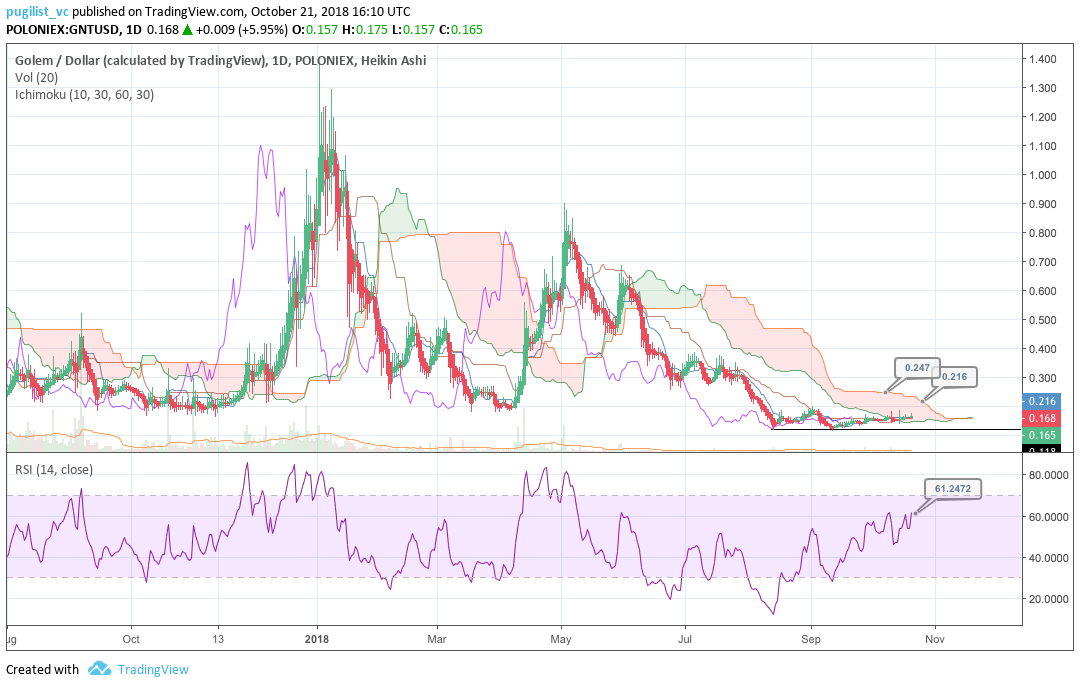
The status of the current Cloud metrics on the 1 day time frame with singled settings (10/30/60/30) for quicker signals is mixed; price is in the Cloud, Cloud is bearish, the TK cross is bullish, and the Lagging Span is below the Cloud, but above price.
A traditional long entry would occur with a price break above the Cloud, known as a Kumo breakout, with price holding above the Cloud. From there, the trader would use either the Tenkan, Kijun, or Senkou A as their trailing stop.
GNT is currently sitting at ~$0.17 and attempting a Kumo breakout. The RSI is nearing overbought territory around 61, which may spell trouble for the breakout attempt as it moves closer towards 70. Given the compressed volatility and range trading, a successful Kumo breakout is probabilistically low currently. The support levels for price are $0.147, $0.12, and $0.10; while price targets for a successful Kumo breakout (breaking above $0.21) are $0.22 and $0.25.
The status of the current Cloud metrics on the 1 day time frame with doubled settings (20/60/120/30) for more accurate signals is bearish; price is below the Cloud, Cloud is bearish, the TK cross is bullish, and the Lagging Span is below the Cloud and above price.
As mentioned, GNT is currently sitting at $0.17 and looking for a Kumo breakout attempt. Using the slower Ichimoku settings, the probability for Kumo breakout success is much lower than the faster settings. In the unlikely event of a successful Kumo breakout, price will need to breach $0.25 with price targets of $0.37 and $0.40.
Conclusion
Despite being a project that is still only at early/medium stage of a product delivery lifecycle, the Golem project and its native token, GNT, have been through a volatile, speculation-driven valuation history.
A rapid, surging price bubble emerged in late 2017/early 2018, which has since popped, triggering an extended period of downward price momentum. NVT signal indicates that network activity has fallen even deeper than price.
While at a qualitative level, the lack of current utility within the token and no security/dividend style value to fall back on, GNT appears set to face more short-term selling pressure.
However, the Golem project has a strong team and sizeable funding backing its future, the token may yet prove doubters wrong and begin delivering on its exciting value proposition in the future; until then however, it maintains the tag of ‘futility token’.
The long-term technicals for GNT are bearish and show few signs of abating when looking at linear trends, 50-day EMA resistance, and Ichimoku Clouds. A potential price breakout upward is still possible given the compressed volatility and range trading, but less probable. Both the prudent short-term trader (10/30/60/30) and longer term trader (20/60/120/30), on the 1 day chart, will await a positive TK cross and Kumo breakout above $0.21 and $0.25, respectively, before entering a long position. Both trader’s support levels are $0.147, $0.12, and $0.10. Additionally, the (10/30/60/30) trader’s price targets are $0.22 and $0.25, and the (20/60/120/30) price targets are $0.37 and $0.40.
 Brave New Coin reaches 1M+ engaged crypto enthusiasts a month through our website, podcast, newsletters, and YouTube. Get your brand in front of key decision-makers and early adopters in 2026. Limited slots remaining! Find out more today!


