Gold Price Analysis October 2026 as Fed Decision Puts Key Support at Risk

The top-of-the-queue decision from the Fed on Oct. 28 will be the main trigger, and interest-rate expectations will likely be a factor in the dollar, Treasuries, and precious-metal demand.
Gold is getting close to a technical crossroads in November. XAU/USD has suffered a significant pause from its record-high gains this year and is currently at a support level, which may be its next target.At press time, gold traded at $4,019.805, above the $3,978.180 low and 0.60% higher on the candle displayed. With this in mind, the $4,000 psychological level is now at the center of the current battle. But a modest recovery this week is no indication sellers have taken control.
Analyst Trading Identifies a Critical Support Test
Meanwhile, the analyst at Cheds Trading pronounces gold to be “right on the cusp of” support in the X post.
Bollinger Bands also expand when the price declines, indicating greater price volatility during the sell-off period.
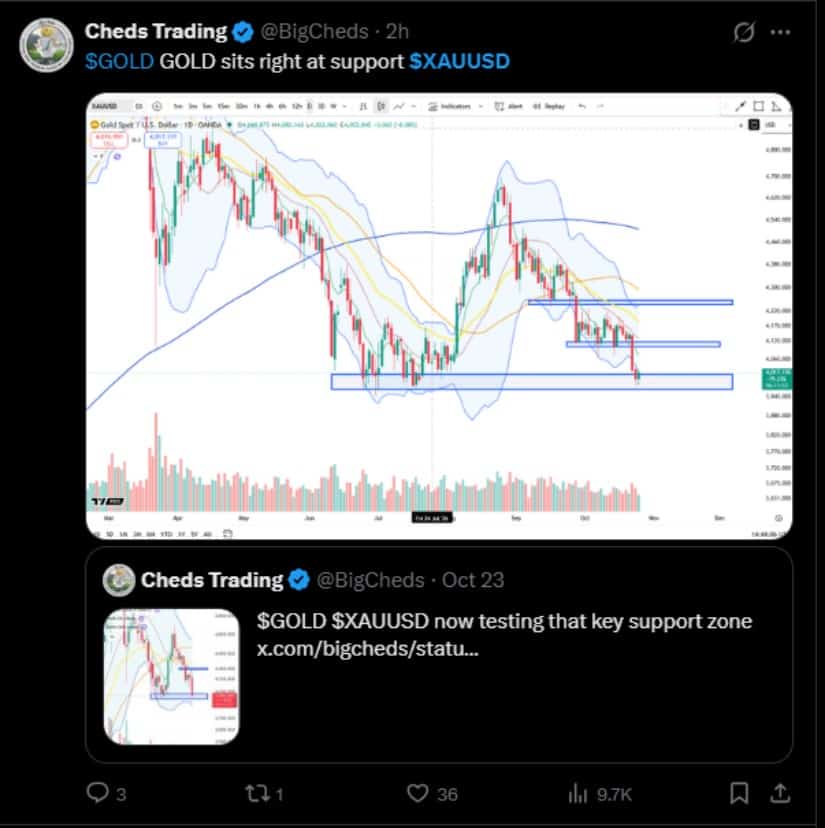 The chart below displays price moving towards an obvious horizontal price support level and down from each higher high. Source: Cheds Via X
This structure is important since it is being tested after a prolonged period of downtrend. If the buyers do not back off from the low blue zone, then gold may try to come back in a relief move. If it breaks below, the chart indicates that the previous support area could also serve as resistance when the market recovers.
October’s Pullback Puts $4,000 in Focus
Notably, there are now three levels for a practical framework. First, $3,978 is the latest weekly low and the immediate downside reference. Second, the $4000 is a psychological barrier that buyers must overcome. Thirdly, $4,030 is the new candle high and the first hurdle to recover.
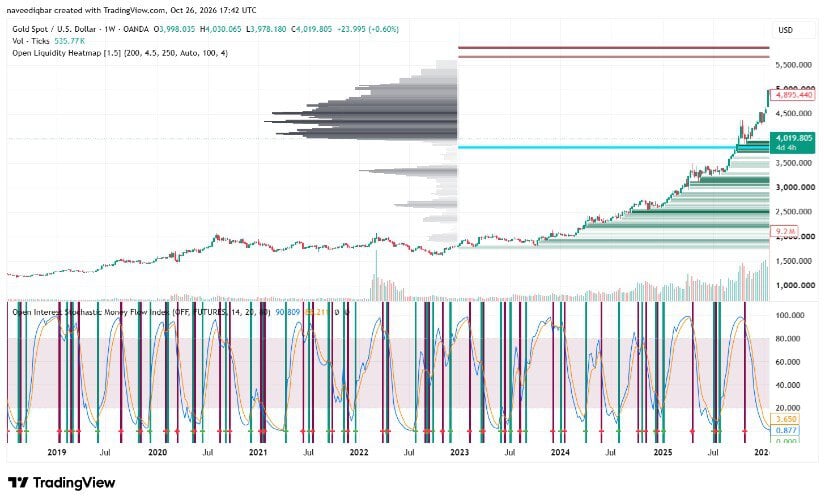 The most recent candle has been between $3,978.180 and $4,030.065, and, in the most recent correction, gold has been nudging closer to $4,000. Source: TradingView
The chart also shows some steep gains between 2024 and 2025 and then a significantly faster move in 2026.
If the price breaks above $4,030, it would indicate short-term buying, but in itself it would not prove a trend reversal. If $3,978 is broken, the bull market narrative may be weakened, and the price of gold could continue to fall. The liquidity heatmap on the chart indicates historical price levels, but they are not price levels that can be confirmed.
October 28 Fed Decision Is the Main Catalyst
Meanwhile, the FOMC will hold its next meeting on Oct. 27-28 and make its policy decision on Oct. 28. Investors can check the timing on the official calendar set up by the Federal Reserve.
Market sources indicate the move is being watched not only by the market but also for guidance at the next meeting. A hawkish message could strengthen the dollar and push up Treasury yields, raising the opportunity cost of holding gold. That would drive up the price of gold and silver futures if investors curb holdings of non-yielding investments.
Often, a more benign view would fuel an underperformance of the dollar and yields, possibly aiding precious metals. Financial conditions may also be getting easier for bitcoin, but crypto prices are still sensitive to positioning and overall risk appetite. Lithium futures and contracts could react to growth shifts but will also be influenced by battery demand and inventories and supplies.
What Investors Should Watch Before November
The first question is whether gold can sustain this 3,978–4,000 range as the Fed announcement comes. A bounce from $4,030 would support near-term bulls, but a significant move below the recent low would boost the prospects for more weakness. Investors also should keep an eye on the dollar and Treasury yields for further confirmation and not use the Fed announcement as a signal to buy or sell.
Any weekly price action below $3,978 would be a null setter of the prevailing interpretation of gold holding support, especially with a hawkish Fed signal and the dollar and Treasury yields rising.
Frequently Asked Questions
1. What is significant about the Fed decision on October 28 for gold?
It has the potential to alter expectations with respect to future interest rates and impact the dollar, Treasury yields, and demand for non-yielding assets.
2. What is the most important level for gold now?
The weekly chart presented here focuses attention on 3,978-4,000, the current shown low, and the psychological $4,000.
3. What does Cheds Trading’s chart suggest?
Notice the shared chart with a downtrend of highs and a price test around a significant support level. A breakdown would impact the bullish support argument; a hold may mean that a recovery is possible.
4. Will a milder Fed performance be good for Bitcoin and silver?
Potentially. As lower rates and yields continue to be expected, precious metals and risk appetite should be supported, but there is no guarantee that either asset will rise.
5. What would indicate even more weakness in gold?
If the weekly chart closes below $3,978, the current support interpretation could be considered invalid. Without a break, it is impossible to set a price range for the price movement.
 Brave New Coin reaches 1M+ engaged crypto enthusiasts a month through our website, podcast, newsletters, and YouTube. Get your brand in front of key decision-makers and early adopters in 2026. Limited slots remaining! Find out more today!