Gold Price Prediction as $4,067 Support Faces Test Ahead of December Rally

Gold is facing a critical technical hurdle in its recovery, as buyers try to hold onto the support level above $4,000.
The precious metal has rallied to its $4,100 range, but current selling activity has put the recovery path at the mercy of a new price floor. Traders are keeping a close watch on nearby support or lack thereof heading into the U.S. inflation data.
In the meantime, gold is set to move next with the help of technical levels, which were identified by analyst James Stanley. The $4067 and $4021 levels may decide if the recent rally can turn into a more substantial recovery this month as it heads into December.
Gold Faces Further Downside Pressure as Fed Rate Hike Bets Strengthen
Gold prices continue to be weighed down by dropping to $4,047.10 an ounce following tougher-than-expected U.S. inflation data and Federal Reserve comments that were hawkish. Gold fell $79.70 or 1.93% to approach its lowest levels since November, as depicted on the Trading Economics chart.
It has also lost significant ground from its January highs above $5,400, in a trend that has seen the price of the metal fall over the majority of 2026. The move on Tuesday adds to the bearish sentiment, as investors reevaluate the Fed’s interest rate trajectory.
Meanwhile, US inflation data have bolstered expectations for monetary policy tightening. Headline inflation slowed to 0.4% month-on-month in October from 0.6% in September but remained above the 0.3% market forecast. Inflation excluding core foods remained steady at 0.3% for the third month in a row, up from an anticipated rate of 0.2%.
The underlying price pressures continue to persist, meaning that the Federal Reserve is having trouble finding any room to consider monetary easing, according to these figures. Support for another rate hike increases pressure on gold, with Christopher Waller suggesting a 50-basis-point move in December.
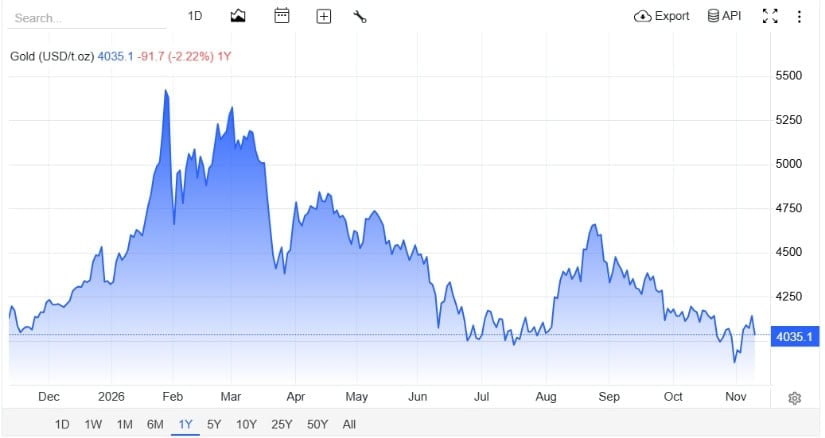 From a technical standpoint, gold has immediate support at the $4,000 level and could break further to reveal lower support levels. Source: TradingEconomics
It indicates that the price has failed to make any new bullish gains above the $4200 level since September. Sellers may be able to recover at $4,100 to $4,200, where resistance is found. But if the strike continues to hold above this area, it will offer some short-term relief. The bullion’s price is still being held by high interest rate prospects and inflationary pressures for the time being.
$4,021 support and $4,000 remain important downside levels
Analyst James Stanley marked $4,067 as support that is nearby and $4,021 below that. These levels provide two important areas for monitoring selling pressure. If gold can hold up on the defense of $4,067, it’s likely to be able to try to recover again. Buyers would have to generate more upward movement to confirm that the demand is returning.
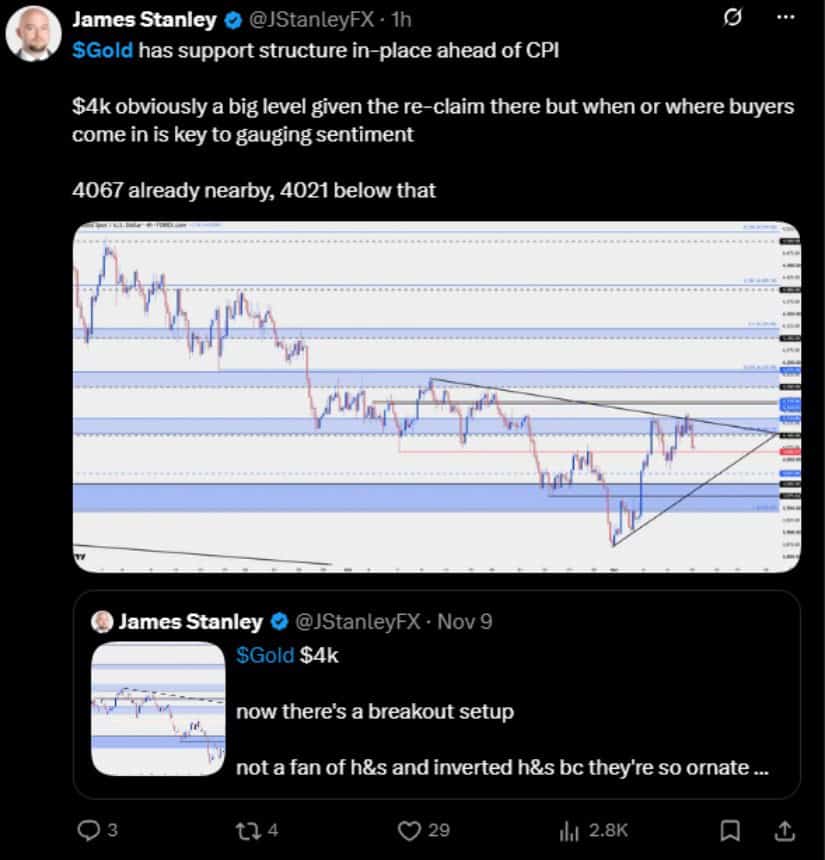 The gold price is coming back from a previous dip and is nearing a downward-trending line, as seen in Stanley’s chart. Source: Stanley Via X
But if prices continue to fall below $4,067, the $4,021 area may be vulnerable. This would bring gold nearer to a psychological $4,000 level. The level of the round number is technically important also, as $4,000 was also one of the important reference points previously recovered by Stanley. If there is a breakdown below this region, then the current recovery structure will be weakened.
An earlier period of price declines is also reflected in the chart before the most recent price increases. During that sell-off period, gold was under pressure but has bounced from its recent lows. This means the existing support level should be confirmed by a string of purchases.
A recovery from such a move is likely to be accompanied by a downward move below the support level, which suggests that buyers are taking on the selling pressure that is present. On the other hand, if it persists, it means that the seller is still in control.
Descending resistance creates a breakout setup
A descending resistance line is formed by the X chart, as it indicates a trend of a few lower highs. This is a structure that shows the selling pressure that has taken place after gold’s previous drop. In the meantime, an upward-sloping support line has formed from the recent recovery lows. The two “boundaries” are coming closer together and may set up a breakout opportunity as November goes on.
A breakout to the upside in descending resistance would be a good sign the market is buying. But the breakout would need to be a continuous trade up and not a mere spike above resistance. Then nearby resistance zones need to be broken up, and higher swing highs need to be formed in order for Gold to make a comeback. If that happens, it could bolster the technical argument for a recovery in December.
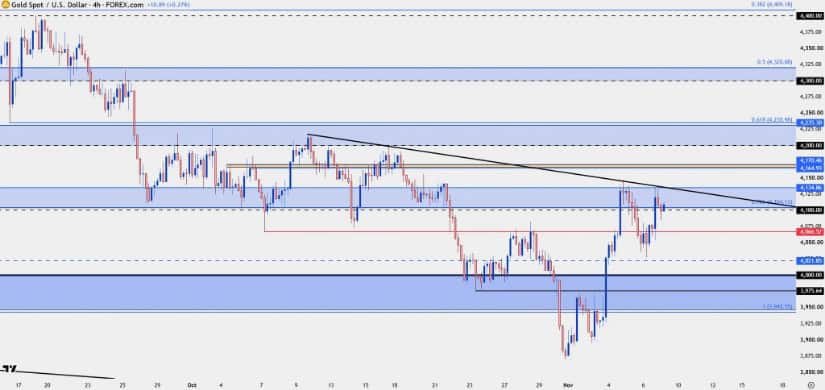 In his previous analysis, Stanley has mentioned the $4,000 price point. It is a significant milestone after the gold rally, he said. Source: X
But if the price declines in rejection, it may signal that the price has begun another consolidation pattern. Gold could be heading towards $4,067 before reaching $4,021. Further breakdown from the rising support level would further undermine the recovery structure. So, the trend of the upcoming breakout may offer a better guide to what price action may look like in December.
 Brave New Coin reaches 1M+ engaged crypto enthusiasts a month through our website, podcast, newsletters, and YouTube. Get your brand in front of key decision-makers and early adopters in 2026. Limited slots remaining! Find out more today!