Hyperliquid (HYPE) Price Prediction: Could a Falling Wedge Breakout Send HYPE Above $90?

Hyperliquid (HYPE) is approaching a critical technical zone as traders assess whether its recent correction will extend toward $75 or give way to a recovery above $90.
Several Hyperliquid price analyses identify a potential bullish reversal, but the token still faces resistance that must be cleared before an upward move can be confirmed.
The immediate focus is on the $79.40–$82.50 resistance range, where a breakout could strengthen the recovery outlook. Meanwhile, support around $76.55–$78 and the broader $75 area remains important as HYPE trades below its September peak near $98.
HYPE Price Prediction: Falling Wedge Signals a Potential Reversal
A one-hour chart analysis by TradingView contributor Rendra_Azrulsyah identifies a falling wedge within a descending channel. The pattern reflects a market in which price continues to make lower highs and lower lows, but the distance between the trendlines gradually narrows. A breakout above the upper trendline can signal a potential reversal, although confirmation is necessary.
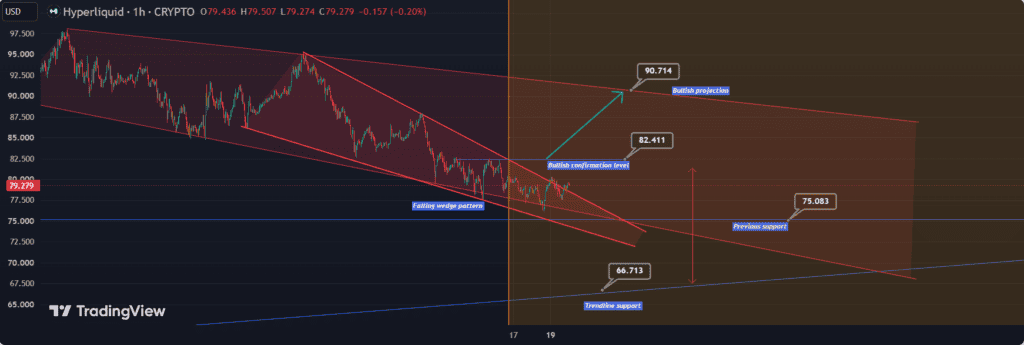
A confirmed breakout above $82.411 could trigger a bullish reversal, targeting $90.714 or the next swing high. Source: Rendra_Azrulsyah on TradingView
The analysis identifies $75.083 as a potential downside target if selling pressure persists. On the upside, a confirmed move above $82.411 would strengthen the bullish scenario, with the next target near $90.714 at descending-channel resistance.
The $82.411 level is therefore an important threshold for the Hyperliquid price prediction. Until HYPE breaks above that resistance, the falling wedge remains a potential reversal setup rather than evidence that the correction has ended.
Hyperliquid Faces Key Support Near $75
A separate daily-chart analysis places the current correction within a broader rising channel. This suggests that the short-term weakness has not necessarily invalidated the larger upward structure.
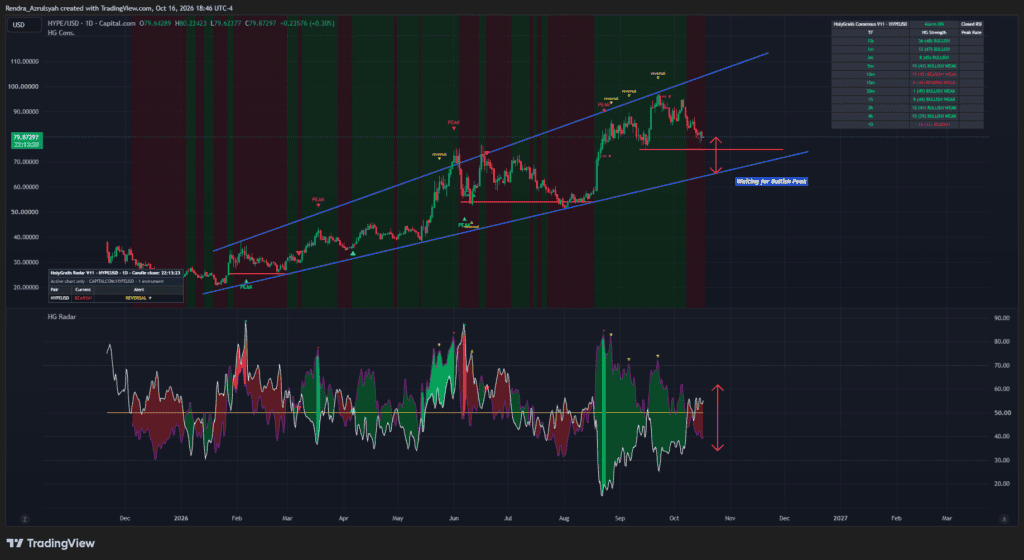
HYPEUSD faces downside risk toward $75 and the rising channel’s lower boundary, with a confirmed bullish peak near support needed to signal a potential recovery toward previous highs. Source: Rendra_Azrulsyah on TradingView
The strategy outlined in the analysis calls for a confirmed bullish peak near support before considering a new long position. Such confirmation could indicate that buyers are regaining control after the pullback. A subsequent recovery toward previous highs and the upper boundary of the rising channel would then become a possible scenario.
However, a sustained decline toward $75 or the lower channel boundary would increase the risk of a deeper correction. Traders will need to monitor price reactions around support rather than assume that the broader uptrend guarantees a recovery.
Recent market data reinforces the importance of these levels. CoinGecko’s historical records show that HYPE closed at $94.15 on October 5 before falling to $79.19 on October 19. That decline places the token well below its early-October highs and highlights the selling pressure that bulls must overcome.
Can HYPE Break Above $80 and Target $98?
TradingView contributor RLinda’s analysis identifies a potential end to Hyperliquid’s countertrend correction, with a recovery dependent on a breakout from the current corrective structure.
The analysis lists $79.40 and $80 as initial resistance levels, followed by $82.50. A sustained move above $80, combined with a breakout above the wedge resistance, could provide an early indication that buying momentum is improving.
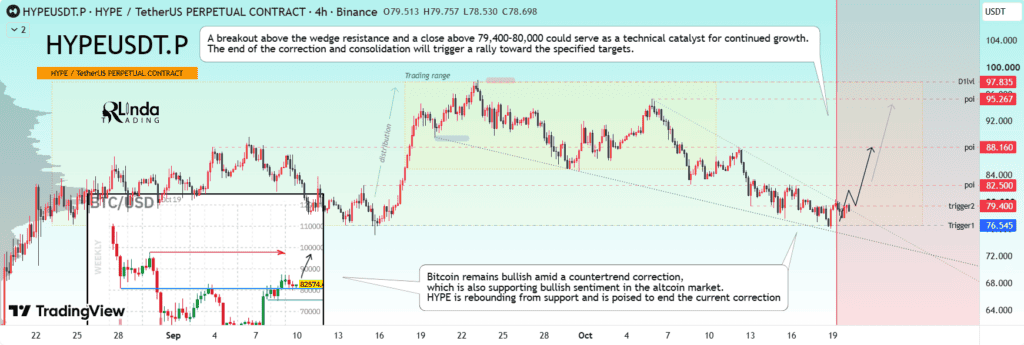
A breakout above wedge resistance and the $79.40–$80.00 zone could confirm the end of consolidation and trigger further upside toward the projected targets. Source: RLinda on TradingView
The next upside targets are $88 and $98. The latter would bring HYPE back toward its September peak, according to the supplied market analysis. However, reaching that level would require the token to clear several resistance areas rather than move directly higher.
On the downside, RLinda identifies $76.55 as support. A break below this level could weaken the immediate recovery setup and bring the $75 area back into focus.
The analysis also suggests that a confirmed breakout could trigger short liquidations and encourage new long positions. In leveraged markets, short liquidations occur when traders betting on falling prices are forced to close their positions as prices rise. These forced purchases can accelerate an existing upward move, although the effect depends on market positioning and available liquidity.
Hyperliquid Liquidity Heatmap Highlights $78 and $85
Liquidity levels are another factor shaping the near-term HYPE price prediction. Trader MookieNFT highlighted potential liquidation clusters around $78 below the market and $85 above it using a Coinglass liquidation heatmap.
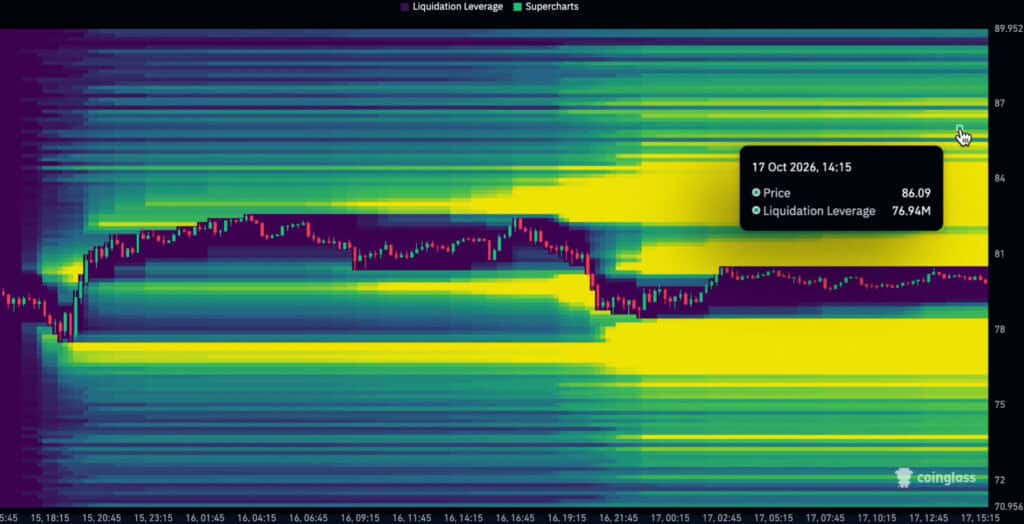
The HYPE liquidation heatmap highlights major liquidity clusters at $85 above and $78 below, leaving the next price move dependent on which level gets tested first. Source: @MookieNFT via X
These zones matter because leveraged positions can become vulnerable when prices approach areas containing concentrated liquidation levels. A move toward $78 could put some leveraged long positions under pressure, while a rally toward $85 could challenge short positions.
However, liquidation heatmaps are estimates of potential liquidation concentrations, not guarantees that the market will reach a particular price. Their readings also depend on assumptions about leverage, position distribution, and market conditions.
With HYPE trading around $79 in the latest available October 19 closing data, both levels remain relevant to the near-term outlook.
A break above $85 would place the token closer to the $88 and $90.714 targets. Conversely, a decline toward $78 could expose the lower support range before a meaningful recovery develops.
HYPE Price Forecast: Could a Retest of Recent Lows Precede a Rally?
Crypto trader AltCryptoGems has outlined another bullish possibility: HYPE could revisit a recent low before establishing a higher high and moving into what traders often describe as “blue sky” territory.
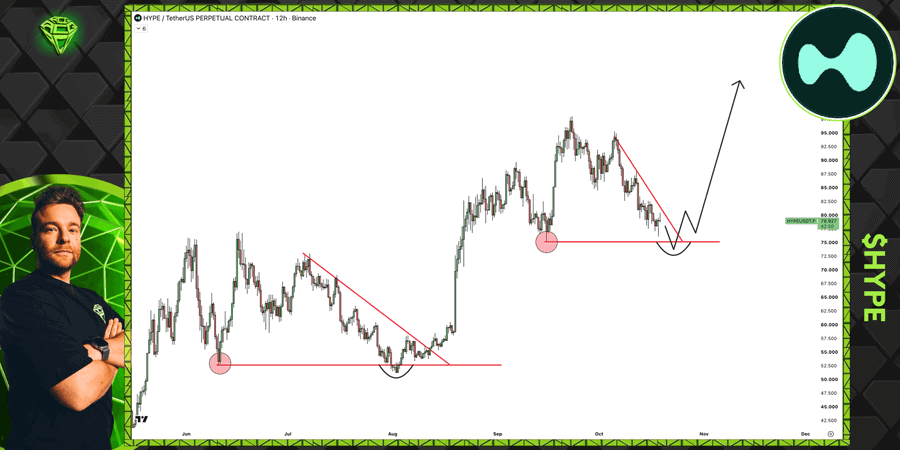
The chart highlights support near $55K and $78K, with an upward projection suggesting potential bullish continuation toward December. Source: @AltCryptoGems via X
That scenario anticipates a final period of weakness before the market resumes its upward trend. However, the projection remains a trader’s interpretation of the chart, not a confirmed market signal. A retest of support would need to be followed by stronger buying activity and a break above relevant resistance to validate the bullish outlook.
The broader market environment could also influence the outcome. RLinda’s analysis points to Bitcoin’s price structure as a factor supporting sentiment across the altcoin market. If Bitcoin remains stable or strengthens, it could help sustain demand for selected altcoins. A broader market decline, however, could undermine Hyperliquid’s recovery regardless of its individual chart pattern.
Macro and Asset Outlook
Hyperliquid operates as a layer-1 blockchain designed for on-chain financial markets. Its HyperCore component supports fully on-chain perpetual futures and spot order books, while HyperEVM provides a general-purpose smart-contract environment. According to the project’s documentation, orders, cancellations, trades, and liquidations on HyperCore are processed transparently on-chain.
This market structure makes trading activity and leveraged positioning relevant to HYPE’s price behavior. Nevertheless, short-term technical patterns should not be confused with evidence of changes in the network’s underlying adoption or fundamentals.
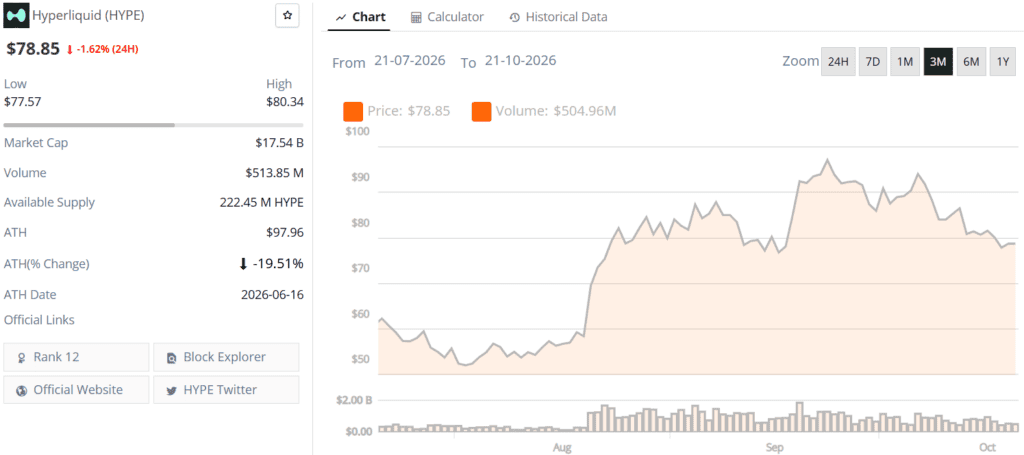
Hyperliquid (HYPE) price chart. Source: Brave New Coin
For the immediate outlook, the key question is whether buyers can reclaim the $80–$82.50 resistance range. A confirmed breakout above $82.411 would strengthen the case for a move toward $88 and potentially $90.714. A subsequent advance toward $98 would require further confirmation.
If HYPE fails to overcome resistance, support around $78, $76.55, and $75 will remain important. A breakdown through these levels would weaken the bullish reversal thesis and increase the risk of an extended correction.
The outlook remains conditional: a falling wedge offers a possible path toward $90, but confirmation above resistance is essential. Until that happens, the possibility of another test of lower support remains part of the Hyperliquid price prediction.
 Brave New Coin reaches 1M+ engaged crypto enthusiasts a month through our website, podcast, newsletters, and YouTube. Get your brand in front of key decision-makers and early adopters in 2026. Limited slots remaining! Find out more today!