Pudgy Penguins (PENGU) Price Prediction: Bullish SuperTrend Flip Signals Potential 70% Rally to $0.013
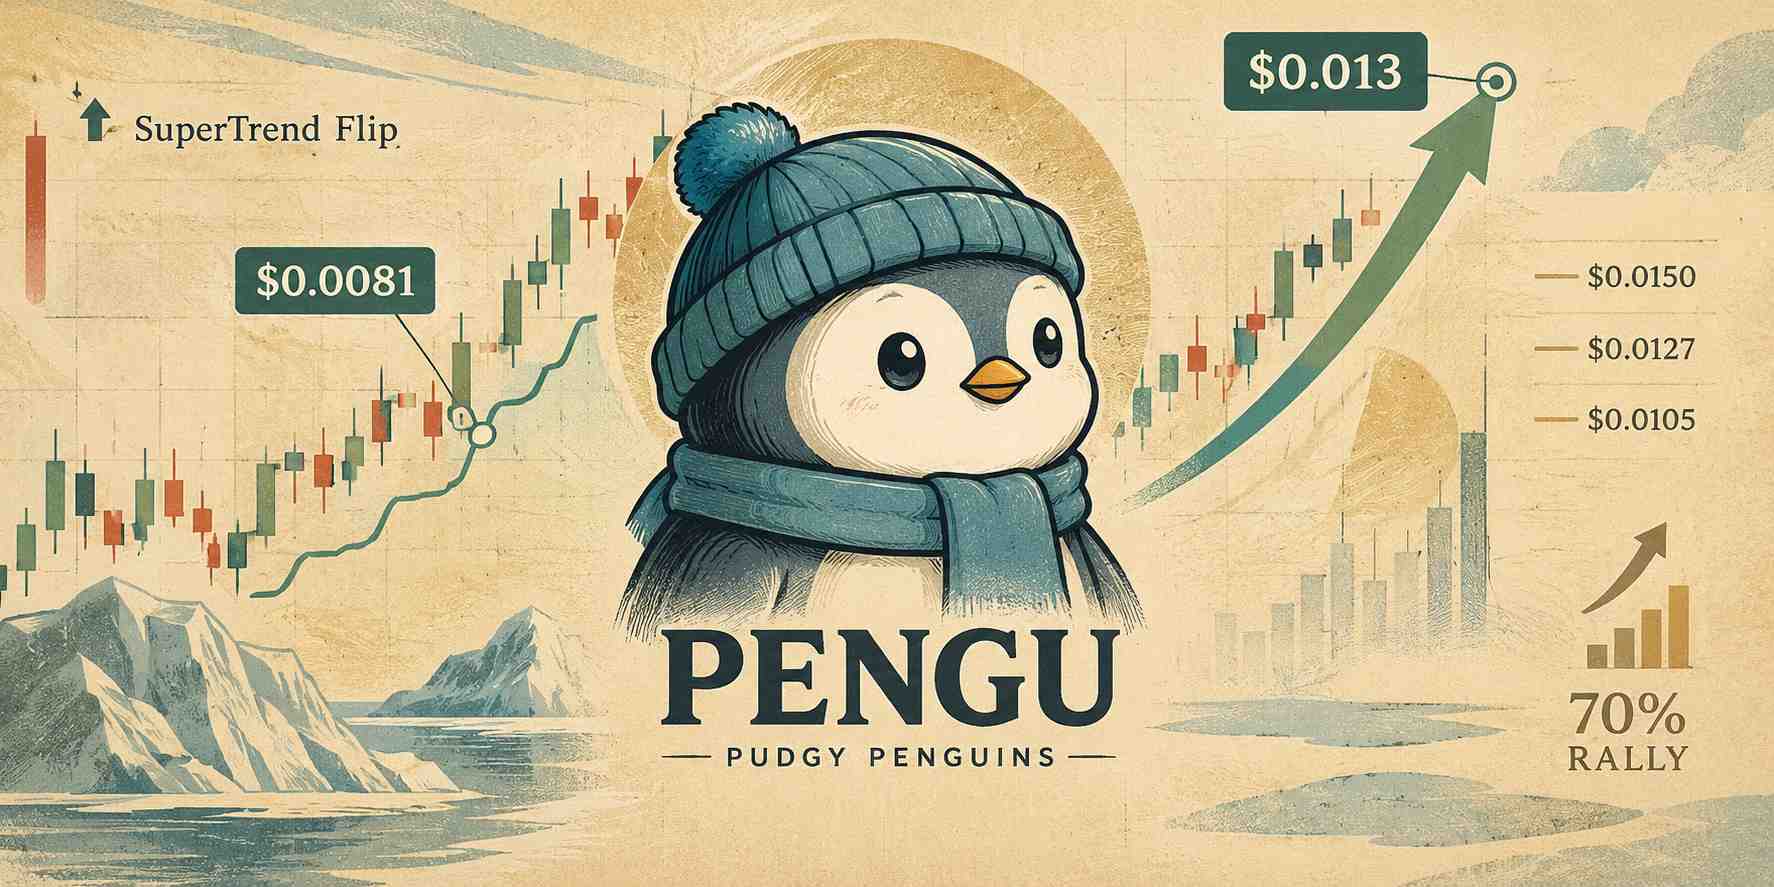
Pudgy Penguins (PENGU) is showing a fresh bullish signal on its 12-hour chart, drawing attention to a possible recovery toward $0.013.
The technical setup comes as PENGU trades near $0.0081 and approaches a key breakout zone.
Crypto analyst Ali Charts highlighted a bullish SuperTrend flip, noting that previous changes in the indicator’s direction had coincided with rallies and corrections. However, the signal does not guarantee another advance, and PENGU must overcome several resistance levels before a sustained recovery can be confirmed.
PENGU SuperTrend Flip Raises Bullish Price Prediction
Ali Charts identified the bullish SuperTrend signal as PENGU moved above $0.0081. The indicator is commonly used to assess market direction by comparing price action with a volatility-based trend line. A bullish flip can indicate improving momentum, while a bearish flip may signal weakening price conditions.
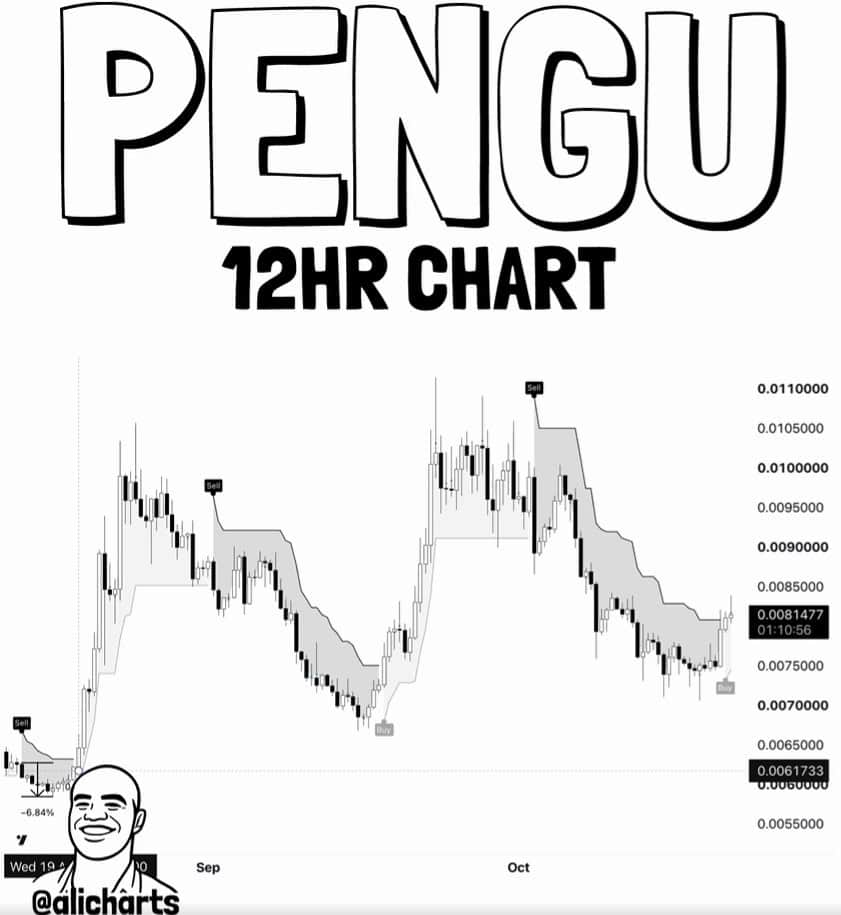
PENGU’s 12-hour chart shows a bullish SuperTrend flip above $0.0081, signaling potential upside based on the indicator’s historical trend-reversal signals. Source: @alicharts via X
The analyst also referred to an earlier TD Sequential analysis that identified buy signals preceding gains of 77% and 67%. A previous sell signal was followed by a 32% decline according to the post. These historical moves provide context for the latest signal, but they do not establish that PENGU will repeat the same performance.
Based on the possibility of another rally of roughly 70%, the analyst pointed to $0.013 as a potential upside target. From a price near $0.0081, that level would represent an increase of approximately 60%, rather than a full 70% gain. A 70% advance from $0.0081 would put the token near $0.0138.
The distinction matters because technical targets depend on the precise entry price and the size of the projected move. Traders will also need to monitor trading volume, resistance, and broader cryptocurrency market conditions to assess whether the bullish signal is gaining strength.
Symmetrical Triangle Puts PENGU Breakout in Focus
A separate TradingView analysis by CryptoNuclear identifies a tightening symmetrical triangle on PENGU’s four-day chart. The pattern has developed as the token records lower highs while maintaining progressively higher lows, narrowing the range in which it trades.
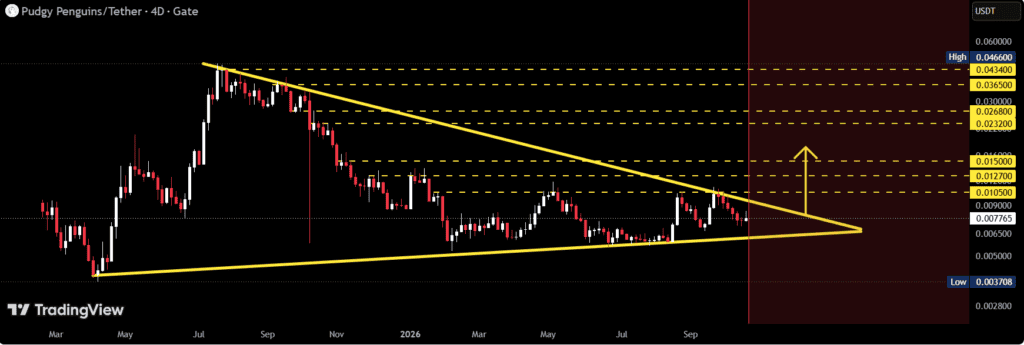
PENGU has formed a symmetrical triangle since peaking near $0.0466, with lower highs and rising support compressing the price range toward a potential breakout. Source: CryptoNuclear on TradingView
The structure reflects a market in which sellers continue to limit upward moves, while buyers attempt to defend higher support levels. As the two trend lines converge, the token approaches a point where a decisive move may become more likely. The pattern alone, however, does not indicate which direction the breakout will take.
PENGU previously reached a peak near $0.0466 before entering a prolonged decline and consolidation phase. With the token trading around $0.0081 in the supplied chart analysis, a recovery would need to overcome several overhead resistance zones to demonstrate that buying pressure is returning.
CryptoNuclear’s analysis emphasizes confirmation rather than anticipation. A sustained move above descending resistance, supported by stronger trading volume and a successful retest, would provide better evidence of a bullish breakout. A brief move above the trend line without follow-through could instead prove to be a false breakout.
PENGU Price Prediction: Key Resistance Levels and Bullish Targets
The four-day chart identifies $0.0105 as the first resistance level to watch. A move above this threshold could strengthen the recovery setup, although PENGU would still face additional barriers before reaching the $0.013 area highlighted by Ali Charts.
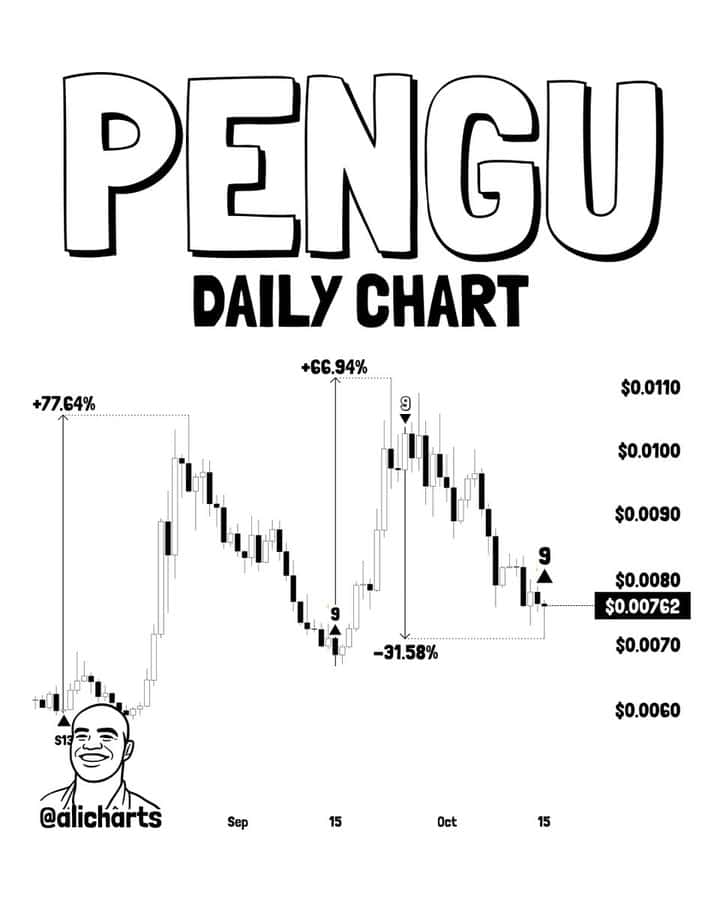
PENGU’s daily chart flashes a TD Sequential buy signal after previous signals preceded gains of 77.64% and 66.94%. Source: Ali Martinez via X
The next resistance levels are $0.0127 and $0.0150. The former sits close to the projected $0.013 target, making it an important level for evaluating whether bullish momentum can persist. A sustained break above $0.0150 would offer further evidence that the recovery is extending beyond an initial rebound.
If the token clears these intermediate barriers, the chart identifies $0.0232 and $0.0268 as more distant potential targets. Those levels would require a substantially larger advance and should be treated as conditional scenarios rather than near-term expectations.
The following levels summarize the main areas identified in the supplied technical analyses:
- Initial resistance: $0.0105
- Intermediate resistance: $0.0127
- Key recovery threshold: $0.0150
- Higher resistance zone: $0.0232
- Extended bullish target: $0.0268
- SuperTrend signal reference price: $0.0081
- Potential support: $0.0065
- Lower support zone: $0.0050–0.0037
These levels are based on the supplied chart analyses and may change as price action develops. They are not guaranteed points of reversal or continuation.
PENGU Price Prediction: Higher Highs and Higher Lows Support Recovery Case
Another technical analysis shared by @0xSweep points to a sequence of higher highs and higher lows on PENGU’s daily chart. This pattern can indicate that buyers are gradually gaining control, provided the token continues to defend its recent swing lows.
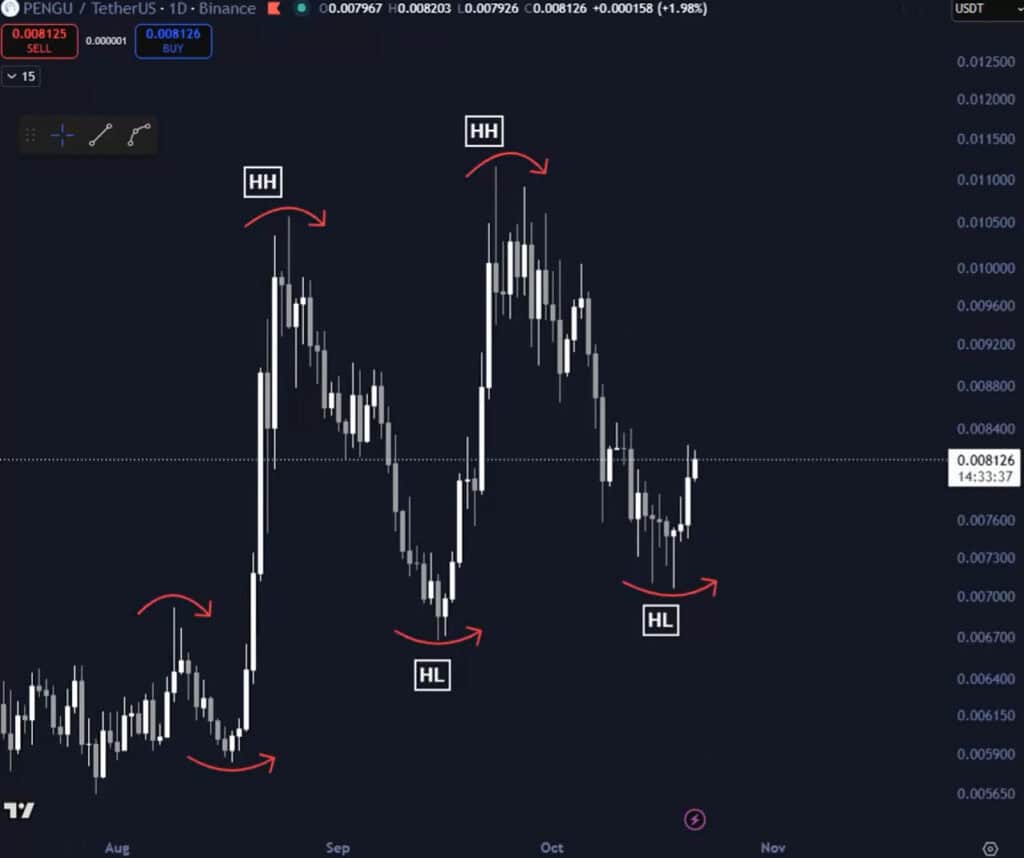
$PENGU is forming higher highs and higher lows on its daily chart, forecasting a potential 20%+ rally if Bitcoin holds above $83K. Source: @0xSweep via X
The analyst suggested that PENGU could gain more than 20% if Bitcoin holds above $83,000. Such a move would depend on both the token’s chart structure and conditions across the broader cryptocurrency market. Bitcoin weakness could undermine the setup by reducing risk appetite for smaller crypto assets.
Higher highs and higher lows are useful measures of price structure, but they do not confirm that an uptrend will continue indefinitely. A break below a previous higher low would weaken the bullish interpretation, while a move above a recent swing high could strengthen it.
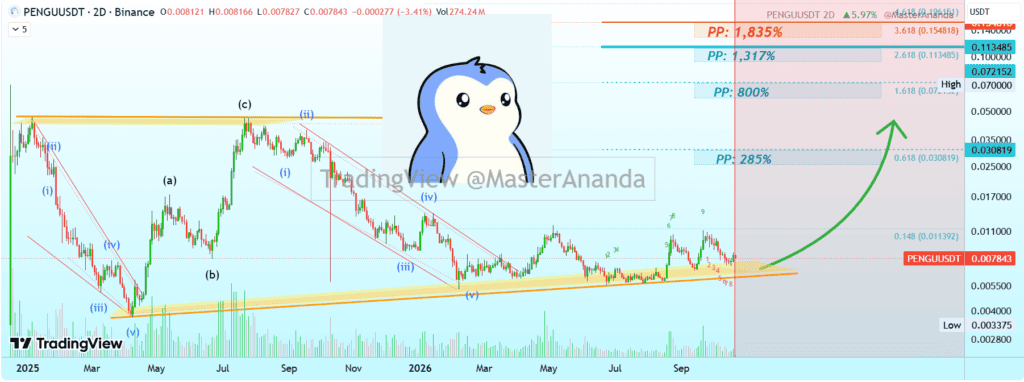
The chart shows prolonged sideways consolidation after the latest down-wave failed to trigger a new up-wave, leaving the market awaiting a decisive breakout or breakdown. Source: MasterAnanda on TradingView
The longer-term outlook remains less certain. A separate TradingView analysis by MasterAnanda describes PENGU as having spent an extended period consolidating after its earlier decline. The analysis interprets the rising long-term support structure as a potential foundation for another bullish cycle, although the duration and scale of any recovery remain unknown.
PENGU Bearish Scenario: $0.0065 Support Remains Important
Despite the bullish SuperTrend flip, PENGU has not confirmed a sustained breakout from its broader consolidation pattern. Failure to overcome descending resistance could leave the token vulnerable to another pullback.
The four-day chart identifies $0.0065 as an important potential support area. A decline toward this level would indicate that sellers had regained control of the short-term trend. If support breaks, the $0.0050–$0.0037 region becomes a lower zone to monitor, according to the supplied chart analysis.
A convincing bearish signal would involve a close below ascending trendline support, preferably accompanied by rising selling volume. Such a move would weaken the argument that PENGU is establishing progressively higher lows.
Broader market conditions also matter. A decline in Bitcoin or a wider retreat across speculative crypto assets could increase selling pressure on PENGU, regardless of its individual technical indicators. Traders should therefore assess the SuperTrend signal alongside price structure, volume, and market direction rather than relying on one indicator.
Pudgy Penguins Fundamentals Add Context to PENGU Price Prediction
PENGU is the token associated with Pudgy Penguins, a consumer brand that developed from a non-fungible token (NFT) collection into a business spanning digital collectibles, toys, and merchandise. Its retail presence, including products sold through Walmart and Target, provides a broader brand context beyond crypto trading.
However, brand recognition does not necessarily translate into sustained token demand. PENGU’s price remains sensitive to cryptocurrency market sentiment, trading activity, and investors’ willingness to hold speculative assets.
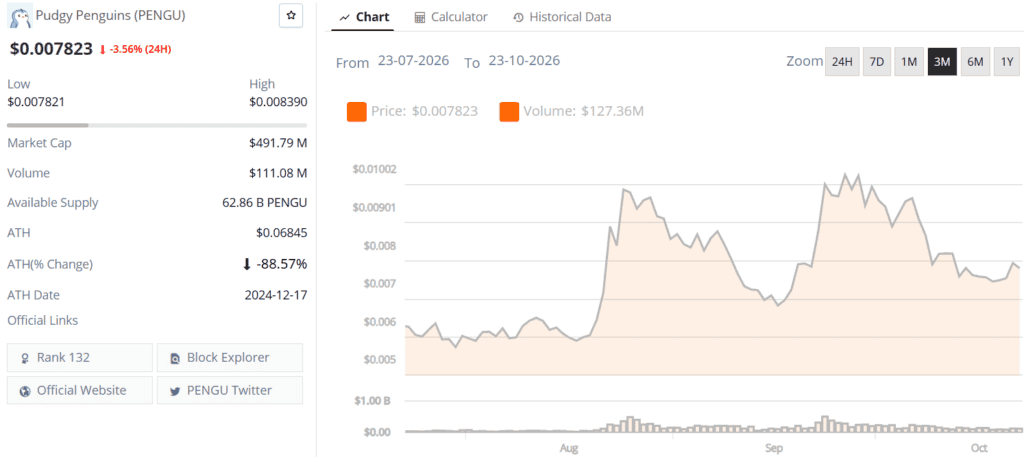
Pudgy Penguins (PENGU) price chart. Source: Brave New Coin
A significant development for the wider Pudgy Penguins ecosystem came in October 2026, when Igloo announced plans to shut down its Abstract Ethereum layer-2 network on December 15. The Block reported that the decision was followed by challenges, including stagnant growth, limited liquidity, and insufficient revenue to support continued operations. The company also decided against launching a token to finance the network.
The closure introduces a separate business consideration for the ecosystem, although it does not by itself determine PENGU’s short-term price direction. Investors will need to distinguish developments affecting the brand’s broader business strategy from signals generated by the token’s trading chart.
Final Thoughts
PENGU’s bullish SuperTrend flip near $0.0081 has put a potential recovery toward $0.013 in focus. Ali Charts’ reference to previous TD Sequential signals provides historical context, while the symmetrical triangle and higher-low structure offer additional technical levels to monitor.
For the bullish case to strengthen, PENGU would need to clear initial resistance at $0.0105, followed by the $0.0127 area. A sustained move above these levels could bring $0.013 and then $0.015 into focus. Stronger volume and a successful retest of broken resistance would provide more convincing evidence of a breakout.
The bearish alternative remains valid if PENGU fails to overcome descending resistance or breaks below its rising support structure. In that case, $0.0065 could become a key downside level, with $0.0050–$0.0037 representing a lower potential support zone.
The proposed 70% rally remains a conditional scenario, not a confirmed forecast. PENGU’s next directional move will depend on whether buyers can turn the latest momentum signal into a sustained breakout while broader crypto market conditions remain supportive.
 Brave New Coin reaches 1M+ engaged crypto enthusiasts a month through our website, podcast, newsletters, and YouTube. Get your brand in front of key decision-makers and early adopters in 2026. Limited slots remaining! Find out more today!