Quant (QNT) Price Prediction: Trendline Breakout Signals Recovery as QNT Reclaims $200

Quant (QNT) recovered toward $200 on Monday after falling to $182 on Sunday, as buyers stepped in following a sharp October sell-off.
The recovery follows a decline from approximately $242 a week earlier, leaving traders watching whether the Quant price can break through nearby resistance or resume its downward trend.
Quant Price Rebounds From $182 as Buying Returns
QNT dropped to around $182 at approximately 9 PM WAT on Sunday before climbing nearly 10% toward $200 by early Monday. The token posted a daily gain of approximately 3.7%, with 24-hour trading volume reaching $81 million. Bitcoin traded near $82,800 during the move.
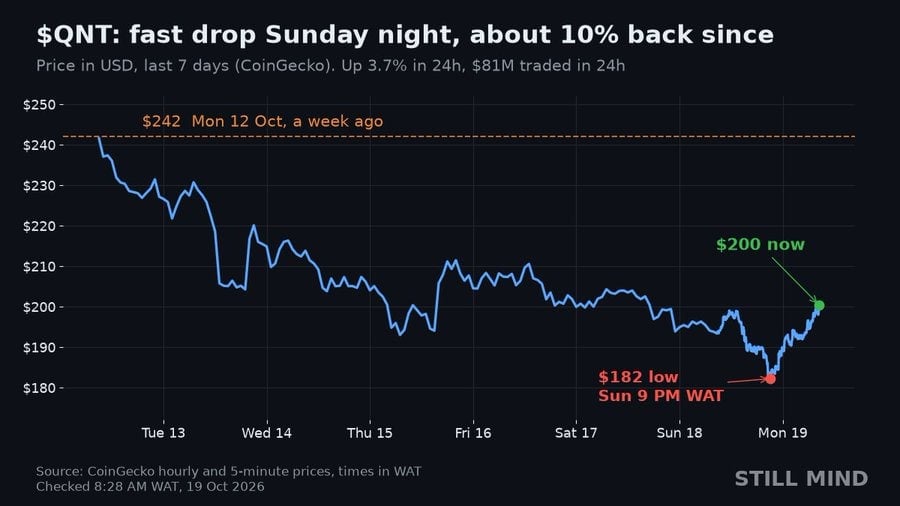
The seven-day chart shows a decline from $242, followed by a sharp overnight rebound as selling pressure eased and buying demand returned. Source: @AlphaPlugCyrus via X
Despite the latest recovery, QNT remains under pressure after falling nearly 29% in October. The correction followed a September rally of more than 370%, which coincided with news of Quant’s tokenized deposit network deal with The Clearing House.
The latest price action indicates renewed demand near $182, but a sustained reversal would require further gains and stronger support at higher levels.
Quant Price Forecast: Descending Trendline Breakout Offers Hope
Crypto trader @oneandonlyseb shared two-hour Binance charts showing QNT breaking above a descending trendline as the price approached $200.31. The analyst interpreted the move as a potential signal of bullish continuation.
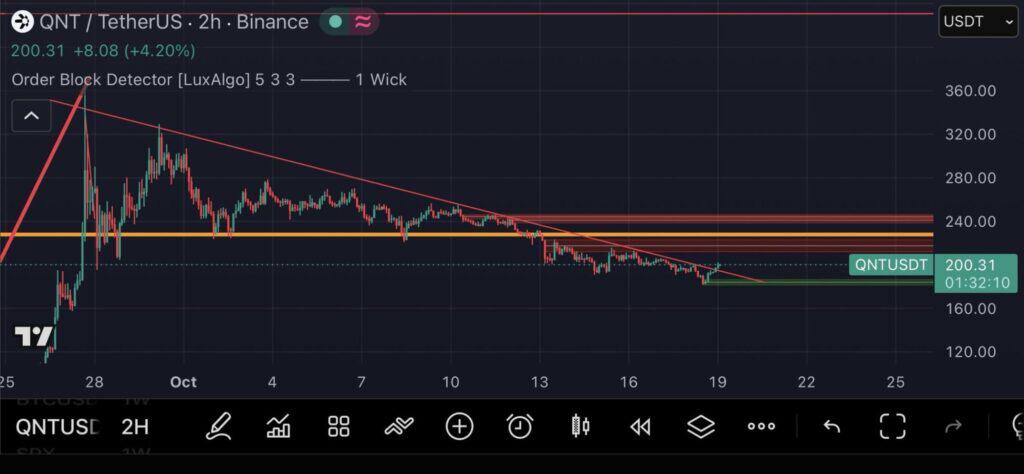
QNT breaks its descending trendline near $200.31, rising over 4% and signaling potential bullish continuation. Source: @oneandonlyseb via X
A descending trendline connects lower highs during a decline and can act as resistance. Breaking above it may indicate weakening selling pressure, particularly if the price holds above the line during subsequent trading sessions.
For Quant, maintaining this breakout would strengthen the short-term outlook. However, a return below the trendline could indicate that buyers lack sufficient momentum to sustain the recovery.
Community reactions remained divided, with some traders expressing interest in accumulating QNT while others questioned the analyst’s change in stance. These responses reflect uncertainty following the token’s sharp September rally and October correction.
QNT Faces $208–$224 Resistance After the Rebound
Trader AlastarTrades identified $208 as an important resistance level following QNT’s October 18 liquidation sweep near $185 and subsequent decline to $182. The analyst highlighted a sell wall and potential short liquidations above the current trading range.
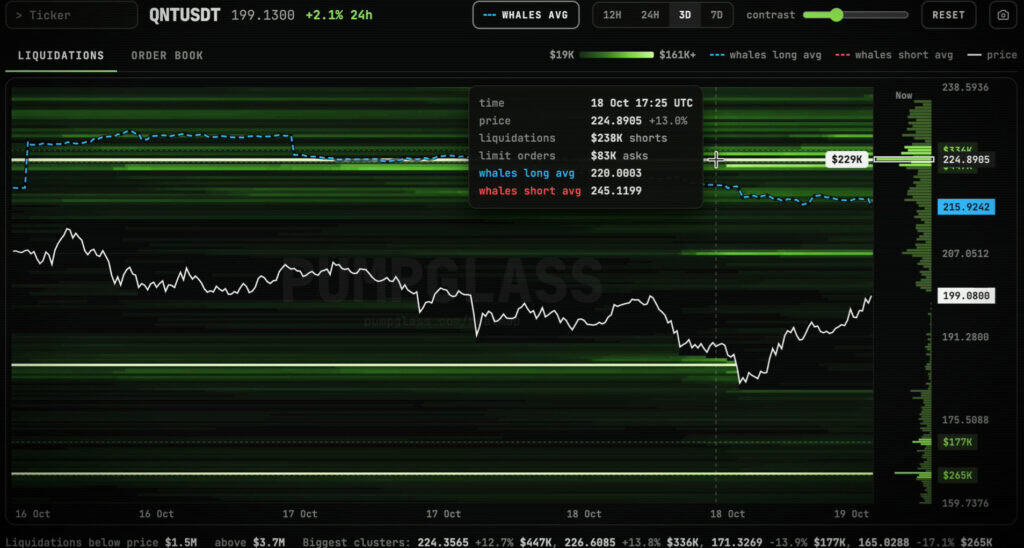
Whale shorts rose from 99 to 161, with resistance at $208 and $216 and $447K in short liquidations near $224. Source: @AlastarTrades via X
A break above $208 could bring $216 into focus, which the analyst identified as the breakeven area for larger long positions. Further gains could expose approximately $224, where the analysis identified around $447,000 in potential short liquidations.
Liquidations occur when leveraged positions are forcibly closed after prices move against them. If QNT rises into these areas, short liquidations could contribute to buying pressure, although the outcome depends on market liquidity and the positions still open.
AlastarTrades also reported that whale short positions increased from 99 to 161 during the decline. A move above $208 could put some of those positions under pressure, while a drop below $188 could expose QNT to another test of its recent lows.
Bearish Structure Remains Below Key EMAs
Technical analyst @MWi_EW offered a more cautious assessment, highlighting QNT’s rejection near $213 on the eight-hour chart and its subsequent breakdown below $196 support.
The analysis identified $177 as a downside Fibonacci target associated with the 0.618 retracement level. If selling pressure continues, $150 could become a further downside reference.
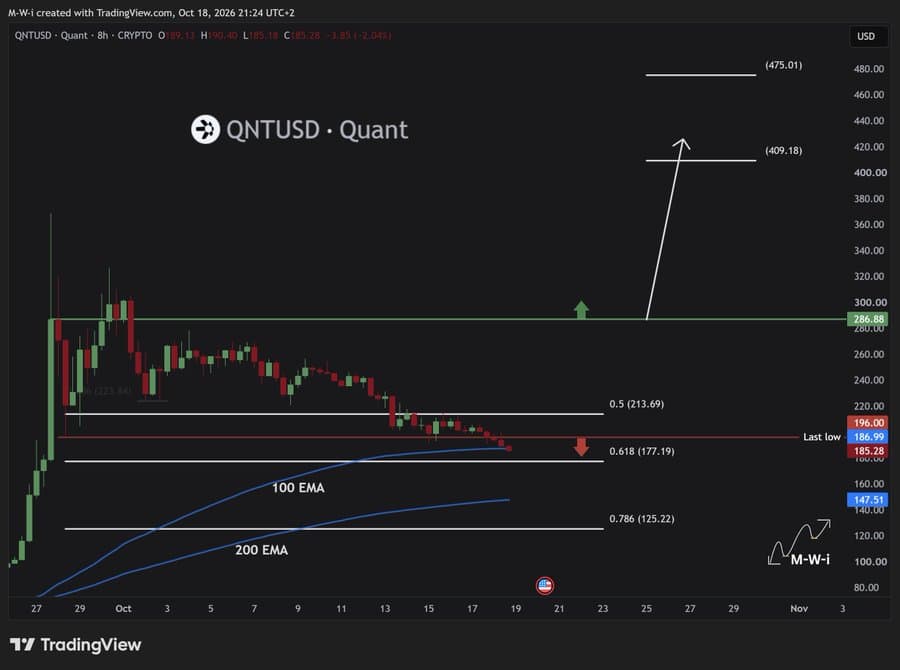
QNT remains below key EMAs, with $280–$409 resistance; bullish momentum requires reclaiming $196. Source: @MWi_EW via X
Quant was also trading below key exponential moving averages (EMAs), indicating that the broader technical structure remained bearish. The analyst identified overhead resistance zones between $280 and $409.
Reclaiming $196 and holding above it would help improve the short-term outlook. Until that happens, the trendline breakout remains a tentative bullish signal rather than confirmation of a broader reversal.
Quant Partnership With The Clearing House Remains a Fundamental Catalyst
Quant’s recent market performance followed an important development in institutional payments. On September 24, 2026, The Clearing House announced that it had selected Quant to support its On-Chain Money Initiative, a planned network for clearing and settling tokenized deposits across financial institutions.
Quant will provide interoperability, orchestration, and transaction-management technology connecting tokenized deposit transactions with existing payment infrastructure, including the RTP and CHIPS networks. The initiative is expected to become available to participating institutions in the first half of 2027, according to The Clearing House announcement.
Tokenized deposits are commercial bank deposits represented and transferred through digital infrastructure. They differ from cryptocurrencies issued independently of bank deposit relationships.
The announcement coincided with increased market attention toward Quant and its role in financial infrastructure. However, the partnership alone does not establish a direct relationship between future network activity and demand for QNT. Its longer-term significance will depend on implementation, institutional adoption, and the token’s role within the ecosystem.
QNT Price Prediction: Key Levels to Watch
QNT’s near-term direction depends on whether buyers can reclaim key resistance levels while defending support.
A sustained move above $200 and a break through $208 would strengthen the recovery scenario. Further gains could bring $216 and $224 into focus, although selling pressure may emerge before either level is reached.
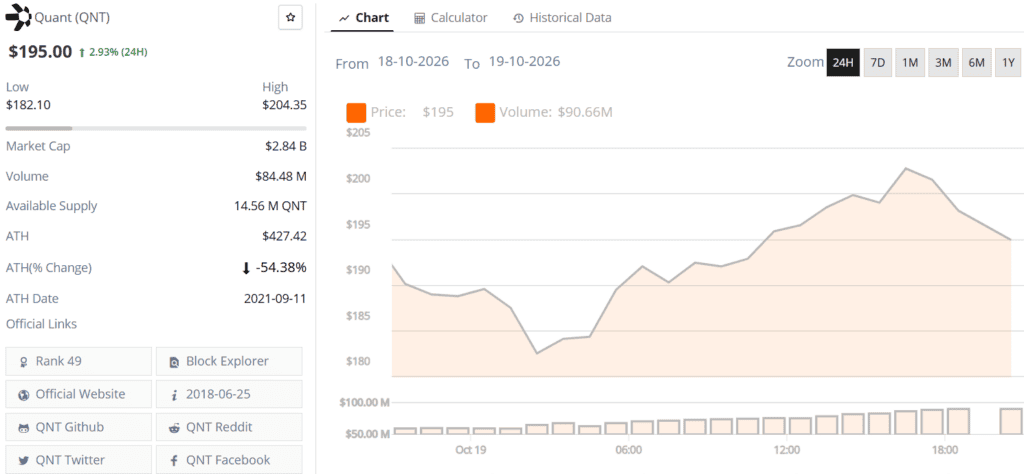
Quant (QNT) price chart. Source: Brave New Coin
On the downside, failure to hold $196 would weaken the bullish setup. A break below $188 could expose the recent $182 low, followed by the $177 Fibonacci level. The $150 area represents a deeper bearish scenario if selling intensifies.
For now, the trendline breakout offers a potential shift in short-term momentum, but resistance overhead and the broader bearish structure remain significant obstacles. A sustained move above $208 would provide stronger evidence of improving market conditions, while renewed weakness below $188 would increase the risk of another decline.
 Brave New Coin reaches 1M+ engaged crypto enthusiasts a month through our website, podcast, newsletters, and YouTube. Get your brand in front of key decision-makers and early adopters in 2026. Limited slots remaining! Find out more today!