Signals From The Bitcoin Options Market – Is A Price Drop Coming?

![]()
It has been a bumper beginning of the year for Bitcoin with the price pushing past US$20,000 and delivering double-digit percentage gains in the last 2 weeks. But... in the BTC options market there is a confluence of puts forming around the US$14-15,000 price level. So what can Bitcoin options data tell us about market sentiment and potential BTC price movement?
What are Options?
Bitcoin options give traders the right to buy or sell an agreed amount of Bitcoin at a set date for a specific price. Options provide market participants a way to hedge their risk on spot or futures positions or simply to make a bet on the future price of an asset. For example, for a fee, a trader may choose to buy a call option contract to purchase BTC for US$20,000 which expires in a month.
If the Bitcoin price rises and reaches US$22,000 at the end of the month, the trader can then exercise the call option to purchase the BTC for US$20,000 and sell it at the market price of US$22,000, earning a US$2000 profit.
With a “put” option traders take the opposite side of the bet and have the right to sell Bitcoin at a predetermined price.
The strike price of an option is the fixed price at which the owner of a contract can buy or sell the underlying commodity or asset. Options can either be in-the-money, out-of-the-money, or at-the-money.
| Put | Call | |
| In-the-money (ITM) option | The price of the underlying is less than the strike price of the option. | The price of the underlying is greater than the strike price of the option. |
| Out-of-the-money (OTM) option | The price of the underlying is greater than the strike price of the option. | The price of the underlying is less than the strike price of the option. |
| At-the-money (ATM) option | The price of the underlying is equal to the strike price of the option. | The price of the underlying is equal to the strike price of the option. |
Data from the options market is often the basis for making long-term macro price bets. The complexity associated with options-based financial products often means they are nearly exclusively traded by “smart money”. Smart money is capital that is controlled by institutional investors, funds, central banks and other financial professionals.
In legacy markets, derivatives typically account for more than four times the trade volumes of the underlying asset. Legacy markets include stocks and commodities like Wheat, Oil and Gold. But in the Bitcoin markets, spot trading still accounts for a much larger proportion.
This is changing, however, driven by the entry of several new derivatives players and their associated infrastructure, as well as the understanding of crypto markets growing. Gamma squeezes and liquidity crunches caused by derivative market action do often affect price action in crypto markets.
Options data trends
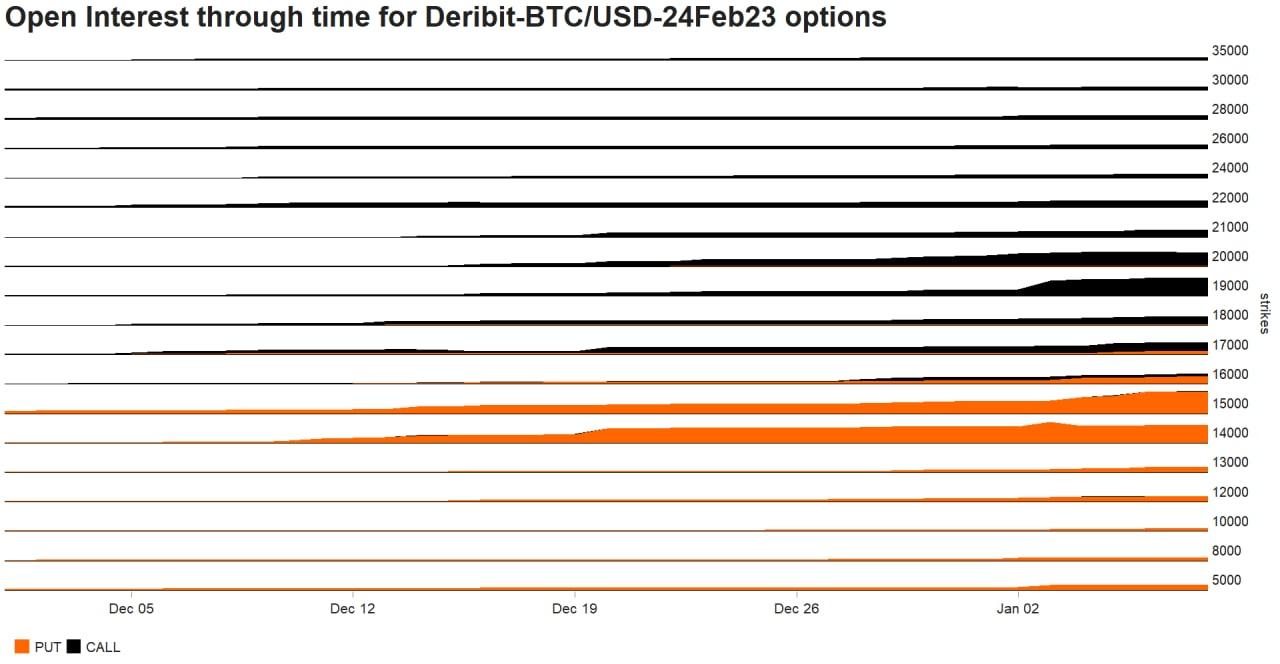
Source: Brave New Coin data
The chart above shows the recent open interest trends for BTC/USD options contracts between the end of 2022 and the beginning of 2023. There is a noticeable trend towards both Out-of-the-money puts and calls. The volume for both puts and calls has risen over the course of December. There are more puts than calls suggesting that the market is leaning bearish.
It should be noted that much of the volume is for BTC/USD put options that are deeply out of the money. The delta value for the highest volumes put with a strike between US$14,000 to US$15,000 is 0.1-0.2. These can therefore be considered relatively high-risk bets.
The Bitcoin price has been on an upward trend since the beginning of January. The asset is up ~14% in the last 14 days and is enjoying a run of price momentum. However, the run has arrived with what technicals suggest are less than impressive volumes.
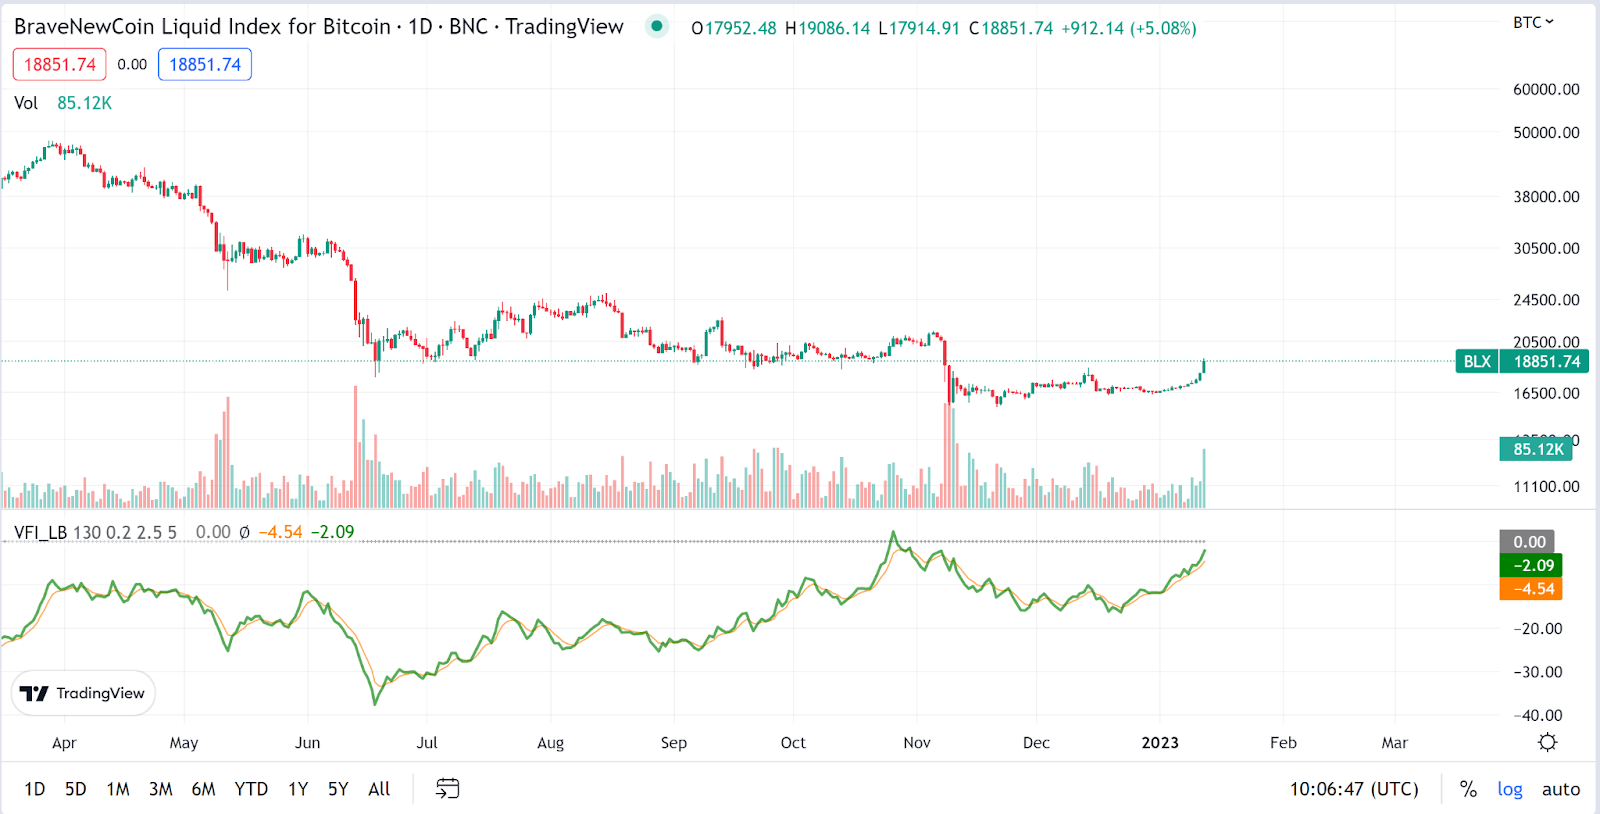
Source: Tradingview
The volume flow indicator (The green and yellow lines below the candlestick chart) was introduced by Markos Katsanos and is similar to the popular On-Balance-Volume indicator, apart from a few key differences. It uses a median value for the day instead of the closing price, it uses volatility thresholds to discount excessive volumes and minimal price changes, and it offers a clear indicator value that can be used to determine a bullish or bearish indicator.
Currently, we have a moderately bearish volume flow indicator value of -2.09 but it is rising upwards. More volume is arriving to support the ongoing bullish price but we cannot yet confirm a bullish volume trend.
A strong start to the year for Bitcoin but there are reasons to remain cautious
Bitcoin and the crypto asset class are responding well to recent cooler supply chain (PMI) and wage (non-farm payrolls) reports. These economic indicators suggest that US inflation may have peaked and that interest rate rises in the country will slow.
Traders on the CME are predicting a 0.25% interest rate rise at the next FOMC meeting, less than the previous 0.5% rate hike. Bitcoin and crypto jumped on January 12th following the first CPI print of the year. The report, which covered consumer prices in December 2022, showed that prices rose by 6.5% in the month. This was the smallest increase in a year and the sixth month in a row when the inflation rate had slowed.
Lower interest rates and lighter inflation are both conditions that favour investment and discretionary spending. Crypto bulls are anticipating and buying into a potentially incoming favourable macro environment so far in 2023.
This may be somewhat short-sighted, however, with central bankers and institutions both suggesting that there is more macro pain in store in the coming year. Most central bankers are remaining cautious despite lower inflation rates than in recent months compared to 2022 highs, as inflation remains well above the targeted 2% rate.
In general, the global economic outlook for 2023 appears to be bleak to middling. The World Bank recently slashed its global economic growth figure for 2023 to 1.7% from its previous number of 3%. The World Bank said this would be “the third weakest pace of growth in nearly three decades”, only comparable to periods during the Global Financial Crisis and the pandemic. The growth in the US is predicted to be 1% and in Europe & Central Asia it was 0.1%.
JP Morgan in its forecast for 2023 is particularly bearish about discretionary spending and capital investments. It suggests more losses in the stock market and across other asset classes simultaneously including crypto, housing, bonds, and alternative/private investments. It predicts fundamentals will deteriorate and constrictive interest rates will continue to be a cloud over speculative investments.
Some options traders appear to be sharing a similar sentiment, backing a price drop to occur in 2023 given the large volume of puts bought at around $15,000 – US$14,000 – and expiring on Feb 23, 2023.
A possible Gamma Squeeze
This may set up for some sort of gamma squeeze. The short-term overarching bullish sentiment can represent an opportunity for some institutional participants willing to counter trade general sentiment crypto markets. There is an ample, accessible market for crypto derivatives. It has often been suspected that large players have the capabilities to influence the prices on the spot market through the derivative markets.
A gamma squeeze is one of the more conditional derivative-to-spot market scenarios. The conditions of a negative gamma squeeze are;
- Dominating bullish market sentiment
- The underlying asset has poor liquidity
- The underlying asset has usable derivatives market infrastructure
- There is some underlying bearish narrative that may reserve sentiment.
There are likely only two assets in crypto that have robust enough options markets to meet the third condition – Bitcoin and Ethereum. The way market makers hedge risk when selling puts is by selling spot or shorting perpetual contracts to maintain risk neutrality.
If the strike price of the put options were to fall below the agreed-upon price, then the buyer would have the right to sell the asset at higher than market rates. Because of this Market Makers have to sell spot to ensure that their risk is covered if put buyers suddenly become profitable. Bears will attempt to create sell pressure where market makers are put in this position. The medium-term bearish raised by economic forecasters at institutions like the World Bank will be the fundamental fuel to drive bears.
This can potentially lead to a situation of cascading selling and a price collapse if the price drops to where the puts are gluttonous.
Conclusion
Bitcoin has undeniably begun the year strongly with bullish momentum. A dropping rate of inflation and a weaker US dollar is pushing investors risk-on. There appears to be the possibility of lower interest rates and fewer reasons to back fixed income. We are observing a rotation back towards riskier investments like cryptos and stocks, and the bulls are on parade.
Scoping out wider, however, most major institutions say a recession is coming in 2023. The clouds of the pandemic and inflation still loom and many view the current euphoria as temporary. The Bitcoin options market is placing out-of-the-money puts, betting that the price of BTC will drop to US$15000-US$14000.
Brave New Coin (BNC) sources crypto derivatives data from top crypto derivatives markets and has historical data going back X months/years. Interested parties are welcome to contact BNC for more information on what data is available and how to use it.
 Brave New Coin reaches 1M+ engaged crypto enthusiasts a month through our website, podcast, newsletters, and YouTube. Get your brand in front of key decision-makers and early adopters in 2026. Limited slots remaining! Find out more today!


