Silver Price Forecast Puts $52.75 in Focus Before the December Fed Meeting

Silver is trying to break a difficult selling trend and return to a long-term buying trend, but the chart shows a significant ceiling that could hold the market down.
The metal dropped from the $58 region in October to a low near $49, then bounced back toward the $51.30 area before easing to $50.78, according to market data on TradingView.
The two-hour candle saw the price ending at $50.7750, which was a 0.29% drop. Whether or not buyers can reclaim $51.74 and break $52.75, or if the rebound is lost under resistance, may be the key to the coming week.
Silver’s Rebound Remains Below a Key Resistance Band
The two-hour chart indicates the formation of a fall channel beginning from about October 21. But silver then lost horizontal support near $52.75 on October 29, pushing its slide down to $49.00 at the beginning of November.
That dip was defended by the buyers, and a modest recovery was pushed back to $51.30, but the pullback seems to have shown that the broader pullback was far from over.
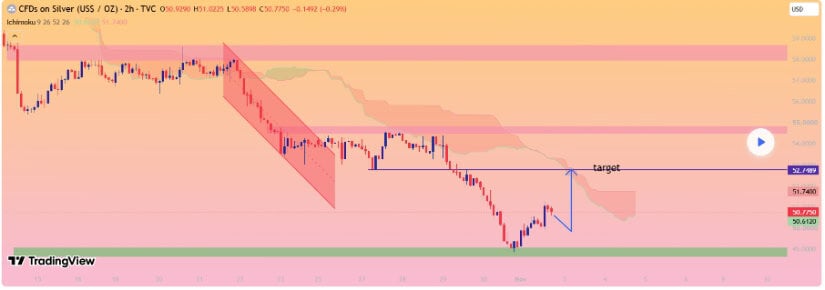 This reserved outlook is supported by the Ichimoku indicator. It shows the reference readings around $50.61 and $51.74. Source: TradingView
A downward cloud forms overhead, and silver is slightly higher than the lower reading but is lower than the higher one. The $52.7489 line is then an upside test rather than an upside support, not shown as such. The buyers must recover the level of the indicator’s resistance and cross the horizontal barrier to confirm the reversal.
The latest low is the definite support on the image. Retaining it above the surface would give the opportunity for another rescue attempt. If, however, the rejection keeps the sellers on top below $51.74, then it would be repeated. If the price finds support at $48.00, the next psychological level could be reached if the price breaks below $49.00, which is not confirmed by the chart at this time.
Seasonal Chart Shows 2026 Lagging Earlier Years
Meanwhile, another TradingView chart shows a comparison of silver’s performance in 2024 vs. 2025 and 2026. It shows 2026 down 28.67% by early November, compared with a 21.28% gain in 2024 and a 142.33% advance in 2025 at the corresponding point.
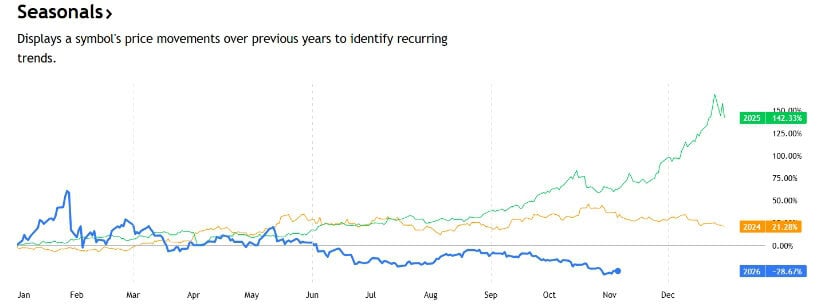 This comparison is meant to highlight silver’s underperformance this year, following its stellar performance in 2025. Source: TradingView
That seasonal display isn’t a forecast. The advance for the year 2025 was much larger than usual, and there is no repeatable pattern for this. However, the 2026 line has been negative for most of the second half of the year, with little sign of a positive seasonal trend. Price confirmation is more important than taking for granted that November will be like previous years.
December Fed Meeting Puts Inflation and Jobs Data in Focus
Markets will closely watch monetary policy, as it is expected to be a primary factor ahead of the Federal Reserve’s meeting on December 8–9. In the lead-up, inflation reports, employment data, Treasury yields, and a changing value of the U.S. dollar can have a profound impact on expectations regarding the next policy change.
The recent employment report has added to the uncertainty. The dollar and Treasury yields strengthened as U.S. job growth was better than expected, Reuters reported on November 6. Traders pushed the chances of an increase in the interest rate in December up to 81%, up from 72.8% prior to the report.
Silver is generally not paid interest on it and is traded in dollars, so higher yields and a stronger dollar can be a negative for silver. If inflation were lower or job growth were weaker, then it would ease those pressures by dampening further demand for tightening.
Physical-market conditions also are important but may be less significant in the coming few sessions. Silver appears to be more responsive to interest-rate expectations and is less supported than gold, while there is less physical demand in the solar sector, according to Sucden Financial’s fourth-quarter outlook.
It also identifies constrained inventories as a potential buffer to more serious losses. The biggest influence for the upcoming week is more likely to be on the side of rate expectations. The coming week’s Silver Price Scenarios are presented below. Silver price scenarios for the upcoming week are presented below.
Bearish Scenario
The bearish case prevails as silver is trading below the overhead Ichimoku cloud as well as $51.74. If the price doesn’t come back to the area, it could push the price up to $50.00 and then to the recent $49.00 low. If the price breaks below $49.00, this should be a sign that the rebound is losing momentum and the $48.00 psychological level may be near. A continued recovery in U.S. data or upward yield pressure or renewed dollar strength would support this trend.
Bullish Scenario
The bulls must break above the resistance level of $52.75 and rally back to $51.74 to confirm the bulls are in charge. If the price closes above $52.75 for 2 hours or more, then it will be a better indication that the breakdown is out of control. It may be a step towards the 54.50-55.00 resistance level. That would require some less-than-tough US data, a reduction in yields, or a weaker dollar.
The week ahead’s overall outlook is neutral. The $49.00 level has found support, and the downward trend and bearish Ichimoku cloud are preserved. The 52.75 to 51.74 range will be the crucial area to see if buyers are able to take control.
Frequently Asked Questions
1. Which of the following is the most critical level of resistance for silver?
The short-term indicator resistance is at $51.74. The key level to watch is the $52.75 mark, which silver must retake to improve its bullish outlook.
2. What is silver’s most important level of support?
The chart provided highlights the clearest support level in recent times to be around $49.00. An extended move below that level may bring the psychological $48.00 level into play.
3. What is needed to validate a bullish turn in silver?
A 2-hour close above $52.75 followed by further buying activity would increase the chances that the downtrend of recent activity is likely to be fading.
4. What would be the probable reaction of silver in the event of a negative outcome by the December FOMC meeting?
A more hawkish Fed sentiment could help to boost the dollar and Treasury yields, which would weigh on silver. Easier monetary policy expectations would be bolstered by softer inflation and employment data.
5. Does the seasonal chart suggest silver will rally in November?
No. The performance comparisons in the chart are historical, not indicative of any particular season. Silver is still in the red at 28.67% as of the provided snapshot in 2026.na
 Brave New Coin reaches 1M+ engaged crypto enthusiasts a month through our website, podcast, newsletters, and YouTube. Get your brand in front of key decision-makers and early adopters in 2026. Limited slots remaining! Find out more today!