Stellar (XLM) Set for Bullish Breakout as 2024-2025 Rally Approaches, Eyes Key Resistance at $0.42

![]()
Stellar appears poised for a potential bullish breakout as technical analysis points to similarities between its current price cycle and previous rallies seen in 2020-2021.
With the price hovering near key resistance at $0.42, market participants are closely monitoring for signs that could trigger a significant upward move in the months ahead.
Historical Price Cycles Signal Accumulation and Potential Surge
A detailed price chart shared by analyst Steph shows Crypto highlights multi-year price cycles for the token. The chart compares consolidation and rally phases, revealing that the asset is recovering after a prolonged accumulation period. Similar to past cycles, the structure suggests that XLM may be nearing a decisive breakout point, setting the stage for strong gains in 2024 and 2025.
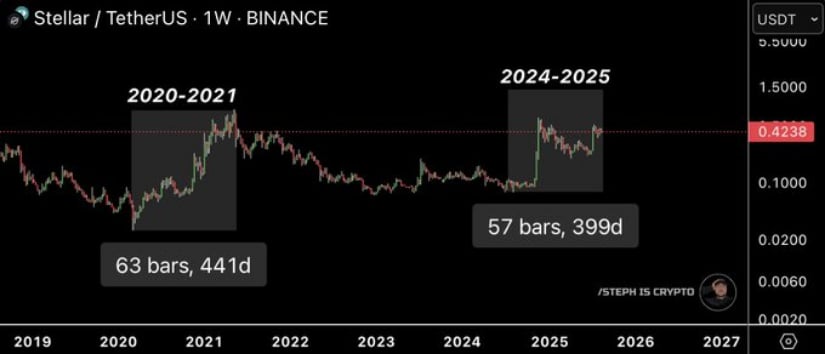
Source: X
Currently, the token trades around $0.42, reflecting a modest 1.65% decline over the past 24 hours. Despite this short-term dip, the broader technical landscape resembles that of previous bull markets.
Historically, following extended consolidation periods, the memecoin has experienced sharp price advances, raising expectations that a similar trajectory may be underway. Investors are advised to watch for confirmation from breakout signals to identify optimal entry opportunities.
Price Range and Volume Indicate Potential for Breakout
Recent price action reported by BraveNewCoin shows Stellar fluctuating within a narrow range between $0.40 and $0.42. While there has been a slight decline in price and volume in the last 24 hours, overall market activity remains notable.
Volume trends reveal increased trading interest as prices approach the $0.42 resistance, though momentum has not yet been strong enough to overcome this hurdle.
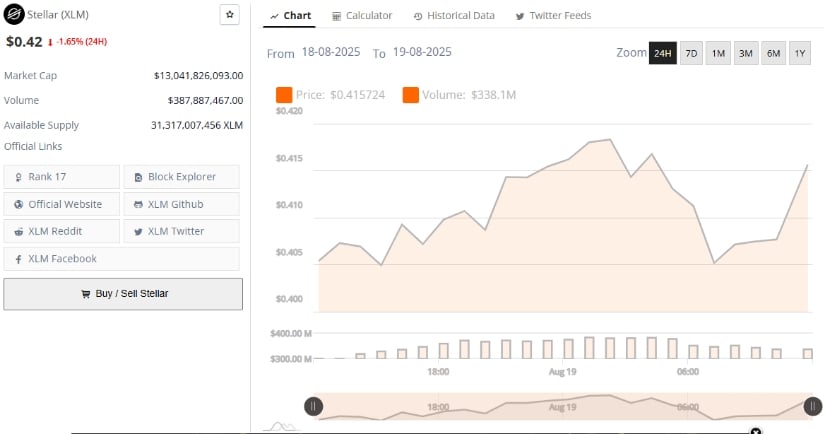
Source: BraveNewCoin
Notably, lower volume near $0.40 indicates cautious participation, but volume spikes near resistance suggest the potential for a breakout if buying escalates. The compression of price within a tightening range often precedes periods of significant movement in either direction. Market watchers are particularly focused on any sustained price action above $0.42, which could herald the beginning of a bullish phase reminiscent of historical rallies.
Technical Indicators Signal Short-Term Bearishness, Long-Term Uptrend Intact
TradingView data provides technical insights into Stellar’s momentum through the Relative Strength Index (RSI) and Moving Average Convergence Divergence (MACD) indicators. The RSI currently sits at 46.59, indicating a neutral stance—not overbought or oversold. Its moving average near 55.16, slightly above the RSI, suggests momentum could shift upward if the RSI strengthens.
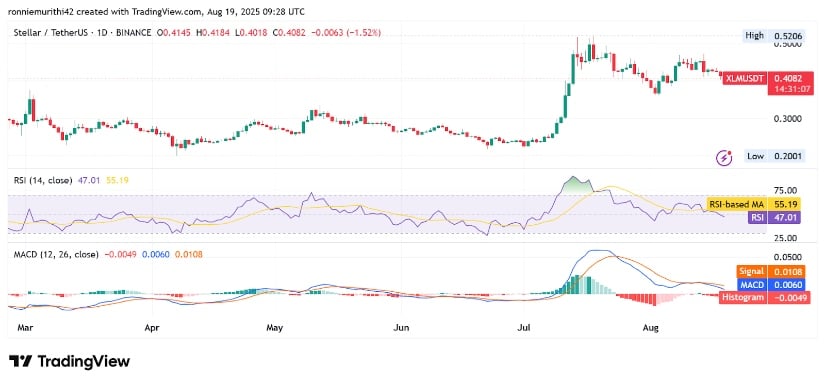
Source: TradingView
However, the MACD signals indicate short-term caution, with a bearish crossover showing the MACD line below the signal line and a negative histogram. This pattern points to near-term resistance challenges around $0.42. A failure to breach this resistance could prolong consolidation or trigger minor pullbacks.
Despite these short-term indicators, the longer-term trend continues to be positive. Should the RSI increase and the MACD regain bullish momentum, a decisive overthrow of immediate resistance could occur. Surpassing $0.43 may open the door toward $0.50, presenting promising targets for traders with a longer investment horizon.
 Brave New Coin reaches 1M+ engaged crypto enthusiasts a month through our website, podcast, newsletters, and YouTube. Get your brand in front of key decision-makers and early adopters in 2026. Limited slots remaining! Find out more today!


