Top 5 Crypto Chart Patterns: Best Examples

![]()
Technical analysis is a system used by traders to make trading decisions. It involves analyzing past market data to identify patterns and trends that may indicate future price movements. One of the key tools used in technical analysis is a chart, which provides a graphical representation of price movements over time. This article looks at some of the most famous chart patterns in technical analysis.
Making forecasts is essential for accumulating wealth: we can’t hope for the economy to be stable indefinitely, but we can prepare ourselves for possible trends and patterns. Most forecasting strategies rely on statistics that include records of past periods. Crypto trading is not an exception, with Candlesticks, Wedges, Triangles and other popular charts also presenting data in a way that traders can recognize upcoming market trends.
Why look for patterns on those charts, though? There’s a theory that the market repeats itself after certain cycles. So, there are patterns based on statistics that are followed by similar outcomes. The main question is whether a bearish trend – when asset prices go down or a bullish trend – when asset prices rise, will prevail. To answer that, there are many patterns that we can apply, consisting of many shapes and forms.
Here we collected the best examples for a crypto trader.
Head and Shoulders Pattern
This pattern marks the end of an uptrend phase and is usually followed by an abrupt price change. Evidently, it has a visual resemblance to two shoulders with a head in between. On the chart, it looks like three peaks – the right and left of an equal height, and the central one is the highest. It also can be spotted in reverse. Have a look at the lines that make up the shoulders and the head – they can be of a bearish or bullish nature.

An example is the ETH price which displayed a head and shoulders pattern before dropping down and finalizing the uptrend.
Pin Bar Candlestick Pattern
If you are wondering how to identify this one, here is a pin bar candlestick pattern explained: we refer to candlesticks as price bars that actually form a pattern.
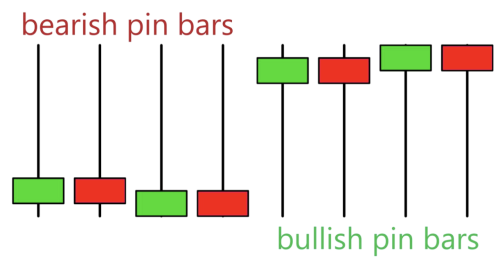
The pin bar candle has a long shadow (wick, tail) and a relatively small body. Why is this important for traders? The pattern marks the point where the price has been rejected by the market.
A bearish pin has a long upper tail that suggests the rejection of higher prices and, as a result, a downtrend.
A bullish pin has a long lower tail that suggests the rejection of lower prices and a future uptrend.
Though one of the easiest patterns to detect, it also has a lot to say about the state of the cryptocurrency – so don’t hesitate to study it in more detail.
Ascending and Descending Triangle Pattern
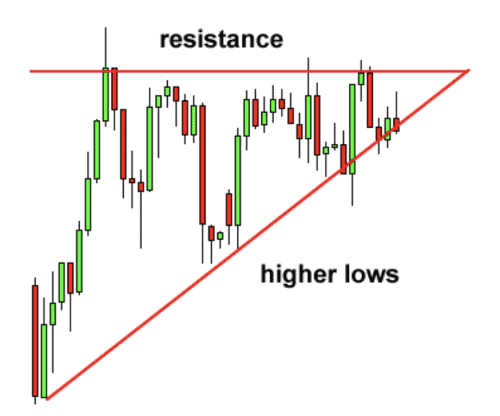
To spot this continuation figure, a trader should look at the consequence of highs and lows. Ascending triangles will define a bullish trend, and there will be two or more equal highs and a series of higher lows.
A descending triangle will be an indicator of a bearish trend, and there will be two or more equal lows with a series of lower highs.
Such patterns are usually seen as a continuation, but still, it’s advisable to wait until the breaking line appears.
Bullish and Bearish Flag Patterns

A Bullish and Bearish flag pattern has great significance for traders, as it’s a reliable (as much as it can be as a prediction) sign that a trend will continue.
This continuation pattern starts with a rectangle that faces the opposite direction of the trend.** **On the chart, it looks like a bullish-tilted line that continues in a sequence of lower highs and lower lows.
A bearish-tilted line is a consequence of higher lows and higher highs. If the high-low consequence is wide, it may grow into a Channel pattern. Such patterns are often seen after a huge drop or rise in cryptocurrency.
Rising Wedge and Falling Wedge Patterns

When there’s something similar to a triangle on a chart but with two sloping lines instead of one – it’s a sign of a wedge pattern. It comes in rising and falling forms and indicates a bearish or bullish reversal. Most frequently seen after an uptrend, they also can indicate a continuation of a downtrend or just the opposite – depending on the wedge’s direction. A rising wedge will mark the end of a downtrend, while a falling wedge suggests the end of an uptrend.
Final Thoughts
The patterns are part of a technical crypto trading analysis. If a trader wants to dig deeper, their main focus has to be on understanding the theory. The more factors that are taken into account, the more accurate the conclusions will be.
Patterns are based on historical data and have shown a good level of reliability. Still, keep a cool head: chart patterns are tools for prediction, but they never guarantee a result.
 Brave New Coin reaches 1M+ engaged crypto enthusiasts a month through our website, podcast, newsletters, and YouTube. Get your brand in front of key decision-makers and early adopters in 2026. Limited slots remaining! Find out more today!


