TRON Price Analysis – Speculation dominates, fundamentals detach

![]()
TRX has emerged as a leading short term investment option in alt markets, following a period of strong price movements driven by a series of positive TRON news stories. This momentum may continue with more good news expected for TRON in 2019, however, the lack of network fundamentals being reflected in the value of the TRX token makes genuine price discovery a challenge.
The general sentiment surrounding the TRON blockchain and its connected token TRX, has coalesced around two contrasting perspectives. One camp firmly believing the project is vaporware with value created simply through excellent marketing and PR, while the other suggests that it is a legitimate long term challenger in the platform blockchain space, with real potential to disrupt legacy systems in the digital media distribution space.
The TRX token has retained a permanent top-15 spot in BNC’s market cap table buffered by a consistent stream of positive news stories, allowing it to often buck wider market trends and negative sentiment.
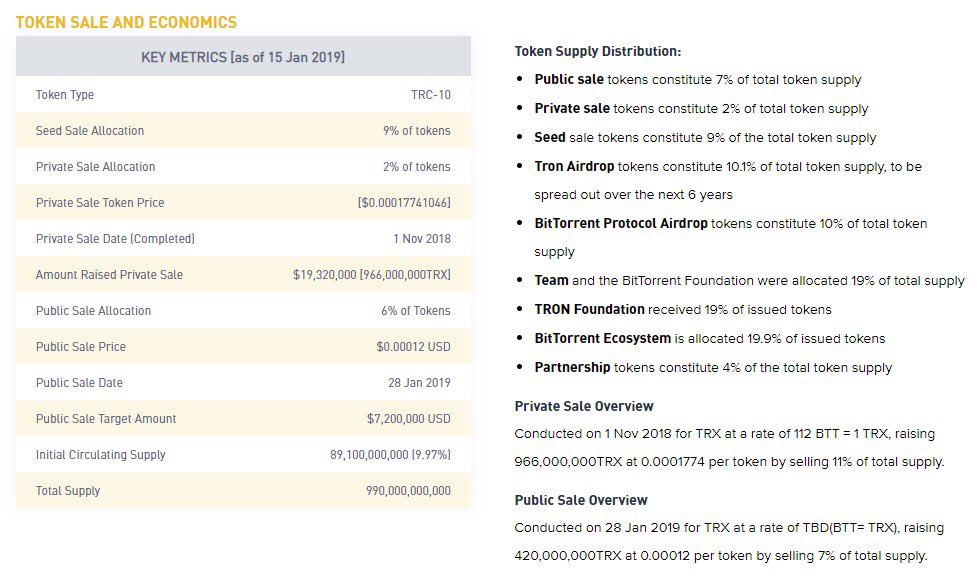
Recent drivers of buying pressure have been the announcement of an upcoming ICO sale for the Bittorrent token (BTT), which will drive new funds into the ecosystem and the TRON project team. Additional hype and new announcements came from the recently concluded NiTron annual conference, which was headlined by mainstream sporting star Kobe Bryant.
The token launch of BTT has already generated controversy because the TRON foundation will hold 20% of the total supply. Based on the initial private sale figures (2% of circulating supply sold for $19.8 million) the TRON foundation’s holdings of BTT tokens will be approximately $200 million once the tokens are issued. BTT tokens will be tradable on mega exchange Binance post launch — giving them enviable liquidity.
From Binance info report on BTT token sale
The Bittorrent token sale will likely significantly add to the TRON foundation war chest and its likely means short term reinvestment into development support. This potentially creates TRX specific trading opportunities and price action around the dates of the public sale (26th January).
Buffered by these positive speculative news events, TRX has outperformed other assets in digital markets over the last 30 days — up to ~24% vs a total market for crypto that rose ~18% in value. Crypto benchmark BTC rose by only ~2% over the same period.
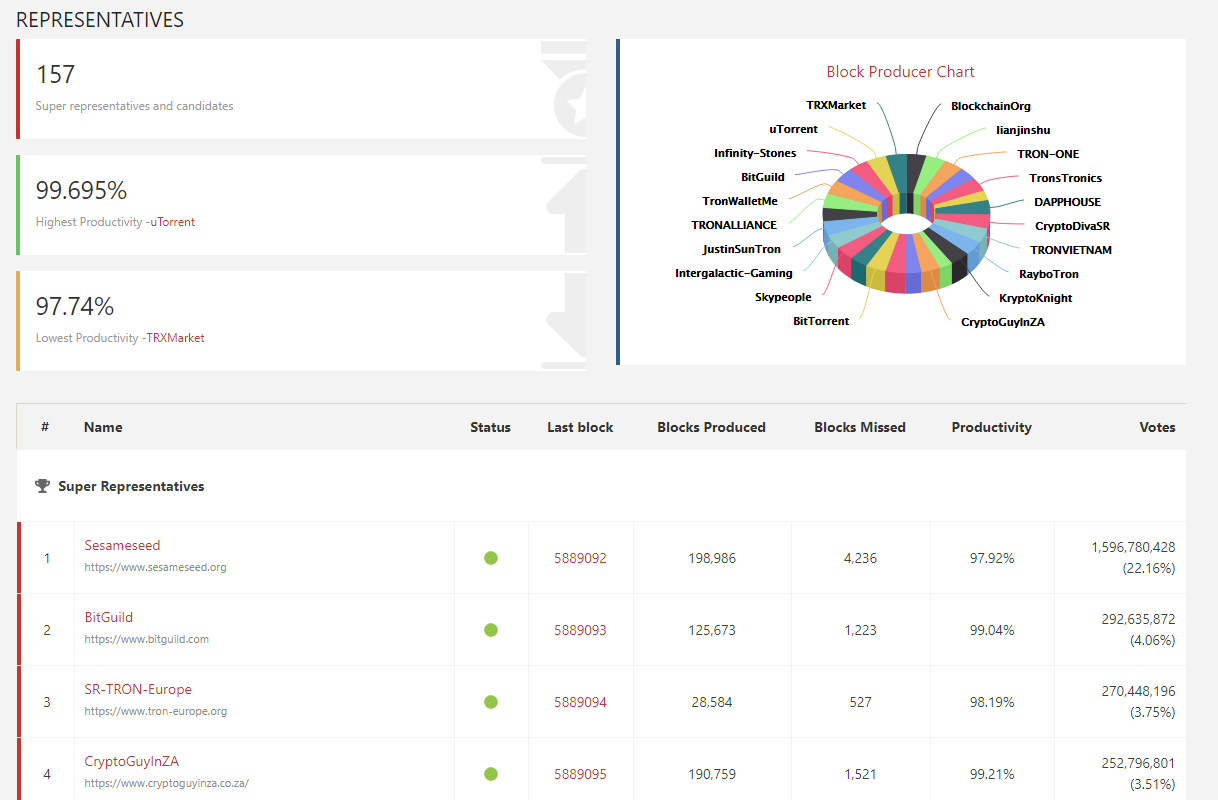
Launched in May of 2018, the TRON blockchain main network uses a unique Proof-of-Authority consensus method, where a small group of powerful block validators (Super Representatives) are voted in to their roles by the token holding community.
The tight consolidated nature of this consensus method has allowed the TRON blockchain to scale rapidly. Daily transaction count has risen a staggering 61,723% from launch to present (5.176k on 01/06/2018 to 3.2 Million on 16/01/2019) and transaction fees on the network have remained tiny despite the rising load. The network is functional, with smooth chain growth and a functioning voting economy.
Data from tronscan.org
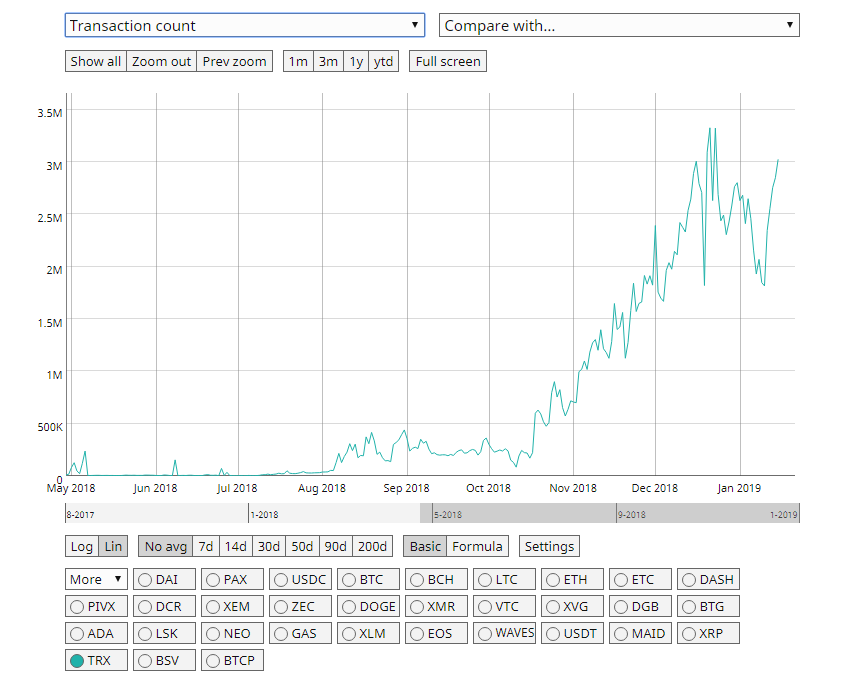
Average daily transaction count TRON network. Data from coinmetrics.io
There are, however, questions surrounding the economic value of these transactions, because of TRON’s low fees and high speeds there is a likelihood of spam transactions propagating the network.
There are a number of days in the last six months when average transaction value on the network was less than $5, and others where it was over $2 million This indicates relative immaturity of the asset, and creates challenges for price discovery. ‘Transactions’ on a smart contract capable blockchain can include anything from peer-to-peer payments to other operations like contract creation, destruction, or invocation.
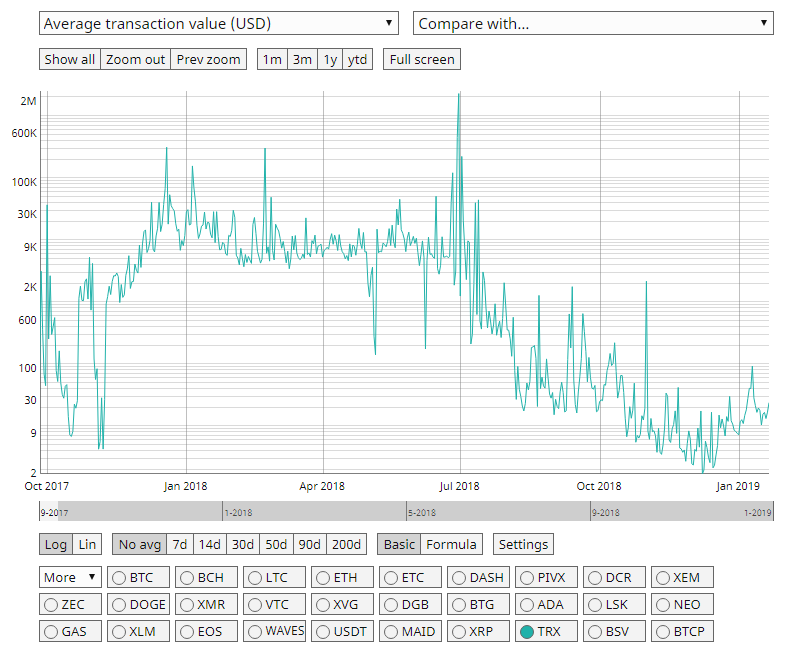
Average daily transaction value TRON network. Data from coinmetrics.io
A potential narrative, because of the crossing pattern between transaction count and average transaction volume, is that the TRON blockchain is has eventually switched to becoming a low transaction value, high transaction count platform, used frequently by a wider net of users.
As such, the most popular and voluminous Dapps on TRON are by far Gambling Dapps, characterized by zero transaction fees for users and unlimited daily transactions. Gambling Dapps make up 98% of Dapp volume on TRON and 99% of total Dapp transactions.
TRON currently has 97 functioning Dapps built on top of it. While this is dwarfed by the 1,045 built on Ethereum, it is within the ballpark of the 235 built on EOS.

Dapp data used in this analysis was collected by Dapp.com
Gambling Dapps appears perfect for a scalability focused network like TRON. As well as offering speed and low cost to users, ‘blockchain casinos’ have a significant advantage over centralized legacy alternatives in that they operate outside of traditional gambling legal restrictions and are open to a wider pool of international customers.
However, such a high proportion of network usage being allocated to gambling may not be desirable to TRX stakeholders, given the lack of mainstream legitimacy for developers in this space. Most platform blockchains tend to market themselves as being built for enterprise solutions, given the credibility and potential long term value associated with being an ‘enterprise’ project.
It is likely that the Dapp usage will spread out at as the TRON blockchain matures and more developers come to grips with how to build more complex projects using TRON. In the coming year this ratio should evolve, particularly as major Dapp releases like the Bittorrent Speed application roll out.
Bittorrent Speed
Bittorrent tokens will have utility within the Bittorrent Speed Dapp. BitTorrent Speed rewards Bittorrent users with BTT in exchange for seeding and bandwidth tasks, enabling faster downloads for other users.
The Dapp will be accessible as a widget within the popular Utorrent client and users will automatically be rewarded BTT tokens for allocating bandwidth for seeding. The longer they upload for, the more BTT tokens a user receives.
Bittorrent Speed is expected to be the ‘Killer Dapp’ of the Tron blockchain, and it is easy to see why. It will have immediate access to a large pool of potential users, it has cross mainstream appeal because of the historical relevance of Bittorrent protocol (meaning pull for new blockchain users) and solves a classic problem aligning the incentives of downloaders and seeders within the Bittorrent protocol.
Launch of Bittorrent Speed is likely to drive speculative buying momentum for the TRX token because of the long term ecosystem implications of the Dapp and its potential to drive Smart Contract operations and transactions.
However, scalability and other factors also need to be considered. Former Bittorrent executive Simon Morris who handled operations at Bittorrent for over 10 years, recently stated in an interview that there is no way that the TRON network would be capable of safely handling the transaction volume of the Bittorrent network and suggested that TRON is working around this barrier using marketing jargon to mislead investors.
Most Bittorrent users will likely not use the paid incentive token model, and prefer the more straightforward ‘free’ torrent model which will remain operational alongside the Bittorrent Speed Dapp. There may also be legal challenges because of the large amounts of copyrighted media content that moves around the Bittorrent file distribution network.
The Tron foundation and Justin Sun may feel they are protected from legal trouble because they only own the Bittorrent protocol and don’t control what users upload. However, users and torrent uploaders such as The Pirate Bay have been targeted in the past within specific jurisdictions for copyright infringement, affecting the ease of finding and downloading files on Bittorrent. This means there is likely some inherent associated risk when participating in the Bittorrent protocol which in turn may affect the long term value of BTT and by association the TRON blockchain.
Onchain Metrics
All onchain assessments for TRX are made with data post mainnet launch. TRX switched to operating on native blockchain on the 31st of May, having previously functioned as an ERC20 smart contract token on Ethereum. The new network functions with different fees, consensus and speeds to the Ethereum blockchain and has radically affected fundamental assessments.
NVT Signal
Derived from the NVT ratio, the NVT signal is a responsive blockchain valuation metric developed by Willy Woo and Dmitriy Kalichkin. Crypto markets are prone to bubbles of speculative purchasing, not backed up by underlying network performance and activity. The NVT signal provides some insight into what stage of this price cycle a token may be in.
A high NVT signal is indicative of a network that is going through one of these bubble periods, and may move towards a position of becoming overbought/overvalued, because of the market’s speculative assessments running out of steam.
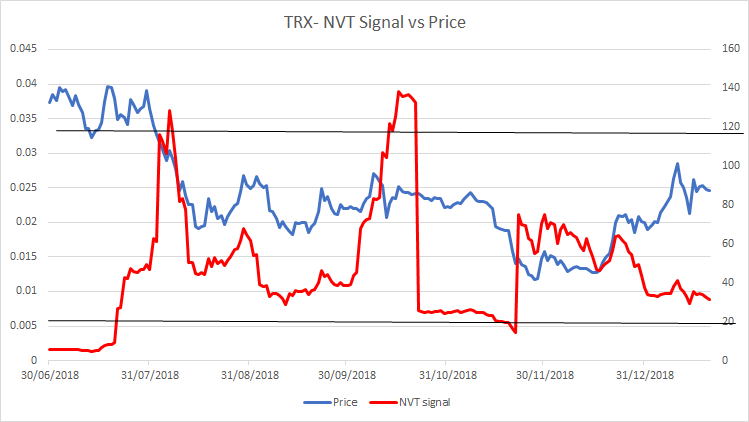
TRX NVT signal and price. NVT signal calculated with data from Coinmetrics.io. Adjusted onchain transaction volume used for NVT signal.
Despite some smoothing using a 30-day moving average, the NVT signal for TRX appears highly erratic. This indicates highly inconsistent onchain volumes, bouncing between extremely high in comparison to market value to very low compared to market value, often just between 2 days.
This erratic pattern makes the TRX NVT signal a challenging tool to assess whether the network’s token is oversold/undersold based on onchain volume movements. Sharp falls in NVT signal have put very little downward momentum on price and sharp upturns have not added any forward momentum on price.
As mentioned earlier, the price of TRX has performed very strongly over the last month, rising an impressive ~24% in a bearish market. Conversely, NVT signal has fallen sharply over the same period suggesting that despite rising price TRX is approaching an oversold region based on qualitative fundamentals.
However, historical signals indicate that there is a disconnect between onchain fundamentals and TRX traders are better off trading based on technical and speculative signals.
PMR signals
Metcalfe’s law is a measure of connections in a network, as established by Robert Metcalfe the founder of Ethernet. It has subsequently been used to analyze the true value of network-based financial products like Facebook and Bitcoin, and by comparing it to price, can provide a useful tool to assess whether a token is over or undervalued.
It is also a more straightforward metric to implement versus onchain transaction volume, which can be challenging to measure accurately in USD terms. Addresses are measured as the number of unique sending and receiving addresses participating in transactions daily.
This makes it a relatively transparent metric as compared to onchain volume. However, there may be a question of the granularity of the data, and who controls these addresses, particularly on a low fee transaction network like TRON.
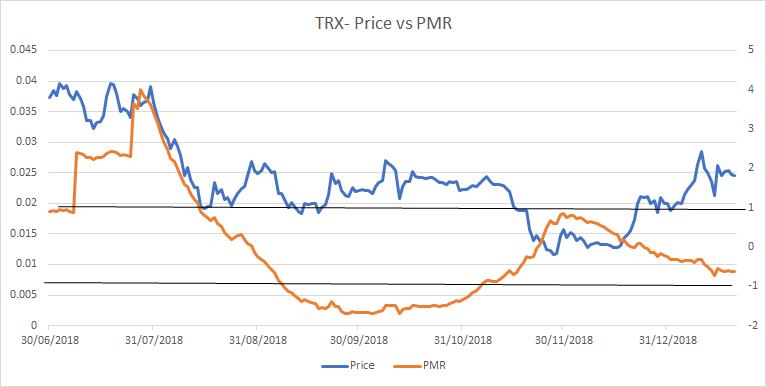
TRX Kalichkin PMR and price.PMR signal calculated with data from Coinmetrics.io. Active Addresses^2 used for PMR.
Similar to NVT signal there is a disconnect between PMR and the price of TRX, though not quite as starkly detached as NVT signal. There appears to be very little connection between PMR and price of TRX, meaning that the number of active addresses is likely not presently a factor in the price of the TRX .
The pattern of a low PMR coinciding with higher PMR is not what one would expect, with undersold and oversold indicators appearing to function in opposite to the norm.
The PMR pattern over the last month suggests that while price has risen quickly, active addresses have risen even faster, suggesting that TRX may be approaching an oversold inflection and further short run price gains. However, historical patterns suggest a somewhat random relationship between price and PMR.
Network transaction volume to active addresses ratio (TAAR)
Network transaction volume to active addresses ratio or TAAR, is a recently developed equilibrium valuation metric from Pugilist Ventures’ Christopher Brookins. TAAR combines ”quantity and quality” of network network activity into a single metric.
Fundamental expectations would suggest that when TAAR and price are closely distributed, price (valuation) and fundamentals are aligned in equilibrium.
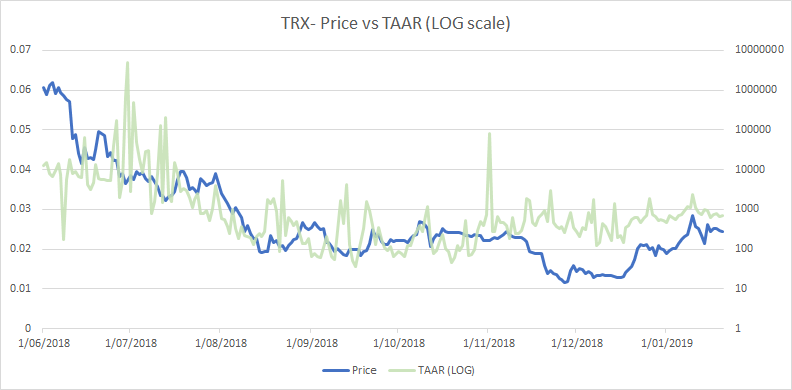
TRX TAAR (Transaction/Active Address ratio) and price.TAAR calculated with data from Coinmetrics.io.
The LOG-scaled TAAR suggests some detachment between the price of TRX and fundamental activity on the TRON network. For a period around July/August there appears to have been a closer relationship between the speculative and fundamental value of TRX, with a similar pattern indicated for NVT and PMR signal over the period.
However, TAAR begins to detether from price as the year progresses and there remains a gap between the two (although shrinking), suggesting a mismatch between the fundamental and traded value.
Like PMR and NVT suggest, TRX traders are likely better off trading based of speculative signals sent by news events & announcements, and technical analysis, as opposed to price movement signals sent by onchain indicators.
Technical analysis
Moving Averages and Long Term Trends
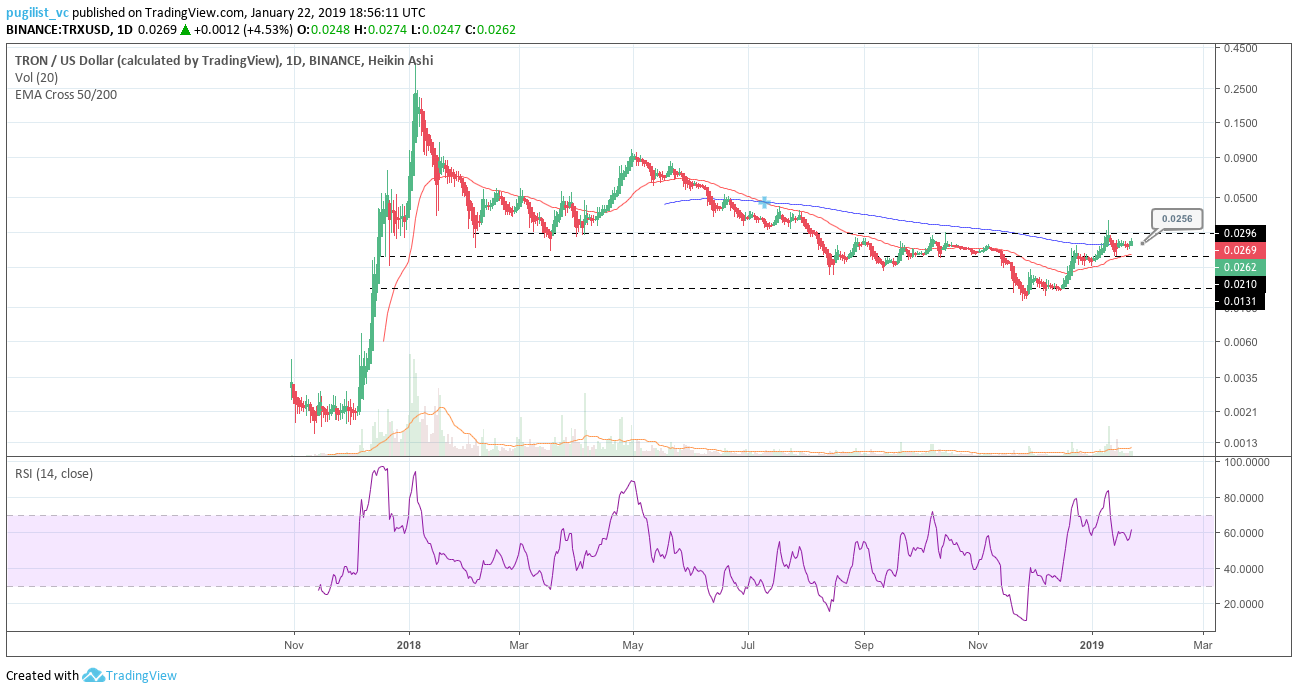
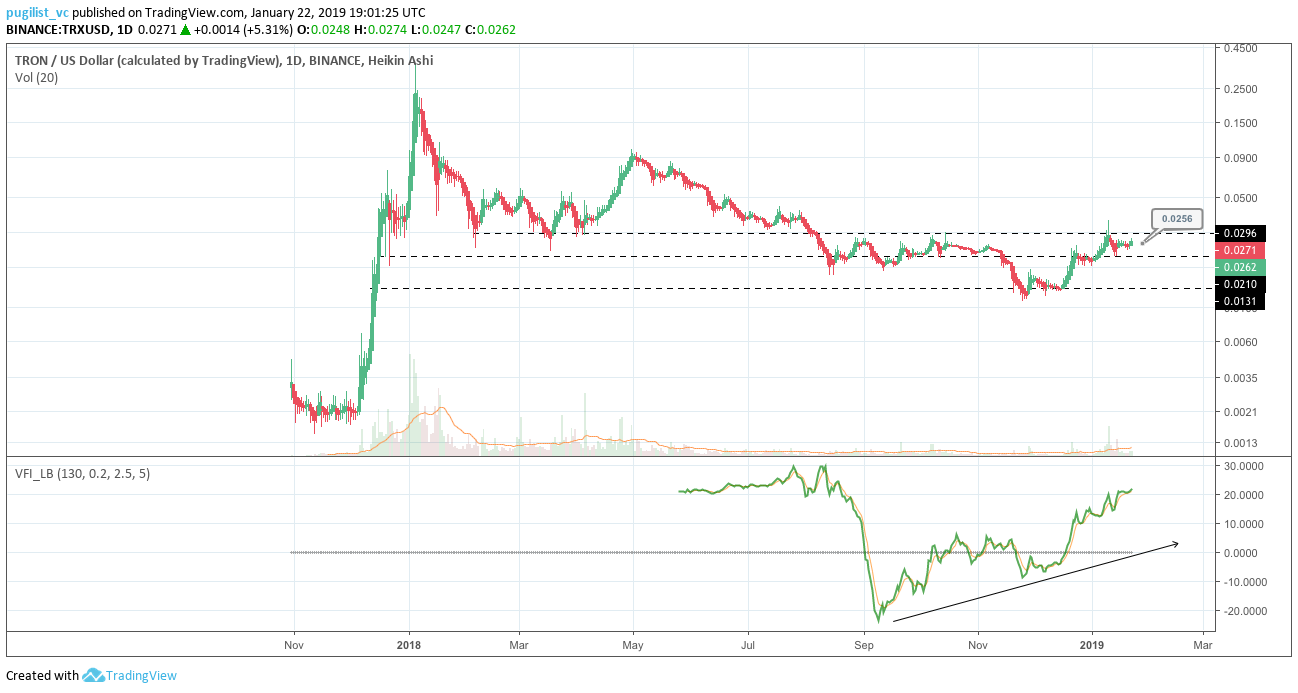
On the 1D chart, the death cross, using the 50 and 200 day EMAs, has persisted since early July 2018. The 200 day EMA (blue line) around $0.026 is currently acting as resistance, but may evolve into support if the positive price momentum holds.
Since the beginning of 2018, the price of TRX has been contained within a negative linear price trend with a Pearson’s R Correlation between time and price of ~0.67 (not shown). Despite TRX’s pronounced bearish trend, buying demand remained high until it plummeted back in late August to early September 2018, visualized by the volume flow indicator (VFI). Since then, the VFI has been consistently trending upward (black arrow), which is a bullish indicator for buying volume in the near term. The VFI interpretation is a value above 0 is bullish and below 0 is bearish, with divergences between price and oscillator being high probability signals.
Ichimoku Clouds with Relative Strength Indicator (RSI)
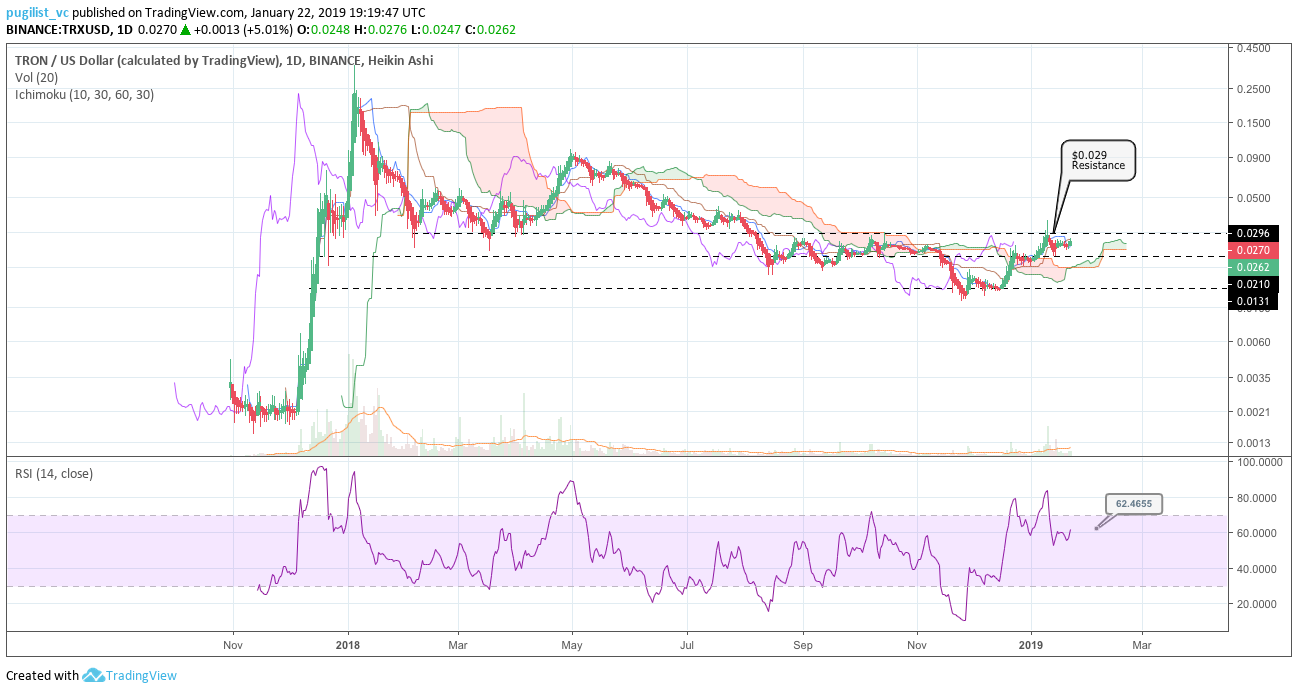
The Ichimoku Cloud uses four metrics to determine if a trend exists; the current price in relation to the Cloud, the color of the Cloud (red for bearish, green for bullish), the Tenkan (T) and Kijun (K) cross, Lagging Span (Chikou), and Senkou Span (A & B).
The status of the current Cloud metrics on the 1D frame with singled settings (10/30/60/30) for quicker signals is bullish; price is above the Cloud, Cloud is bullish, the TK cross is bearish, and the Lagging Span is above the Cloud and price.
A traditional long entry would occur with a price break above the Cloud, known as a Kumo breakout, with price holding above the Cloud. From there, the trader would use either the Tenkan, Kijun, or Senkou A as their trailing stop.
January 7, 2019, TRX completed a Kumo breakout and currently sits at $0.027. Price is consolidating, but further gains still seem plausible. The main obstacle being the resistance level of $0.029, which price has already failed twice to breach above. Furthermore the RSI is currently nearing overbought conditions at 62, but still trending upward. The RSI metric and slowing momentum make it likely that the prior resistance level of $0.029 will hold for now. However, if price does manage to continue its Kumo breakout, the price targets are $0.035 and $0.04. Price support levels are $0.021, $0.018, and $0.013.
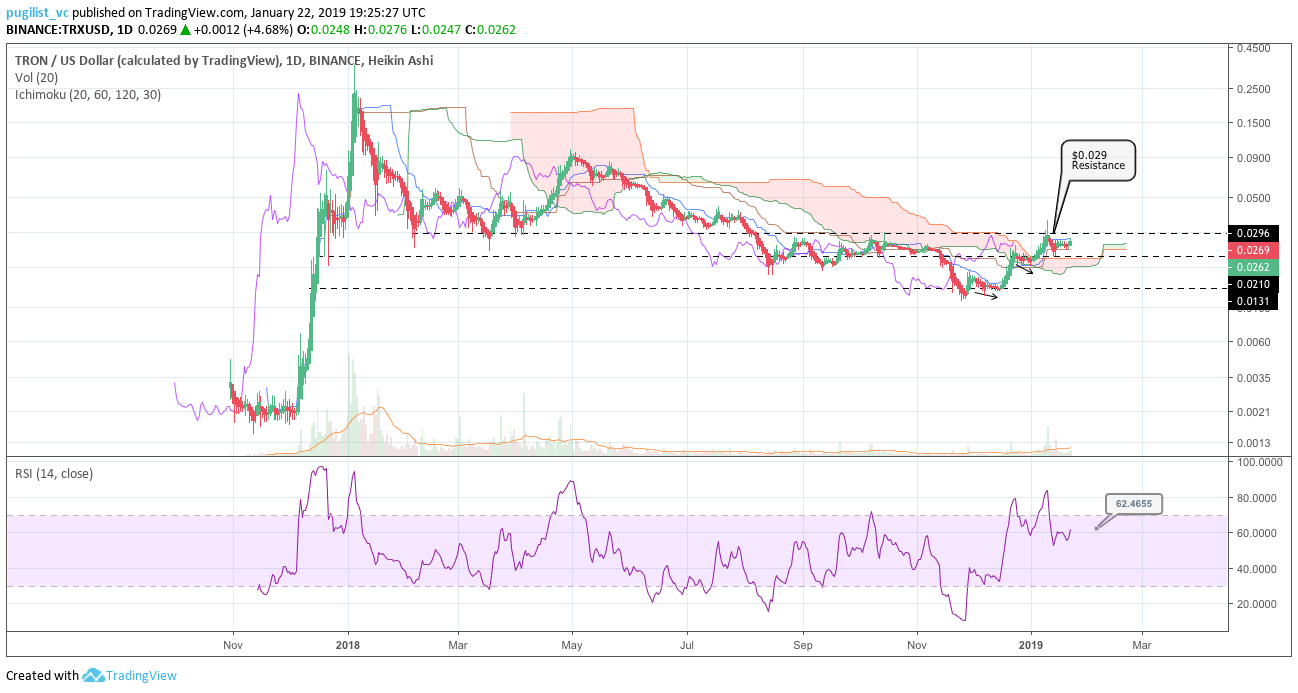
The status of the current Cloud metrics on the 1D time frame with doubled settings (20/60/120/30) for more accurate signals is bullish; price is above the Cloud, Cloud is bullish, the TK cross is bullish, and the Lagging Span is in the Cloud and above price.
As on the slower settings, price has completed a successful Kumo breakout, but currently consolidating. However, price has consolidated two times (black arrows) prior during this up move dating back to December 2018, thus this time might be similar. If so, the key will be price breaking above and holding the $0.029 resistance level, which will result in the same price targets of $0.035 and $0.04.
Conclusion
Based on a range of evidence, TRX is an immature asset fundamentally. Price appears to be detached from onchain volume movement and active address growth. As such, the TRON blockchain likely has most of its value driven by news events and moves made by traders on exchanges.
This makes TRX a risky investment until it matures and more fundamentals are represented in the token value. Currently, buying decisions have to be made based on the expected market reaction to news events and announcements, as opposed to indicators of tangible value.
This considered, recent news surrounding TRON has been good — driving value and buying pressure back into the TRX token, making it stand out in altcoin markets. With the launch of a much hyped ‘killer app’ (that has already excited investors based on BTT token sales), due later in the year, there may be continued underlying speculative momentum supporting TRX through the first half of 2019.
The long term technicals for TRX have been bearish since 2018, while short term technicals in 2019 are looking bullish for the time being. The negative headwinds that could affect price are failure to breach above $0.029 resistance, which may coincide with RSI entering overbought territory.
Both, the prudent short term trader (10/30/60/30) and longer term trader (20/60/120/30), on the 1D chart, would enter a long position given the current Kumo breakout, with both trader’s support levels and price targets being $0.021, $0.018, and $0.013; and $0.035 and $0.04; respectively. More risk averse traders may await price to break and hold above $0.029 resistance before entering a long position, while still maintaining the aforementioned price targets.
 Brave New Coin reaches 1M+ engaged crypto enthusiasts a month through our website, podcast, newsletters, and YouTube. Get your brand in front of key decision-makers and early adopters in 2026. Limited slots remaining! Find out more today!


