XRP Price Prediction: Elliott Wave Setup and Descending Trendline Breakout Offer Hope as XRP Tests $1.30
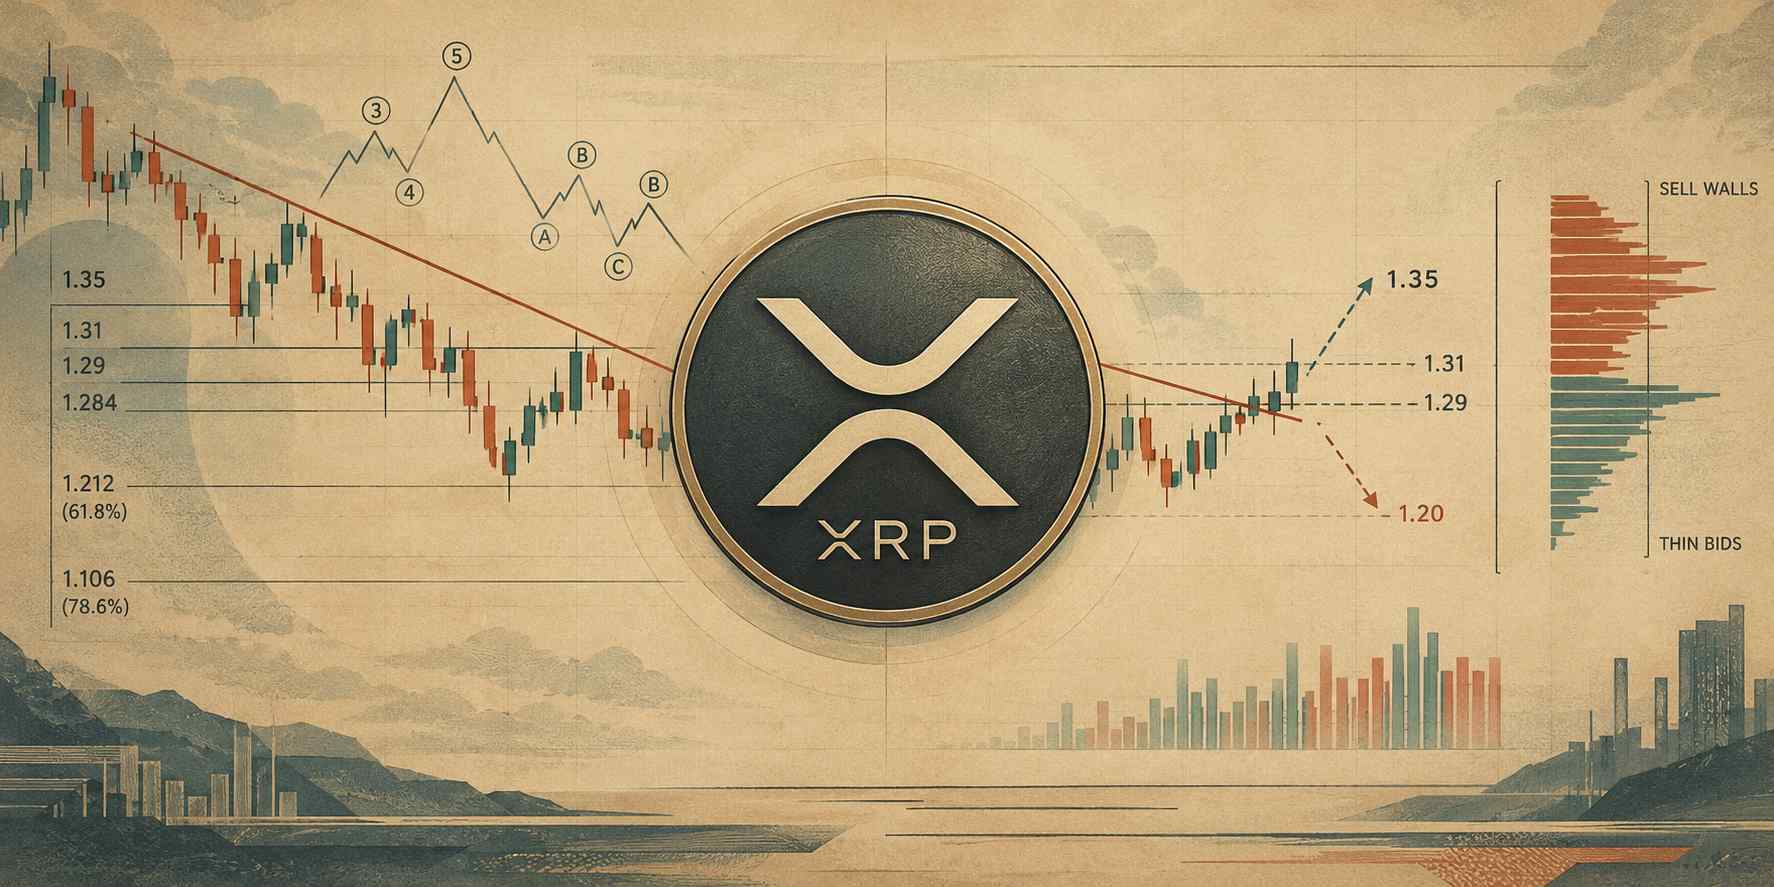
XRP is testing a critical technical zone near $1.30 as traders watch for a descending trendline breakout and confirmation of a potential Elliott Wave recovery.
However, resistance and weakening order-book demand continue to complicate XRP’s near-term outlook.
The current price forecast hinges on whether buyers can reclaim $1.31 and sustain upward momentum. A successful move could open the way toward $1.35, while a breakdown below nearby support would bring lower Fibonacci retracement levels into focus.
XRP Price Tests $1.31 as Buyers Attempt a Trendline Breakout
XRP’s latest price action reflects a market searching for direction after a sustained October pullback. Historical data from CoinGecko shows the token closing at $1.29 on October 17, down from $1.41 on October 11. The decline followed a rejection near $1.50 earlier in the month.
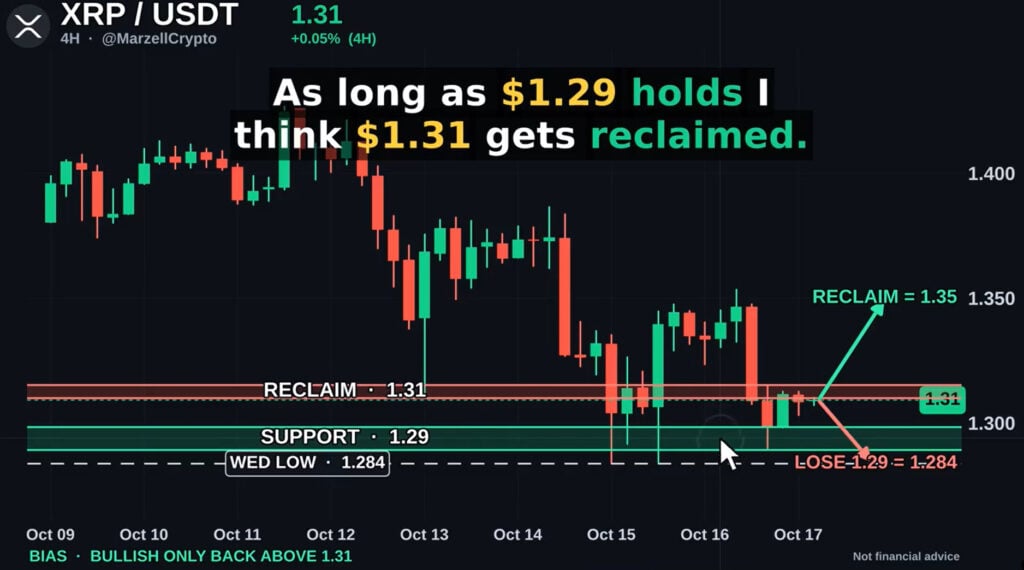
XRP failed to hold $1.31 resistance on October 16 but rebounded from a $1.29 wick on overnight buying. Source: @MarzellCrypto via X
The recovery attempt remains limited. Crypto analyst @MarzellCrypto highlighted XRP’s failure to maintain a position above $1.31 on October 16. The four-hour chart showed the price briefly falling toward $1.29 before overnight buying helped it recover.
The analyst identified $1.31 as the immediate level buyers need to reclaim. A sustained move above this threshold could put $1.35 in focus, while a break below $1.29 would expose the deeper support near $1.284.
As of October 19, XRP was trading around $1.31, according to historical market data.
This places the cryptocurrency close to the resistance level identified in the short-term analysis, but the proximity alone does not confirm a breakout.
The current setup resembles earlier periods of consolidation in which XRP struggled to establish support after a decline. In a previous XRP price analysis published by Brave New Coin, analysts also identified the $1.30 area as an important level to monitor following rejection from higher resistance.
Elliott Wave Analysis Highlights $1.21–$1.30 Support
A separate technical assessment from crypto analyst @Morecryptoonl focuses on the possibility of a descending trendline breakout. The analyst shared a one-hour XRP/USD chart from MCO Global Research featuring an Elliott Wave structure, with numbered waves and an ABC corrective pattern.
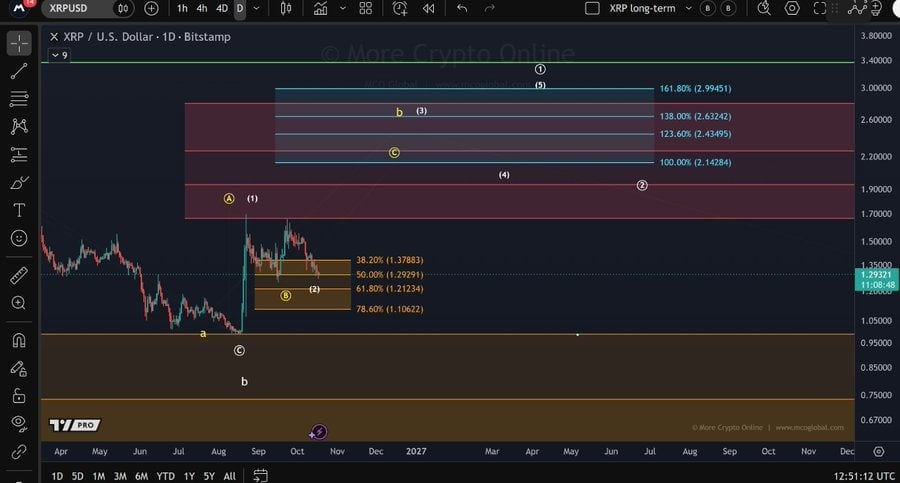
Elliott Wave analysis suggests XRP needs a strong bullish reaction at current support to confirm the 1-2 setup and potential upward impulse. Source: @Morecryptoonl via X
The chart shows XRP testing a downward-sloping resistance line while trading near $1.30. Such a breakout could indicate that selling pressure is easing, but confirmation would require a sustained move above the trendline rather than a brief intraday push.
The analysis also identifies several Fibonacci retracement levels that could influence the next move:
- $1.293: The 50% retracement level, close to the recent trading range.
- $1.212: The 61.8% retracement level, which could become relevant if near-term support fails.
- $1.106: The 78.6% retracement level, representing a deeper downside reference.
These levels provide potential areas of support rather than guaranteed price floors. Their significance depends on XRP’s reaction as the price approaches each zone.
In a separate daily-chart analysis, @Morecryptoonl argued that XRP needs a clear bullish reaction from its current support area to validate a potential Elliott Wave 1–2 setup. Under this interpretation, the recent decline could represent a corrective phase before another upward impulse.
However, Elliott Wave analysis is interpretive. Different analysts can assign different wave counts to the same price structure, and the proposed recovery remains unconfirmed until price action supports it.
A sustained hold above the $1.29–$1.30 region would strengthen the immediate stabilization case. Conversely, a decisive break below this zone could shift attention toward $1.21 before the lower $1.106 Fibonacci level comes into consideration.
XRP Faces Overhead Selling Pressure as Order-Book Demand Weakens
While the trendline and Elliott Wave setups offer a potential recovery scenario, order-book conditions present another obstacle.
Crypto analyst @Xaif_Crypto highlighted sell orders concentrated above XRP’s current price near $1.30, alongside thinning buy orders below the market. The analysis suggests that buyers may struggle to push the price higher if available demand cannot absorb the selling pressure.
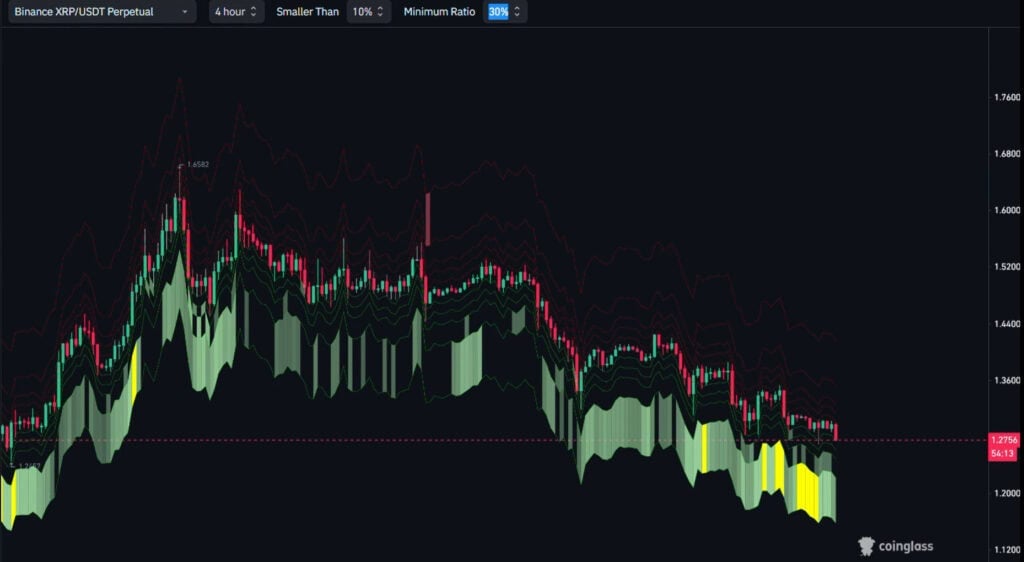
XRP faces heavy sell walls near $1.30 and weakening bids below, raising the risk of a drop toward $1.20 support without stronger buying pressure. Source: @Xaif_Crypto via X
Order-book liquidity represents the limit orders available to buy or sell an asset at different prices. A concentration of sell orders can create short-term resistance, although these orders may be canceled or changed before execution. It is therefore not a reliable standalone indicator of future price direction.
According to @Xaif_Crypto’s assessment, weakening buying pressure could expose XRP to a retest of $1.20 support. That level also sits close to the $1.212 Fibonacci retracement identified in the Elliott Wave analysis, making the area relevant across both technical approaches.
The analyst has also expressed a longer-term bullish view, comparing XRP’s potential to Google’s early development in 2003 and pointing to possible institutional adoption. However, that comparison represents an investment thesis rather than evidence that XRP will follow a similar growth trajectory.
For the immediate XRP price prediction, the distinction between short-term trading pressure and longer-term expectations is important. Institutional adoption may influence demand over time, but it does not remove the near-term risks created by resistance, declining momentum, or insufficient buying liquidity.
Macro Outlook and Bitcoin Could Influence XRP’s Next Move
XRP’s technical structure is only one factor shaping its near-term outlook. Broader cryptocurrency market conditions, particularly Bitcoin’s direction, could also affect whether the token maintains its current support.
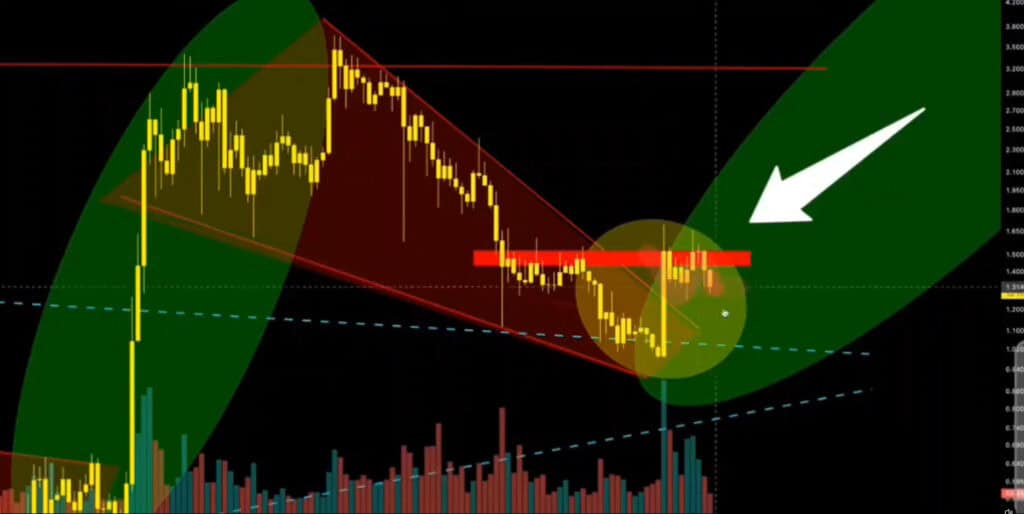
XRP faces strong resistance at $1.50–$1.60 and the descending 50-week EMA, with repeated rejections signaling near-term caution. Source: ChartNerdTA via X
ChartNerdTA has identified resistance between $1.50 and $1.60, where the price has struggled alongside the descending 50-week exponential moving average (EMA). The analyst also warned that a close below the 20-week EMA near $1.34 could increase the risk of a deeper retracement toward $1.00–$1.10.
The analysis identifies Bitcoin falling below $83,000 as another potential source of downside pressure. A decline in the largest cryptocurrency can weaken sentiment across the broader market, although XRP does not necessarily follow Bitcoin’s movements at the same pace or magnitude.
The lower support range could eventually develop into a double-bottom formation if XRP revisits the area around $1.00–$1.10 and subsequently rebounds. Such a pattern requires two distinct lows near a similar price level, separated by a recovery. It cannot be confirmed simply because the price approaches a previous low.
This scenario is consistent with the broader support-and-resistance framework discussed in Brave New Coin’s earlier XRP analysis, which examined the importance of reclaiming resistance before a sustained recovery could develop.
For now, the macro picture remains conditional. Bitcoin’s direction, broader risk appetite, and the response to XRP’s nearby technical levels will help determine whether buyers can establish a more durable recovery.
XRP Price Prediction: $1.35 Upside or $1.20 Downside?
The immediate XRP price forecast depends on how the market responds around $1.29–$1.31. The descending trendline breakout attempt and Elliott Wave structure provide a potential recovery framework, but neither has yet established a confirmed bullish reversal.
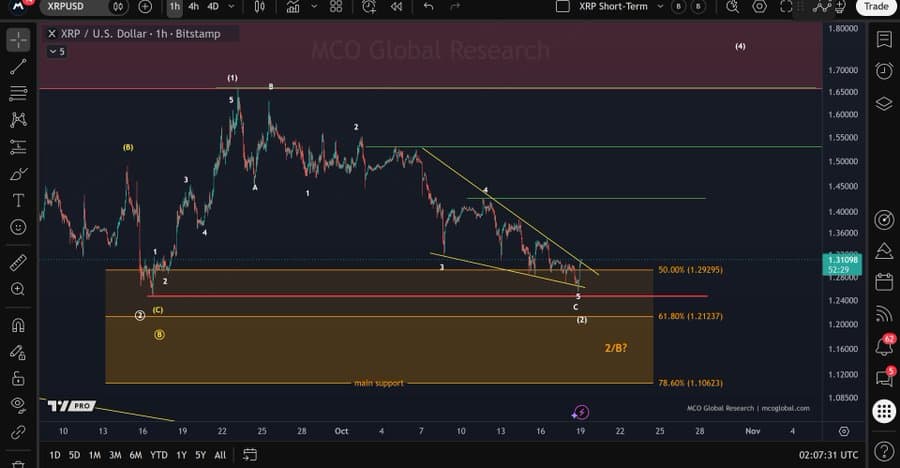
MCO Global Research’s 1-hour XRP/USD chart shows price testing a breakout above a key descending trendline, with Elliott Wave labels outlining the projected market structure. Source: @Morecryptoonl via X
On the upside, reclaiming $1.31 and holding above it would provide an initial sign of improving momentum. A subsequent move toward $1.35 would bring the next nearby resistance area into focus. Stronger volume and sustained trading above the breakout zone would help support the bullish interpretation.
On the downside, a failure to defend $1.29 could weaken the short-term structure and put $1.284 in focus. Further selling could bring the $1.21–$1.20 region into view, followed by the lower Fibonacci reference near $1.106 if bearish pressure persists.
The broader technical outlook remains more cautious. Repeated rejection from the $1.50–$1.60 region and the descending 50-week EMA suggest that XRP still faces resistance on higher timeframes. A move back toward $1.00–$1.10 remains a downside scenario if the 20-week EMA near $1.34 fails to hold, rather than an established outcome.
Ultimately, the XRP price prediction hinges on confirmation rather than the appearance of a bullish chart pattern alone. A sustained trendline breakout could improve the recovery outlook, while a loss of nearby support would shift attention toward lower price levels. Until either move develops, the price remains at a technical crossroads near $1.30.
 Brave New Coin reaches 1M+ engaged crypto enthusiasts a month through our website, podcast, newsletters, and YouTube. Get your brand in front of key decision-makers and early adopters in 2026. Limited slots remaining! Find out more today!