Zcash (ZEC) Price Prediction: Whale Goes Long Before FOMC Announcement as H&S Pattern Puts $1,350 in Focus
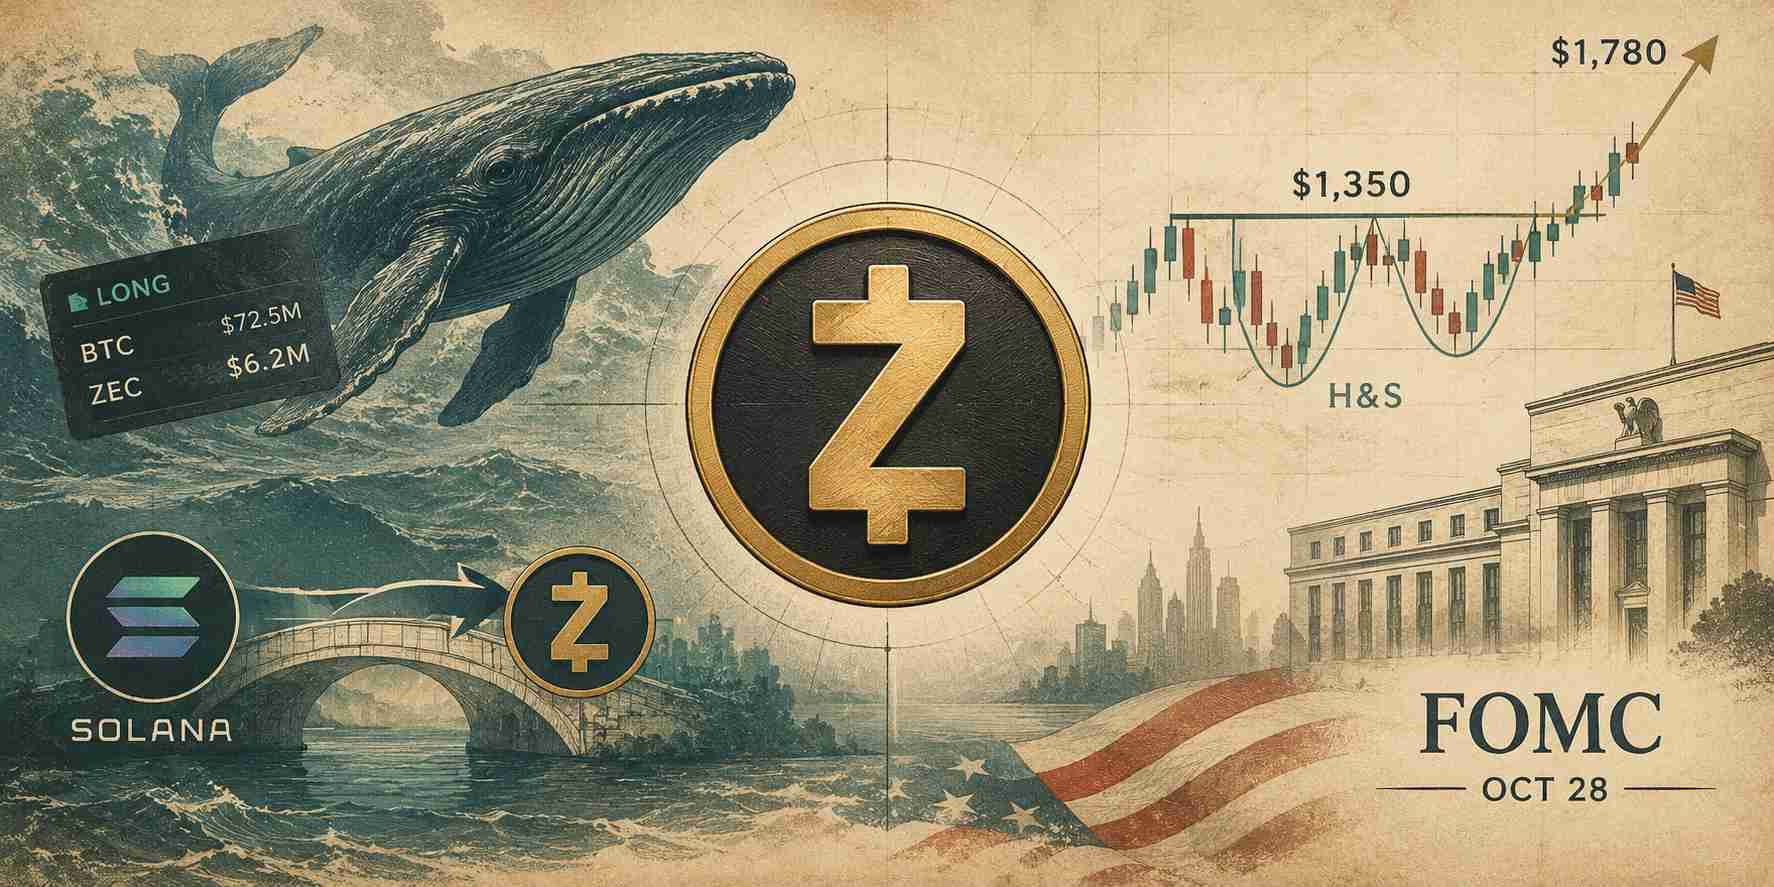
Zcash (ZEC) is approaching a key resistance zone as a prominent crypto whale builds a multimillion-dollar leveraged long position ahead of the Federal Reserve’s October 28 interest rate decision.
Traders are watching whether Zcash price can break above $1,350, potentially confirming a bullish chart pattern and opening the way toward higher targets.
ZEC recently traded around $1,280–$1,313 following a strong recovery. Improving technical indicators, rising adoption of bridged ZEC on Solana, and the upcoming Federal Open Market Committee (FOMC) announcement have brought renewed attention to the cryptocurrency.
Whale Opens $6.2 Million ZEC Long Before FOMC Announcement
A prominent crypto whale has reportedly opened a leveraged position worth approximately $79 million across Bitcoin (BTC) and Zcash. The exposure includes $72.5 million in BTC and $6.2 million in ZEC, with nearly $1 million in unrealized gains ahead of the Fed announcement.
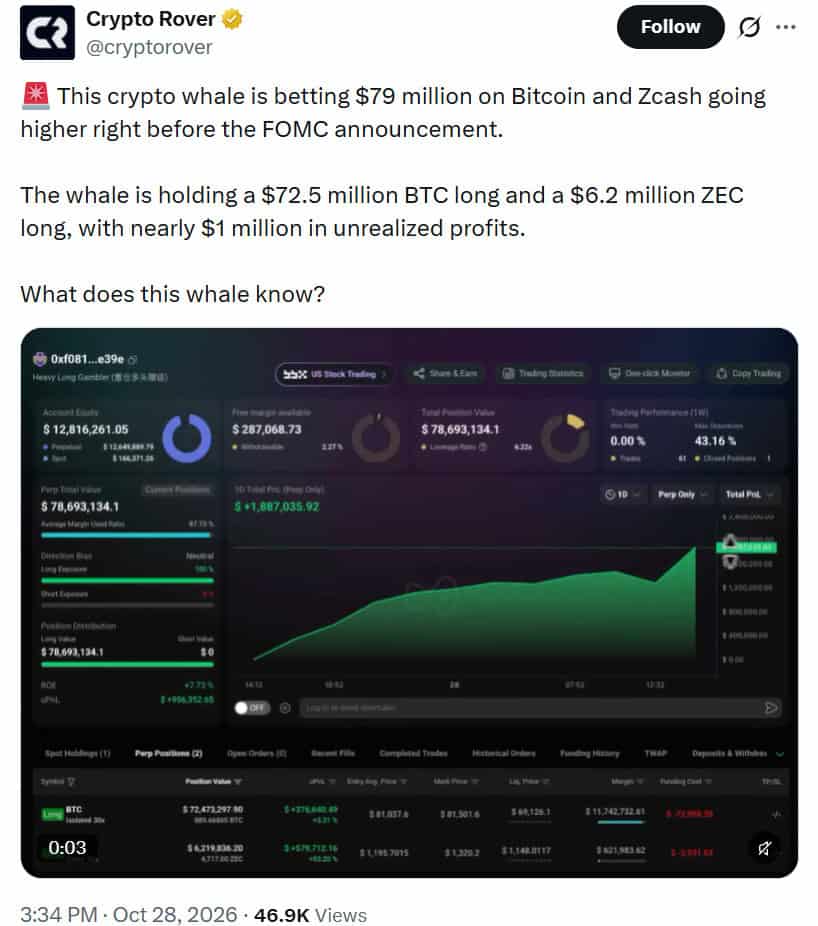
A prominent crypto whale opened a $79 million leveraged long position in Bitcoin and Zcash, recording nearly $1 million in unrealized gains ahead of today’s FOMC meeting. Source: @cryptorover via X
The timing has drawn attention because interest rate expectations can influence demand for risk assets. A rate hold accompanied by a less restrictive policy outlook could support cryptocurrency prices, although the whale’s positioning does not guarantee a rally.
The Federal Reserve entered the October 28 meeting with its target federal funds rate at 3.75%–4.00%, following a 25-basis-point rate increase in September, according to the supplied market context. Investors are watching the policy statement and Chair Kevin Warsh’s press conference for signals about future rate decisions.
For ZEC, the immediate question is whether buying pressure can push the price through resistance. Leverage can amplify gains but also increase liquidation risks during sharp reversals, making the whale’s position a market signal rather than confirmation of a bullish trend.
ZEC Price Prediction: Inverse Head-and-Shoulders Pattern Puts $1,350 Resistance in Focus
An analysis shared by X user @MstrTranquility identifies a potential inverse head-and-shoulders pattern on ZEC’s daily chart, with a neckline near $1,350 and a projected target of $1,780 if a breakout is confirmed.
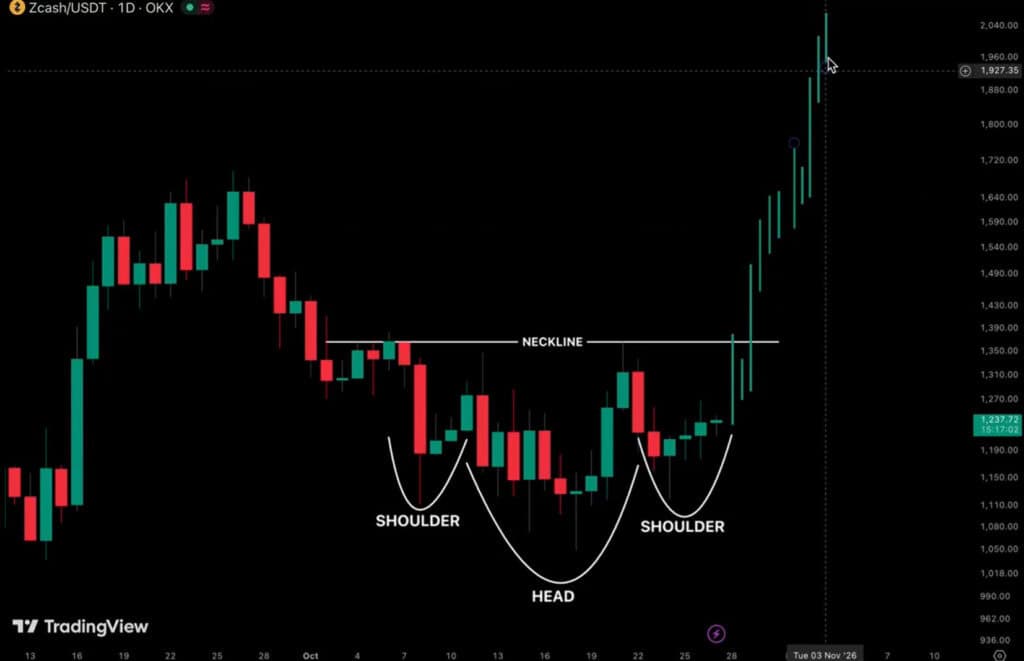
Zcash is forming a daily inverse head-and-shoulders pattern, with a breakout above the $1,350 neckline potentially targeting $1,780. Source: @MstrTranquility via X
The bullish formation typically consists of three troughs, with the middle trough forming the deepest low. A sustained move above the neckline can signal strengthening buying pressure, but a brief spike above resistance may not be enough to validate the pattern.
The analysis also emphasizes accepting failed setups objectively. If ZEC falls back below the neckline, the bullish formation may remain incomplete. Traders are therefore watching for a sustained close above $1,350 rather than relying on an intraday move.
Zcash Technical Analysis: Bullish Momentum Faces Key Resistance
ZEC’s technical indicators show improving momentum, although several resistance levels remain ahead. The supplied TradingView data places the daily Relative Strength Index (RSI) around 53–55, indicating moderate bullish momentum without reaching the commonly watched overbought threshold near 70.
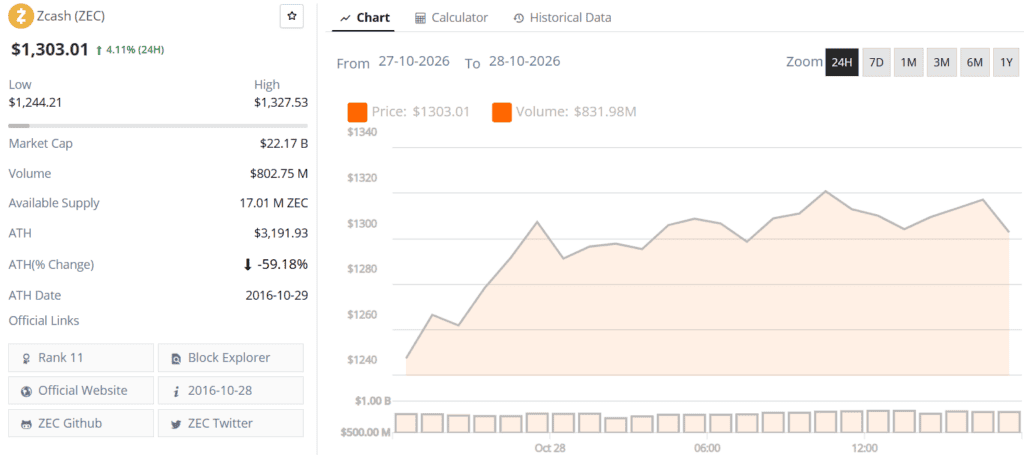
Zcash (ZEC) price chart. Source: Brave New Coin
The daily Moving Average Convergence Divergence (MACD) histogram is positive, while price remains above many key moving averages. These signals support a constructive outlook but do not rule out a pullback after the recent recovery.
Immediate resistance sits around $1,317–$1,339, followed by $1,350–$1,364. A sustained daily close above the latter zone could bring $1,386 and $1,397 into focus, with further technical resistance near $1,470.
On the downside, $1,264 is a key near-term support. A daily close below this level could expose the $1,187–$1,200 area, followed by $1,058–$1,090.
Volatility remains elevated, with the supplied Average True Range (ATR) near $106–$113. This reinforces the need to account for potentially large price swings when managing positions and setting stop-loss levels.
Zcash Forms Another Descending Wedge on the Weekly Chart
A separate analysis by TradingView contributor VincePrince identifies a developing descending wedge on ZEC’s weekly chart. The analysis describes the token trading above a rising trendline that has supported previous pullbacks.
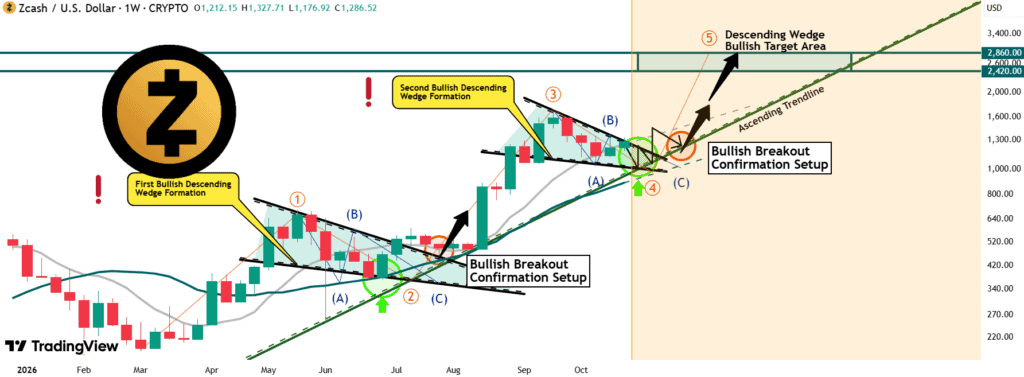
Zcash’s descending wedge breakout triggered a strong bullish rally from the ascending trendline, which remains a key technical support level. Source: VincePrince on TradingView
According to the contributor, an earlier descending wedge preceded a strong upward move, while a new formation could provide another breakout opportunity. A move above the upper trendline would be needed to strengthen this bullish scenario.
Descending wedges form as price swings narrow between downward-sloping trendlines. They are often viewed as bullish when price breaks above the formation, but confirmation depends on actual price action.
This weekly setup differs from the daily inverse head-and-shoulders pattern. Both suggest potential upside, but neither guarantees a rally. If ZEC clears $1,350 and holds the level during subsequent pullbacks, higher resistance zones could come into focus. Failure to break through could leave the token trading within its current range.
Zcash Adoption Grows as Bridged ZEC on Solana Hits Record
Zcash adoption is also expanding across blockchain networks. The amount of ZEC bridged to Solana reached approximately 103,000 tokens, valued at around $124 million, by late October. Most arrived through NEAR’s OmniBridge, according to the supplied reports.
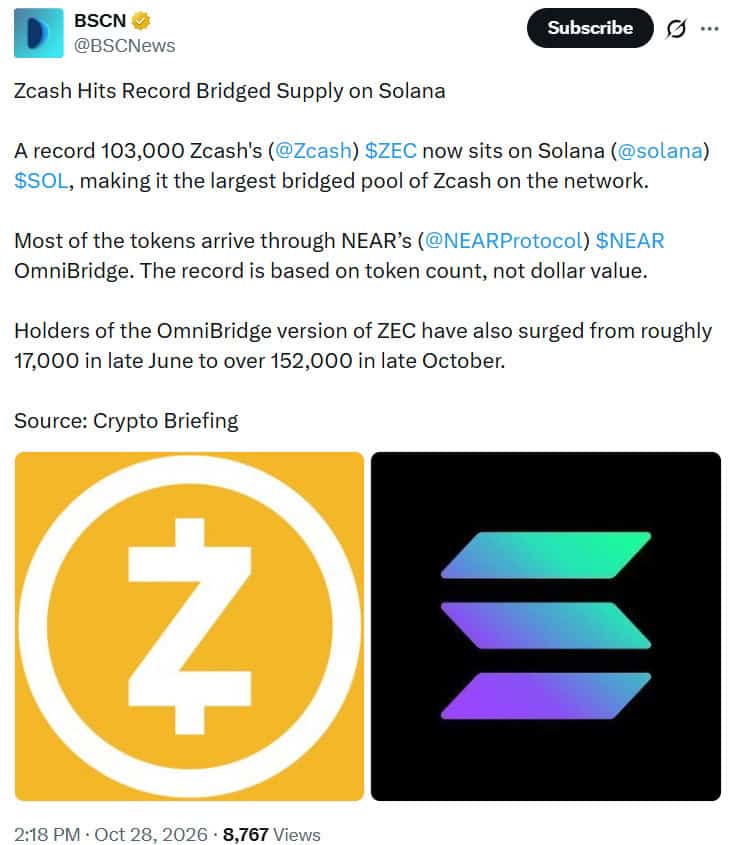
Zcash bridged to Solana has reached a record 103,000 ZEC worth approximately $124 million, with most tokens transferred through NEAR’s OmniBridge. Source: @BSCNews via X
Holders of the OmniBridge version of ZEC increased from roughly 17,000 in late June to more than 152,000 by late October, representing nearly ninefold growth. The increase suggests broader participation in Solana’s trading ecosystem rather than activity driven solely by large holders.
Solana has become a significant venue for ZEC decentralized exchange trading. However, bridged ZEC does not automatically retain Zcash’s native privacy features. As an SPL token on Solana, its balances and transactions are publicly visible. Users must distinguish between this representation and shielded transactions on Zcash’s native network.
Growing bridged supply and holder numbers indicate increased participation, but they do not independently establish future price direction. Adoption metrics need to be assessed alongside liquidity, trading activity, and broader market conditions.
Zcash Price Outlook: FOMC Decision and $1,350 Breakout Remain Key
ZEC’s near-term direction depends on the Fed’s policy guidance, leveraged positioning, and its ability to overcome resistance. A less restrictive outlook could support risk assets, while persistent inflation concerns or signals of tighter policy could weigh on sentiment.
With the federal funds target range at 3.75%–4.00%, investors are focused on whether the Fed’s statement and press conference offer clues about future rate decisions. The outcome could influence crypto-market volatility, although its effect on ZEC will depend on how traders interpret the announcement.
A sustained breakout above $1,350 would strengthen the technical outlook, placing $1,386–$1,397 in focus. The inverse head-and-shoulders analysis identifies $1,780 as a potential target if the pattern confirms.
Conversely, rejection at resistance or a break below $1,264 would weaken the immediate bullish setup and expose lower support levels. For now, improving momentum and growing bridged-token participation support market interest, but the $1,350 resistance zone and the Fed’s guidance remain key factors in determining ZEC’s next move.
 Brave New Coin reaches 1M+ engaged crypto enthusiasts a month through our website, podcast, newsletters, and YouTube. Get your brand in front of key decision-makers and early adopters in 2026. Limited slots remaining! Find out more today!