NEM Price Analysis – NEM 2.0 Testnet, SYMBOL, now Live

![]()
A number of technical and fundamental indicators lean strongly bullish for XEM, while the launch of its new 2.0 blockchain, Symbol, brings additional functionality and potential use cases to the project.
New Economy Movement (XEM) or ‘NEM’, was launched in March 2015 with the Proof-of-Importance (PoI) consensus model. The cryptocurrency is down 97% from the January 2018 all-time high of US$2.11 but up nearly 100% from the December low. The total market cap is US$432 million, with US$8.34 million traded over the past 24 hours.

Watch a summary of this analysis on YouTube
The NEM total supply is nine billion, all minted during the genesis block, with no additional tokens will be created. The project went on to raise 66.2 Bitcoin (BTC) and 419,697 Nxt (NXT), or about US$150,000, through a “call for participation.” XEM tokens were sold for an average price of 0.05 BTC and 450 NXT. Overall, about 200 individuals participated in the pre-launch public auction. Another 71% of the total coins were released via a stakeholder community distribution.
In 2016, the non-profit Singapore-based NEM Foundation was created to further NEM development and introduce, educate, and promote the use of the NEM blockchain technology platform to industry and institutions across the globe. In August 2018, the NEM community approved the creation of NEM Ventures, which is funded by the NEM Community Fund. The Fund is an investment vehicle for traunched funding tied to measurable, clear milestones which promote the NEM ecosystem.
In January 2019, the Foundation announced a pause of operations while the organization was restructured to be less promotional and more product-focused and revenue-driven. The new structure included the election of a new governance council, a process that occurred on the NEM blockchain. Alex Tinsman was elected president of the foundation and brings over ten years of market experience as well as almost two years of experience as the regional head of the NEM Foundation’s North American operations.
The NEM community was subsequently asked to vote on a NEM Foundation funding proposal, asking for 160 million tokens, about US$7.5 million at that time. Of the 573 people who voted on the proposal, 90% supported the foundation’s request. The proposal gave the Foundation and NEM Labs 210 million XEM for operating expenditure, in a budget that runs until February 2020.
After the restructuring of the Foundation, Q1 and Q2 were focused on development and future NEM protocol upgrades, collectively named Catapult, and recently rebranded to Symbol. The Foundation spent a total of US$1.77 million in Q1 2019, most of which was employee pay, operation fees, and contract fees. A Q2, Q3, or Q4 executive summary could not be obtained.
Source: https://forum.nem.io/t/nem-foundation-q1-roi-executive-summary/23012
NEM Ventures is another discrete division within the group, with its own unique governance and budgets. The Ventures division operates in a similar manner to a traditional VC/equity firm. Ventures undertakes the sourcing, screening and funding startups with the potential to enhance and compliment the NEM ecosystem.
Ventures have also announced an investment in Internet of Distributed Ledger Technologies (IoDLT), a B2B blockchain and IoT-based startup which utilizes IoT and NEM Catapult. Other investments include; Vimba, a portfolio company, Ample, a DLT to tokenize energy consumption rights at the user level, and Mobi, a ridesharing app.
The NEM blockchain consists of two components; the node, or NEM Infrastructure Server (NIS), and a client used for node interaction. The blockchain uses Proof of Importance (PoI) to determine which nodes are eligible to add a block to the blockchain, a process NEM calls “harvesting.” Any nodes which harvest blocks receive the transaction fees for that block. The total transaction fees collected per day, in USD, has declined significantly since January 2018 and is currently just under US$40 per day.
Source: CoinMetrics
PoI aims to improve on Proof of Stake (PoS) by identifying which accounts support the network, as opposed to just hoarding coins. The NEM blockchain does this by creating a PoI score based on three metrics; vesting, transaction partners, and the number and size of transactions in the last 30 days.
A NEM account must first have 10,000 XEM in their balance to be scored, which is similar to masternodes on other PoS chains. The higher the number of vested coins, the higher the account’s PoI score. Additionally, PoI only counts coins that have been in an account for a set number of days.
NEM went on to announce a discrete supernode program in December 2016. Each masternode requires three million XEM, with a disbursed daily payment of 70 XEM split between any working supernodes. Currently, 490 addresses qualify.
A PoI score also increases when users make transactions with other NEM accounts on the network. Users cannot game the network by trading back and forth, as the algorithm only accounts for the net transfers over time. Each transaction, above a minimum size, also increases the PoI score, with large and frequent transactions having a greater impact.
Other features of the NEM blockchain include; a notary, reputation scoring, namespaces, smart assets, and multi-signature transactions. The notary system, Apostille, can be used to make timestamps by creating data-specific transaction keys. The peer-to-peer reputation system, Eigentrust++, monitors the past behavior of nodes within the network and ensures confidentiality as well as authenticity of transactions.
Namespaces use a domain naming system similar to the internet’s centralized ICANN domain name system. Within namespaces, there are higher level domains and subdomains, allowing one entity with one domain to create many different subdomains for different projects or outside business accounts. Smart Assets are similar to Ethereum’s ERC-20 protocol, and allows users to create mosaics which can represent any asset.
According to the NEM rich list, the top 100 accounts own 65% of all tokens, which includes several exchange wallets and developer funds. The top account, labeled “Post-V1 Fund – 400 – Fund stakes”, holds 900 million XEM, or 10% of all tokens in circulation. The Japanese exchange Zaif holds the most XEM amongst exchanges, with 855 million XEM in a cold storage wallet and 204 million XEM in a hot storage wallet, or a combined 10.6% of all tokens in circulation. In September 2018, Zaif was hacked for US$60 million in Bitcoin, Bitcoin Cash, and MonaCoin. No XEM funds were stolen. In total, 15% of all XEM in circulation sits in known exchange wallets
Source: nemnodes.org/richlist
In January 2018, Coincheck, another Japanese exchange, experienced losses totalling US$534 million after hackers were able to steal the private key for the exchange’s XEM hot wallet. Then NEM Foundation president Lon Wong dubbed the hack "the biggest theft in the history of the world", exceeding the Mt. Gox hack by US$50 million. All 260,000 affected Coincheck customers were compensated for the loss at a rate of 88.54 JPY per NEM token, lower than the 110 JPY value at the time of the heist. Overall, Coincheck returned US$435 million to customers using the exchange’s own funds.
Initially, the NEM Foundation added a tracking mosaic to monitor the stolen funds to reduce the ability to liquidate the funds, but this label was removed from the network in late March. Although forking the network was an option to restore the funds, the NEM Foundation felt this was a non-starter considering the theft was an exchange security breach and not the fault of the NEM blockchain. To date, there have been no suspects named in any investigation into the theft.
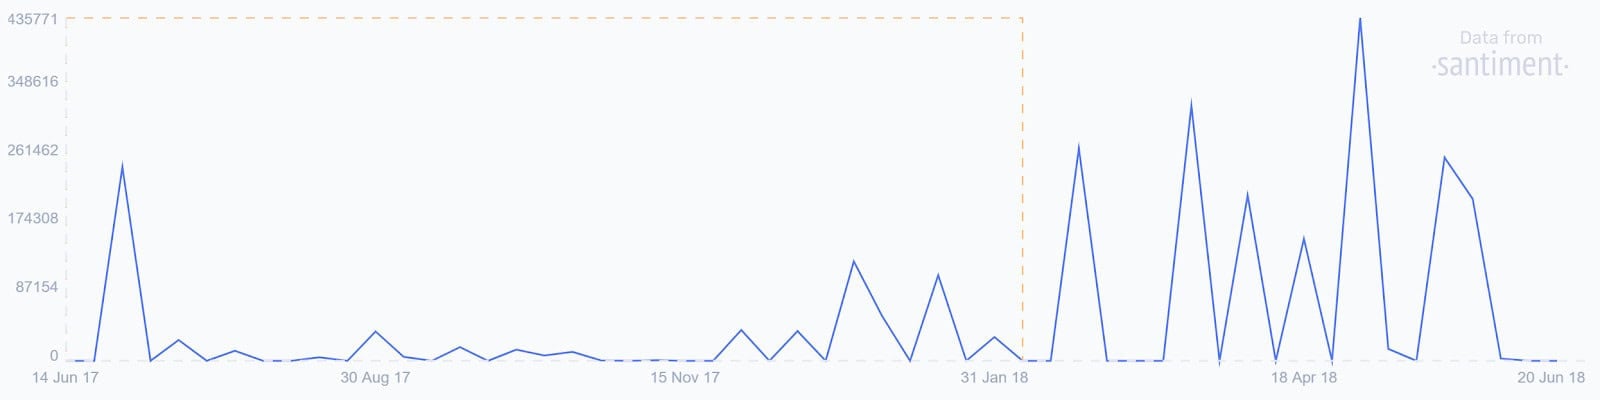
The NEM network has 390 nodes, 90% of which are using the latest version 0.6.97. Most of the nodes reside in Germany, the U.S., and Japan. The current number of transactions per day (line, chart below) has ranged wildly over the past year but now sits at an all-time high on the monthly average. Transactions per day reached a record high of nearly 67,000 in April 2019.
The average transaction value per day (fill, chart below) has fallen from the high of US$5.36 million in January 2018 to a low of US$35. Since mid-2018, average transaction values have mostly ranged from US$100 to US$1,500. The average transaction fee has fallen dramatically over the course of 2018 and early 2019, from US$8.00 in March 2017 to US$0.0031 currently (not shown).

Source: CoinMetrics
The 30-day Kalichkin network value to estimated on-chain daily transactions (NVT) ratio (line, chart below) fell dramatically from 350 to 30 from November to January, suggesting increased utility over this time period. Inflection points in NVT can be leading indicators of a reversal in an asset’s value. A clear downtrend in NVT suggests a coin is undervalued based on its economic activity and utility, which should be seen as a bullish price indicator.
Monthly active addresses (MAA) have seen a gradual but sustained rise since early 2016, and are currently just below 3,500 (fill, chart below). This metric is also on the higher end of the historic range, having reached a record high of over 10,000 in May 2019. Active and unique addresses are important to consider when determining the fundamental value of the network using Metcalfe’s law.
XEM has substantially fewer daily active addresses than most coins, suggesting that a sudden rise in addresses would likely paint a bullish picture for the asset. In comparison, Bitcoin and Ethereum currently have 735,000 and 262,000 MAAs respectively.
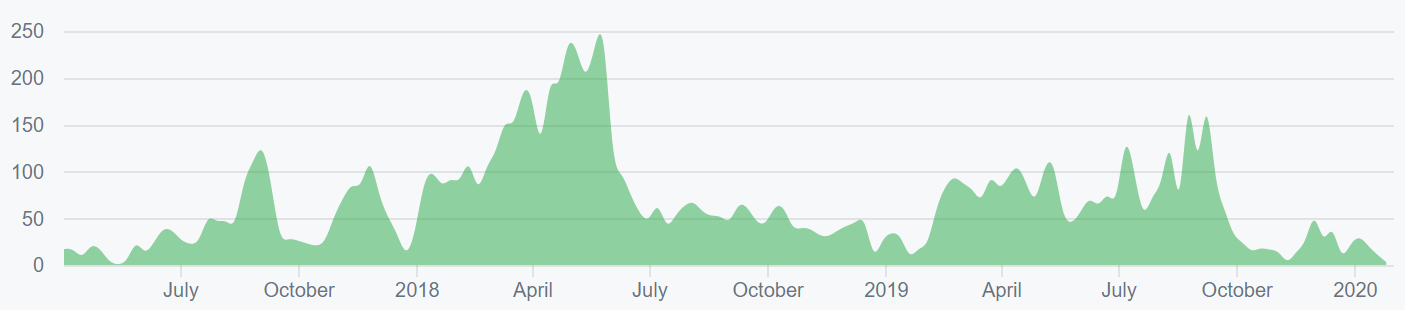
Source: CoinMetrics
Turning to developer activity, the NEM project has two GitHub accounts, NEM project and nemtech. Nemtech has 31 repos and now acts as the NEM2 codebase going forward (charts below). Most coins use the developer community of GitHub where files are saved in folders called "repositories," or "repos," and changes to these files are recorded with "commits," which save a record of what changes were made, when, and by who. Although commits represent quantity and not necessarily quality, a higher number of commits can signify higher dev activity and interest.
The next update aims to bring improved scalability, aggregated transactions, and faster transaction times. Berlin-based Grégory Saive will be leading development for the NEM2 project, which currently has a detailed roadmap through early 2020. The first iteration of Catapult, codename Elephant, was published in June, and has a PoS+ algorithm implementation. A Catapult testnet, which has rebranded to “Symbol” launched on November 27th. The mainnet launch will include a token migration, adjusted tokenomics, and an inflationary rewards mechanism.

Source: Github – catapult-rest
Source: Github – catapult-server
Source: Github – nem2-cli
Source: Github – nem2-sdk-typescript-javascript
Source: Github – nem2-openapi
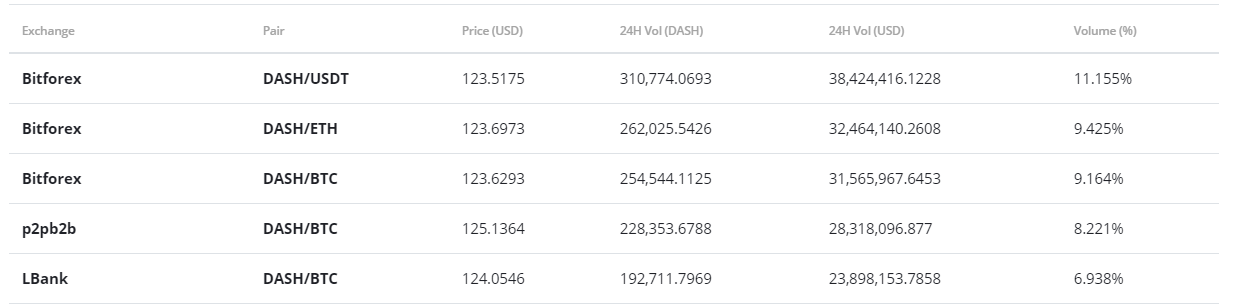
In the markets, XEM exchange traded volume in the past 24 hours has been led by the Bitcoin (BTC) and Tether (USDT) denominated markets. Both the Japanese Yen (JPY) and Korean Won (KRW) pairs hold a higher percentage of volume than most coins. The majority of XEM exchange trading, on exchanges with verified volume, has occurred on OKEx and Binance. Custody solutions include the native NEM wallet, NanoWallet, or hardware wallets such as Trezor.
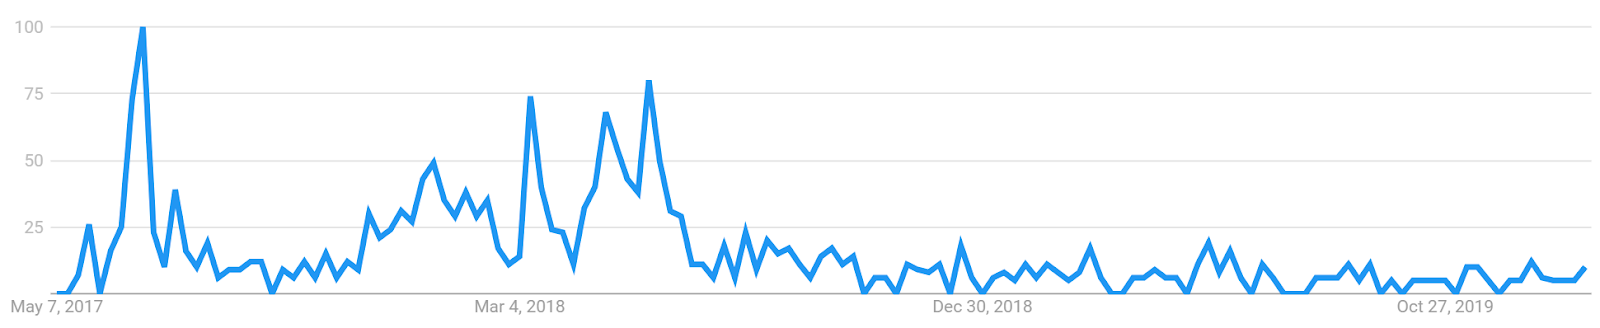
Google Trends data for the search term "NEM" has dropped substantially since mid-2018. A slow rise in searches for "NEM" preceded the bull runs in 2016 and 2017, likely signaling a large swath of new market participants at that time. A 2015 study found a strong correlation between google trends data and BTC price whereas a 2017 study concluded that when U.S. Google "Bitcoin" searches increased dramatically, BTC price dropped.

Technical Analysis
As a bullish reversal builds for the first time since June, roadmaps for price can be found on high timeframes using Exponential Moving Averages, Volume Profile Visible Range, and the Ichimoku Cloud. Further background information on the technical analysis discussed below can be found here.
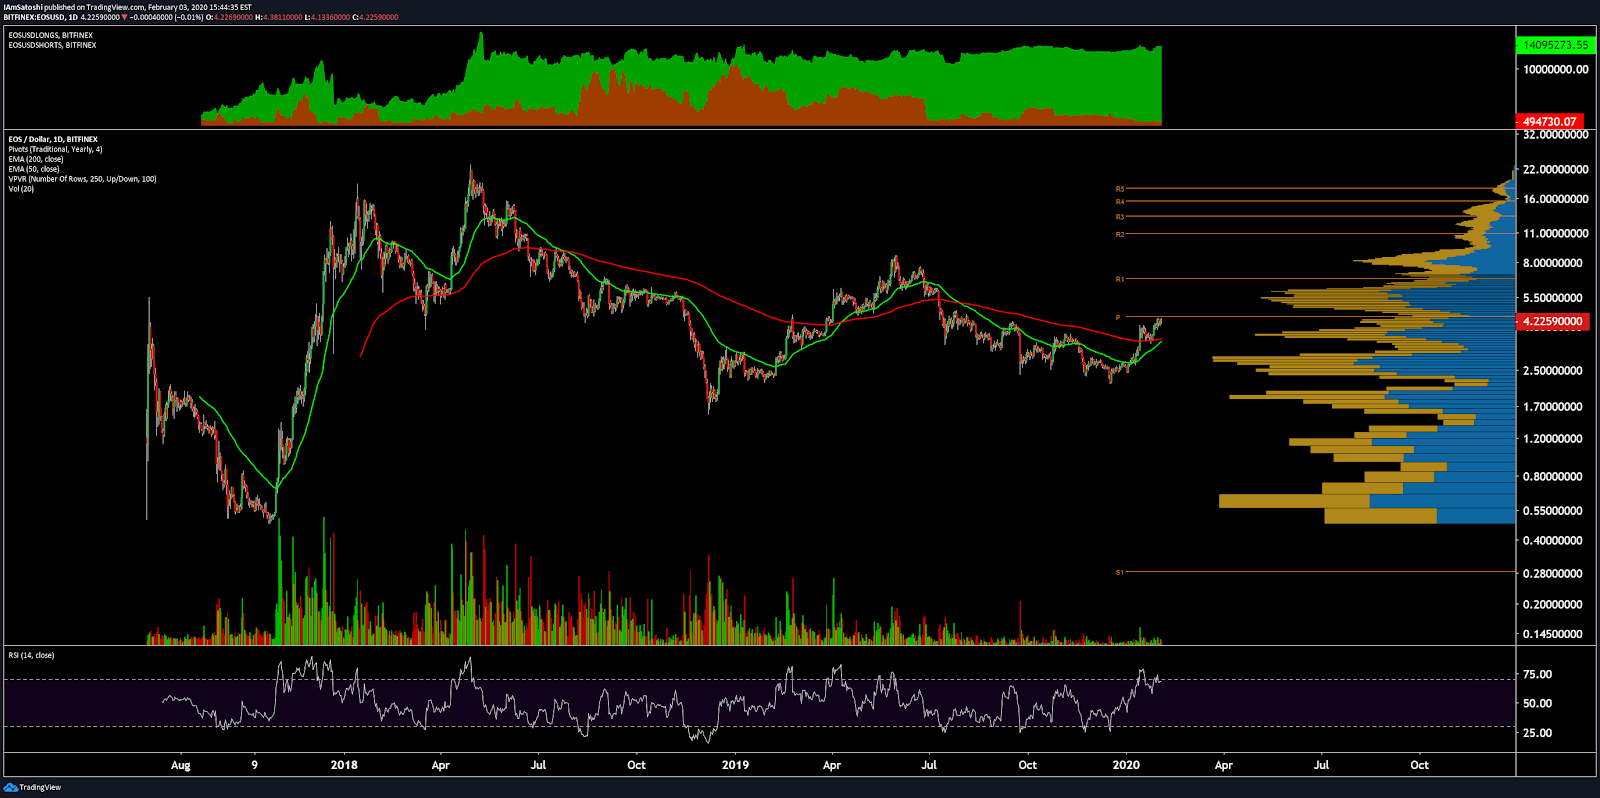
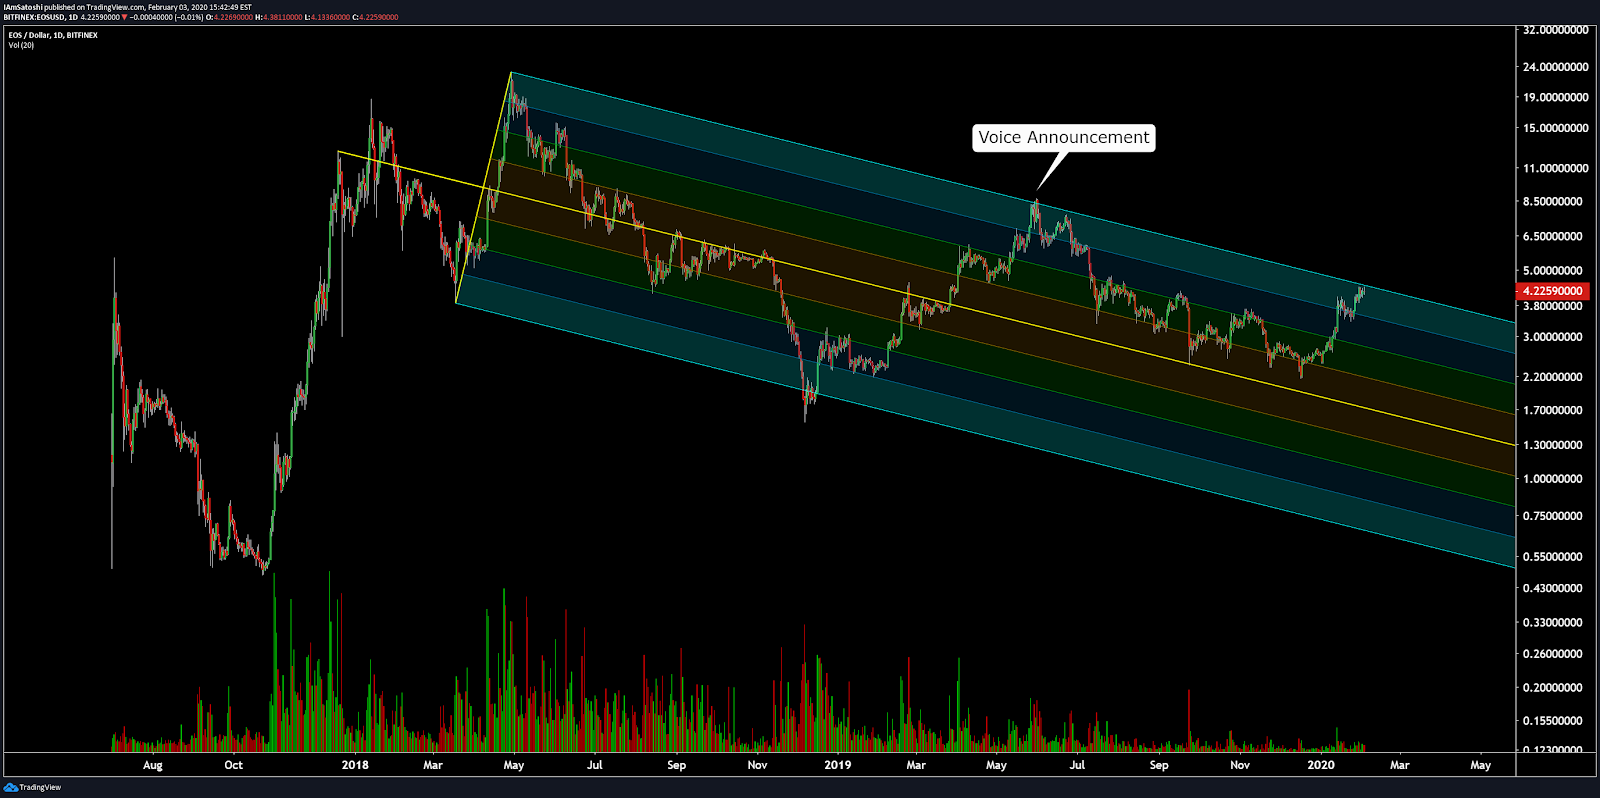
On the daily chart, the 50-day Exponential Moving Average (EMA) and 200-day EMA are currently bearishly crossed with price now above both. The previous Golden cross was quickly negated in mid-July but another Golden Cross is likely if price is able to maintain the current level over the next few weeks. A Golden Cross, should it occur, will likely bring significant bullish momentum towards the previous local high at US$0.125.
Volume Profile Visible Range (VPVR, horizontal bars) shows significant volume support between the US$0.06-US$0.08 zone. Overhead resistance sits at the US$0.11-US$0.12 zone, with significant resistance at the US$0.20-US$0.21 level. The US$0.10 and US$0.20 zones both represent psychological resistance as round numbers.
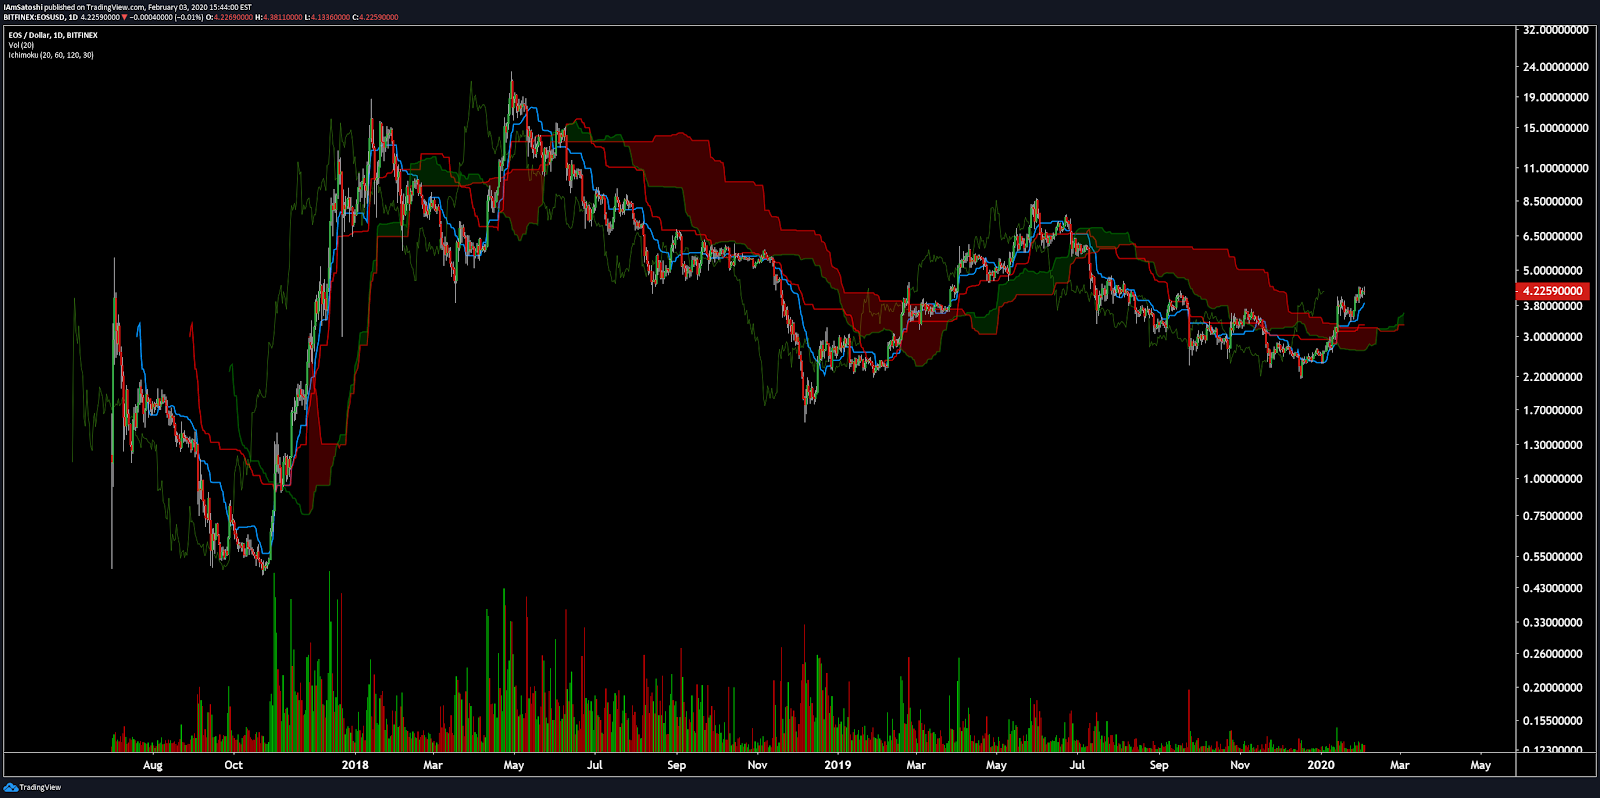
Turning to the Ichimoku Cloud, four metrics are used to indicate if a trend exists; the current price in relation to the Cloud, the color of the Cloud (red for bearish, green for bullish), the Tenkan (T) and Kijun (K) cross, and the Lagging Span. The best entry always occurs when most of the signals flip from bearish to bullish, or vice versa.
Cloud metrics on the daily time frame, with doubled settings (20/60/120/30) for more accurate signals, are bullish; price is above the Cloud, the Cloud is bullish, and the Lagging Span is above the Cloud and above the current spot price. A traditional long entry triggered earlier this week until price returns above the Cloud.
For the XEM/BTC pair, trend indicators are also newly bullish. The 50-day EMA and 200-day EMA are currently bearishly crossed with price sitting just below the 200-day EMA. A Golden Cross over the next few weeks is possible so long as price holds the current highs. The two previous Golden Crosses, which occurred in March 2017 and January 2018, yielded 2400% and 100% respectively. Price has also recently breached the Cloud for the first time since late 2018. VPVR (horizontal bars) shows support at a substantial previous volume node between 300-400 sats and resistance all the way up to 1,000 sats.
Conclusion
Network fundamentals continue to show increasing on-chain activity over the past year. NVT, an inverse measure of network utility, decreased dramatically over the past year, confirming a strong uptick in blockchain use. Based on the NEM Foundation reinvigorating a push towards NEM 2.0, initially branded as Catapult, now Symbol, 2020 may be a breakout year for the NEM blockchain.
Technicals for both the XEM/USD and XEM/BTC pairs are bullish based on trend metrics. Both pairs show a strong likelihood for a bullish Golden Cross over the next few weeks and both have recently breached above the daily Cloud. Long term, resistance for the XEM/USD pair stands at US$0.20 and US$0.25 and resistance for the XEM/BTC pairstands at 1,000, 1,500, 2,500, and 3,500 sats. A mainnet launch of NEM 2.0 may serve as a key fundamental driver for price action over the next year.
 Brave New Coin reaches 1M+ engaged crypto enthusiasts a month through our website, podcast, newsletters, and YouTube. Get your brand in front of key decision-makers and early adopters in 2026. Limited slots remaining! Find out more today!


