A Bitcoin Golden Cross Confirmed – What The Indicators Say About A Potential Bull Run

![]()
Bitcoin is up ~39.1% year-to-date. The bulls have been on parade buoyed by softer macroeconomic data and strong network fundamentals.
Over the same period as the Bitcoin price move, Ethereum (ETH), is also surging – up ~38.6% so far this year.
What is perhaps even more interesting, is the short-term moving average line (3�0-day) crossing from above to below the long-term moving average line (200-day) – the so-called ‘golden cross‘. It is one of the most notable technical indicators in a technical analysis trader’s playbook. The golden cross has been hit on the daily chart.
Source: Tradingview, Short-term blue — Long-term Red
A confirmed golden cross suggests a bullish price action continuing.
Source: Tradingview
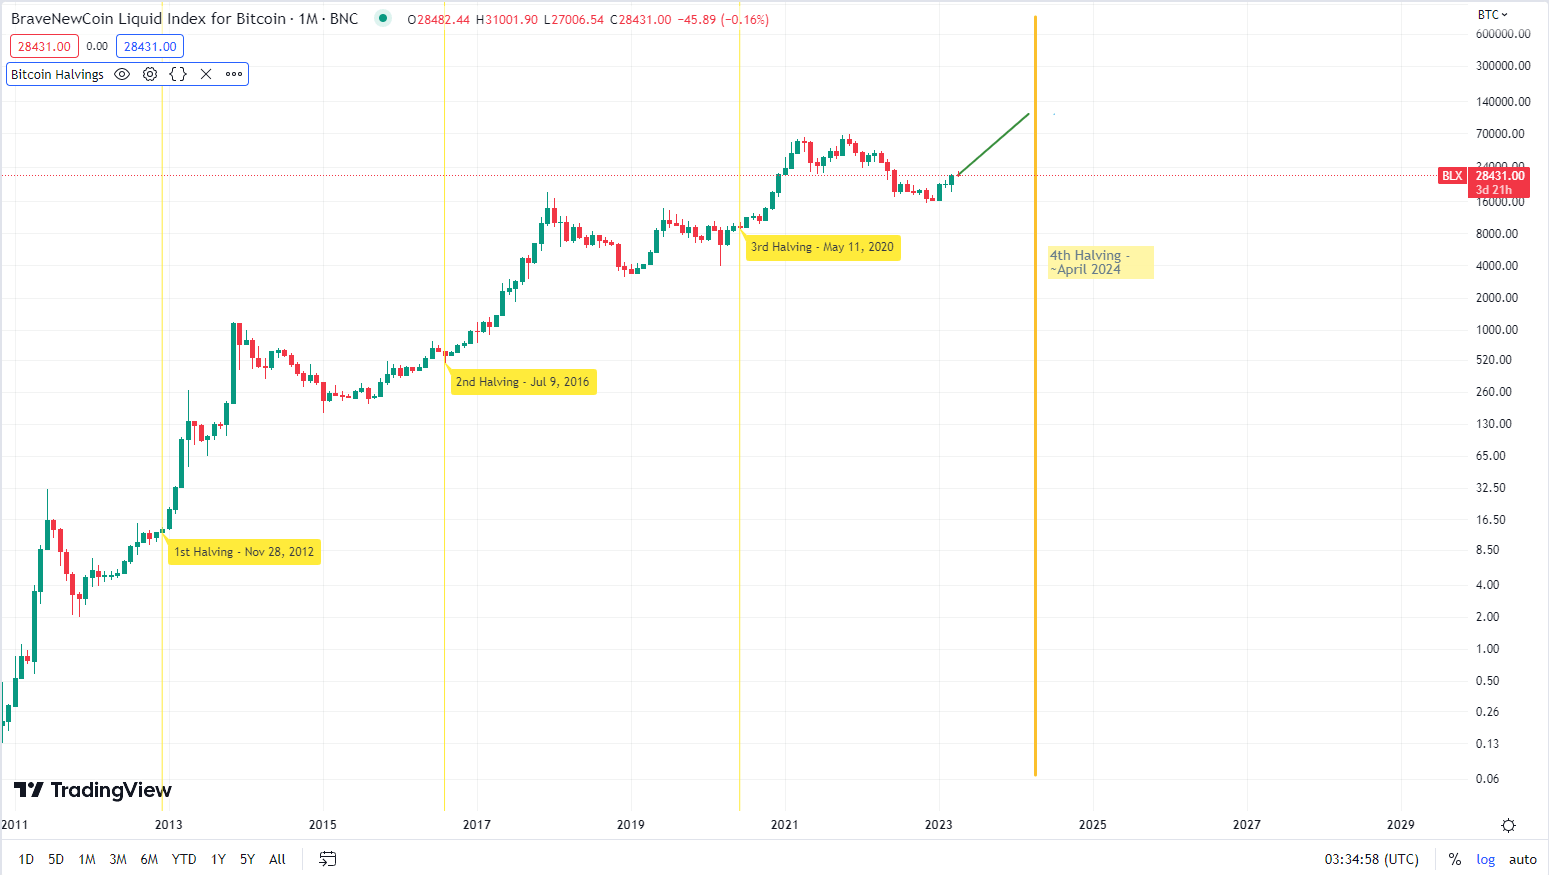
There are three stages to a golden cross, The first stage is an extended downtrend. The second stage is a strong short-term reversal upward breakout – which hits its zenith when the short-term average crosses above the long-term average. The third stage, which is not always guaranteed even if the first two stages occur, is an extended price uptrend. The last time Bitcoin hit a golden cross was in June 2021, and the BTC price soared in the following months after stage 2 was reached.
This time around, however, the macro environment is quite different. After the embarrassment of the FTX debacle occurring right under its nose, the Securities and Exchange Commission (SEC) is coming after the crypto sector aggressively in the last week. Easy targets like Kraken and Coinbase are in its sights, and Kraken recently paid a $30 million fine to settle SEC charges that its staking service was actually a securities offering.
Unregistered securities charges have also been levied at crypto product providers — Genesis and Gemini. In the last few days, it has been reported that the SEC is now also seeking to sue stablecoin issuer Paxos. Paxos is the issuer of two physically backed US dollar stablecoins — Paxos USD (PUSD) and Binance USD (BUSD). It also issues a gold-backed stablecoin Pax Gold (PaxG) and manages the itBit exchange.
The SEC has not yet confirmed these reports and whether there is an ongoing investigation. The initial report by the Wall Street Journal, claims that the SEC is charging Paxos for offering an unregistered security, BUSD. The price of BTC fell by 6.1% the day after the Kraken news.
Bitcoin’s excellent beginning to 2023
Bitcoin and the crypto asset class, in general, have begun the year strongly on the back of cooler economic data that has hinted that interest rate increases in the United States may end soon and inflation has maxed out. Bitcoin began the year trading around US$16,500 and now trades for above US$22,000.
The first Consumer Price Index (CPI) print of the year was released by the Bureau of Labor Statistics (BLS) on January 19th. The report, which covered consumer prices in December 2022, showed that prices rose by 6.5% in the month. This was the smallest increase in a year and the sixth month in a row when the inflation rate had slowed. The January Consumer Price Index CPI showed that prices rose 0.5% in the first month of the year, and by 6.4% on a year-by-year basis, more than economists expected.
Fed Chairman Jerome Powell has said many times this year that a disinflation process has begun in the USA and a softer economic landing may be possible. He told the Economic Club of Washington D.C. that the US Central Bank was succeeding in its fight against inflation, but acknowledged the battle is not over. He said if strong labor market and inflation data emerge, then the Fed will be forced to continue with interest rate hikes. Higher interest rates constrict the ability of investors to operate by increasing the cost of capital and making borrowing more favorable.
Source: Tradingview
If the Fed’s tightening cycle shows signs of ending, then Bitcoin and crypto could be set to begin a bullish flip as the shackles are pulled off investors. When the Fed finished its last tightening cycle in 2019, BTC and crypto began an extended bullish price reversal. As the chart above indicates, in the months after the Fed started to cut interest rates, the price of BTC traded sideways. Once the Fed began to aggressively drop interest rates, the price of BTC began to skyrocket. Bulls may already be backing this narrative and are buying cheaper Bitcoin in preparation.
Additionally, while more drama surrounding the FTX collapse emerged during January, markets appeared disinterested and Bitcoin prices continued to trend up. This suggests that the FTX incident has now been priced in.
The price momentum of Bitcoin has stalled, however, as new economic data suggests that the US economy is getting hotter than expected. Nonfarm payrolls, the measure of US workers excluding farm workers, increased by 517,000 for the month, This blew past analysts’ expectations of a rise of 187,000. The unemployment rate in the country fell to 3.4%, the lowest since May 1969. This data is buffered by the strong January inflation data.
This suggests that a recession may be avoided in the short-to-medium and that a post-covid recovery is being undergone successfully. With macroeconomics, however, the good news is often bad news. In the shorter term, however, it means that the Fed should now have more room to continue rate hikes and use monetary policy to control inflation which sits well above the targeted 2% level
Ordinals bring new utility and price surge to Bitcoin
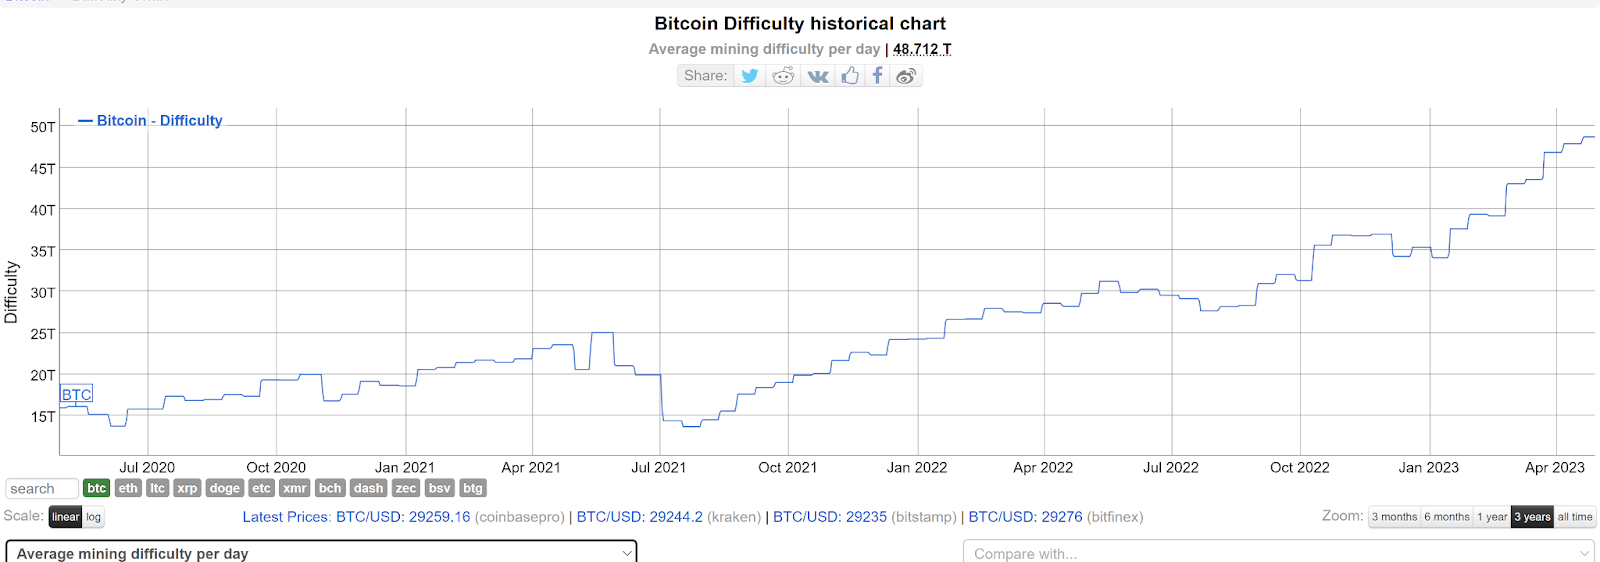
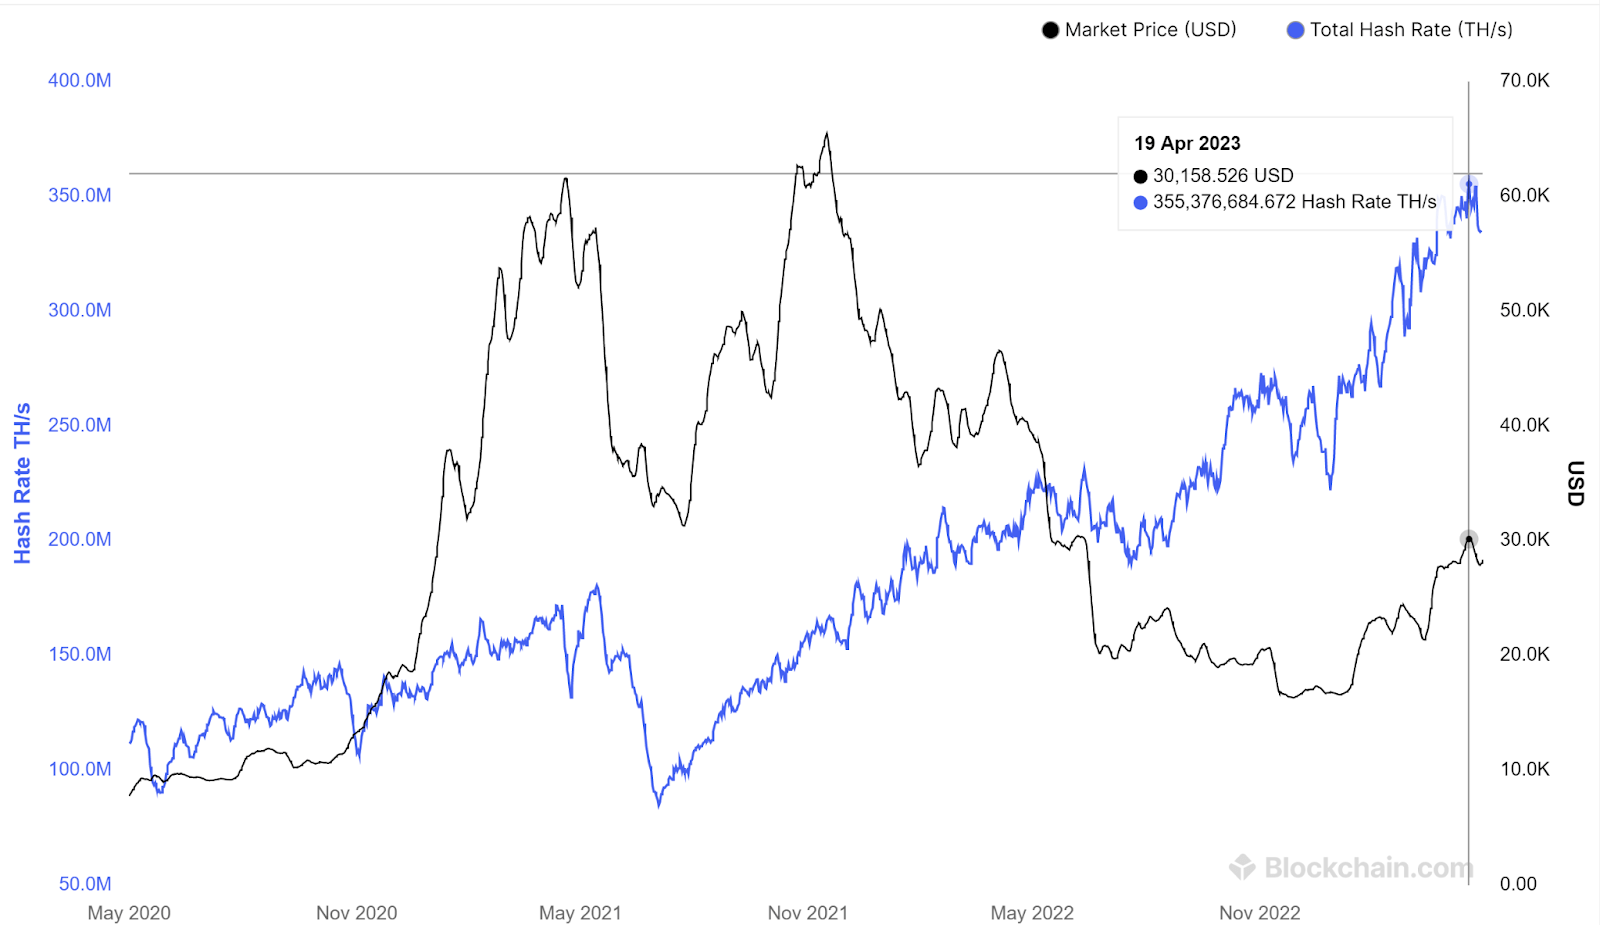
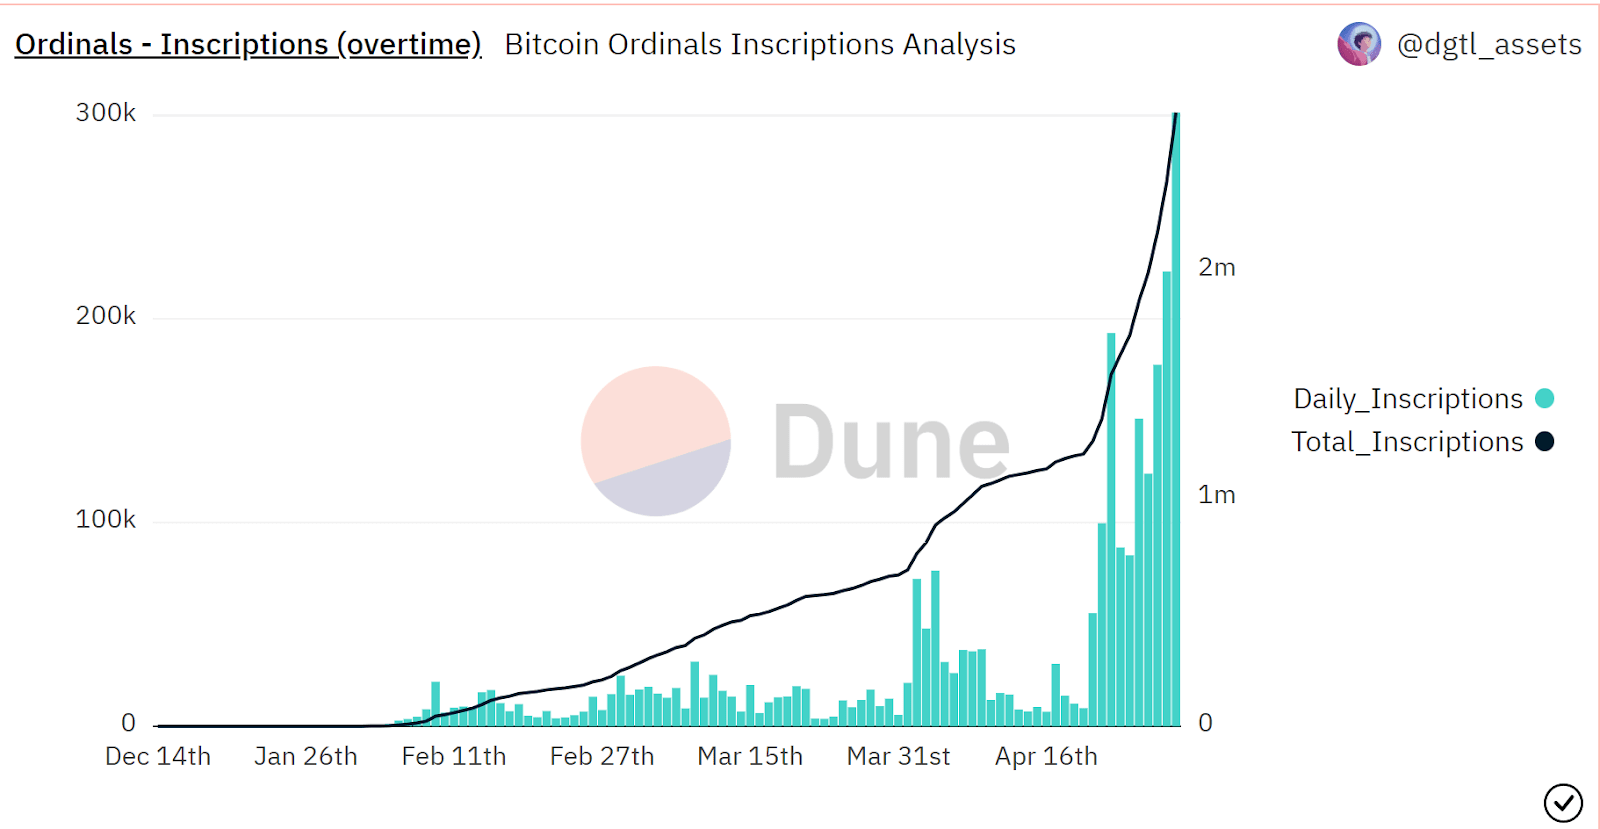
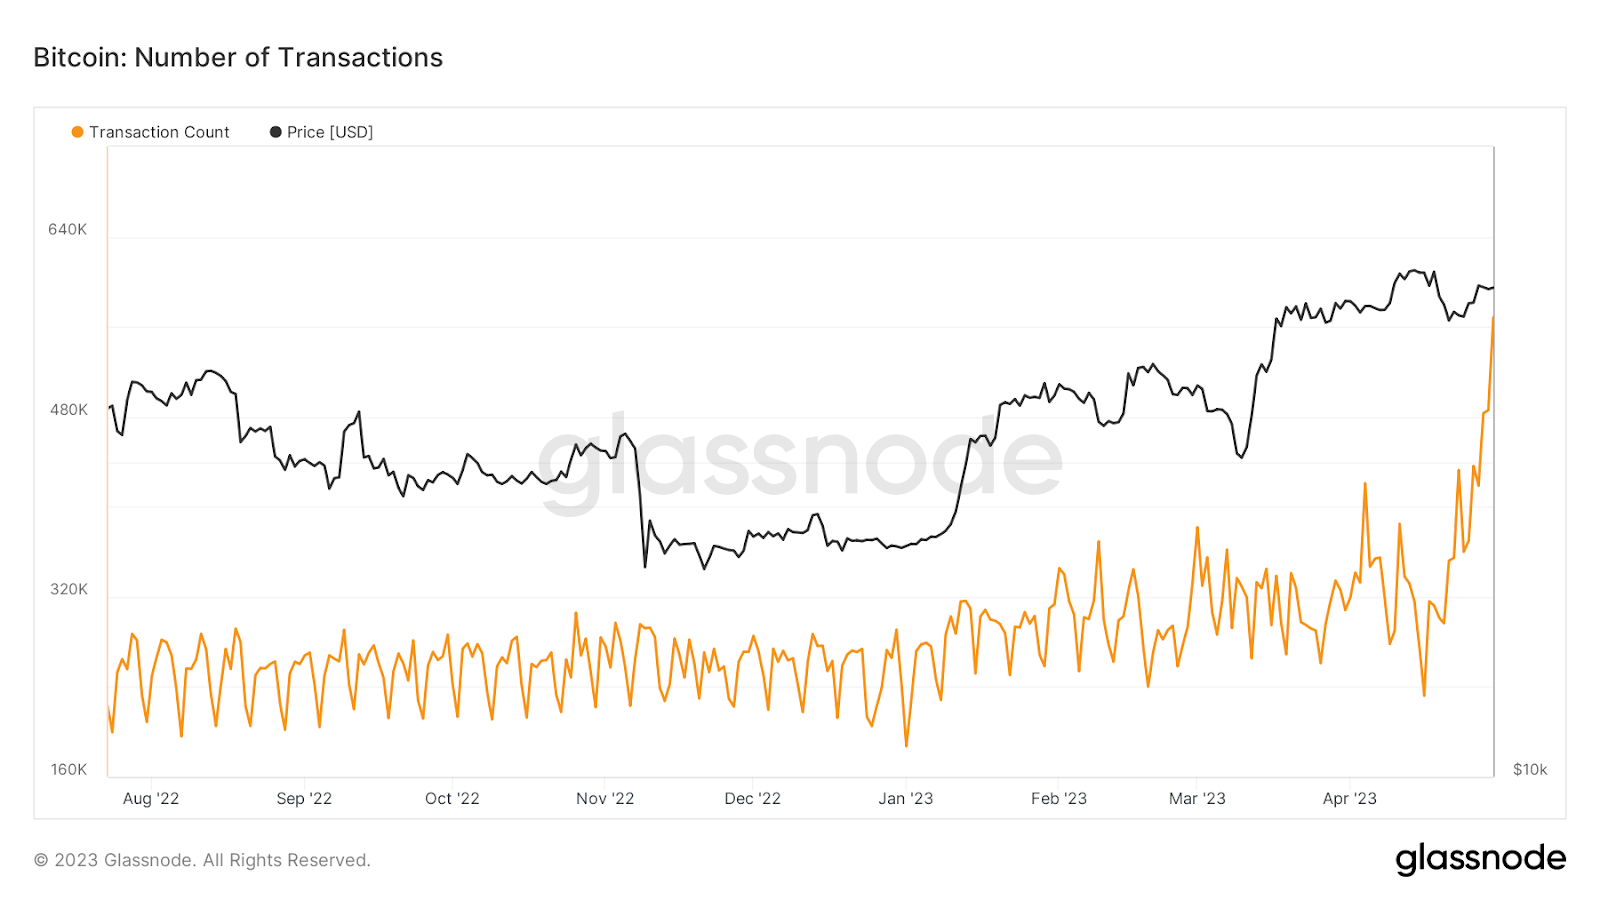
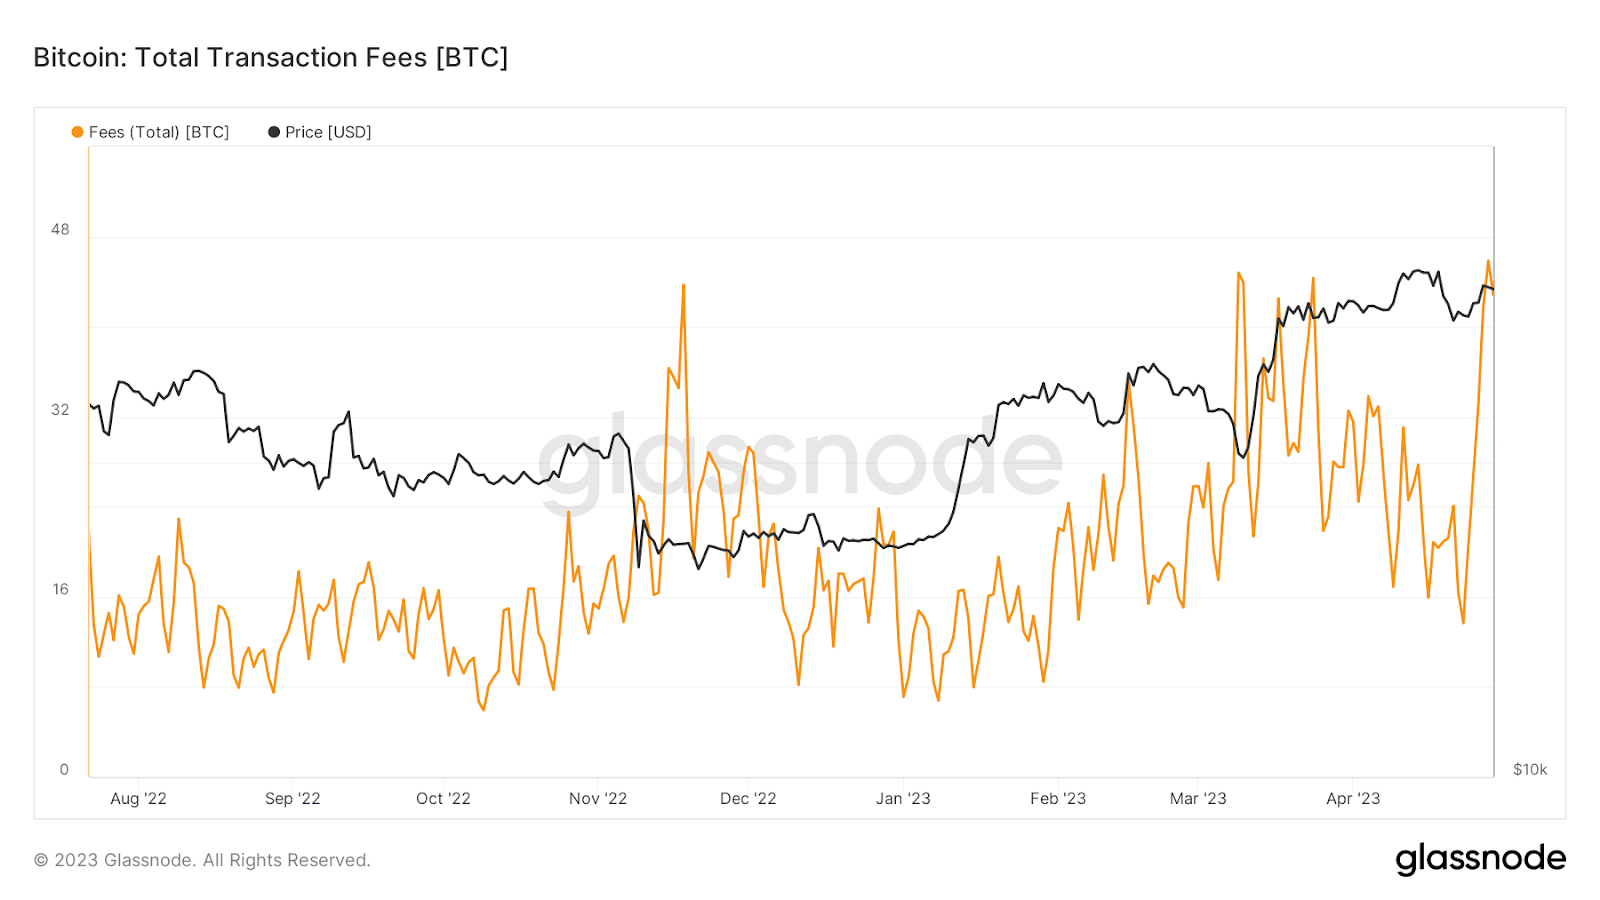
As the charts below show, there has been a recent surge in onchain fees, active users & addresses, and miner revenue. All of this has coincided with the launch of the new Ordinals digital collectible boom on the Bitcoin network. The Ordinals protocol is a controversial, innovative new protocol that allows Non-fungible Tokens (NFTs) to be stored on Bitcoin.
Ordinals are not the first project to try and introduce NFTs to Bitcoin. Counterparty brought Rare Pepes to the network and Stacks continues to make progress. Ordinals are different, however, because NFTs are inscribed directly on satoshis on Bitcoin without needing a sidechain or additional token. The project’s growth has been parabolic since it was launched in January with daily mints now around 10,000 a day.
The Ordinals appear to be more than just a gimmick with serious money being splashed. ‘Bitcoin punks’ takes inspiration from the popular Crypto punk franchise on the Ethereum network. One sold recently for 9.5BTC or ~US$208,000.
Source: Glassnode, BTC Transfer volume

Source: Glassnode, BTC TX fees – last month
Source: Glassnode – BTC miner revenue – last month
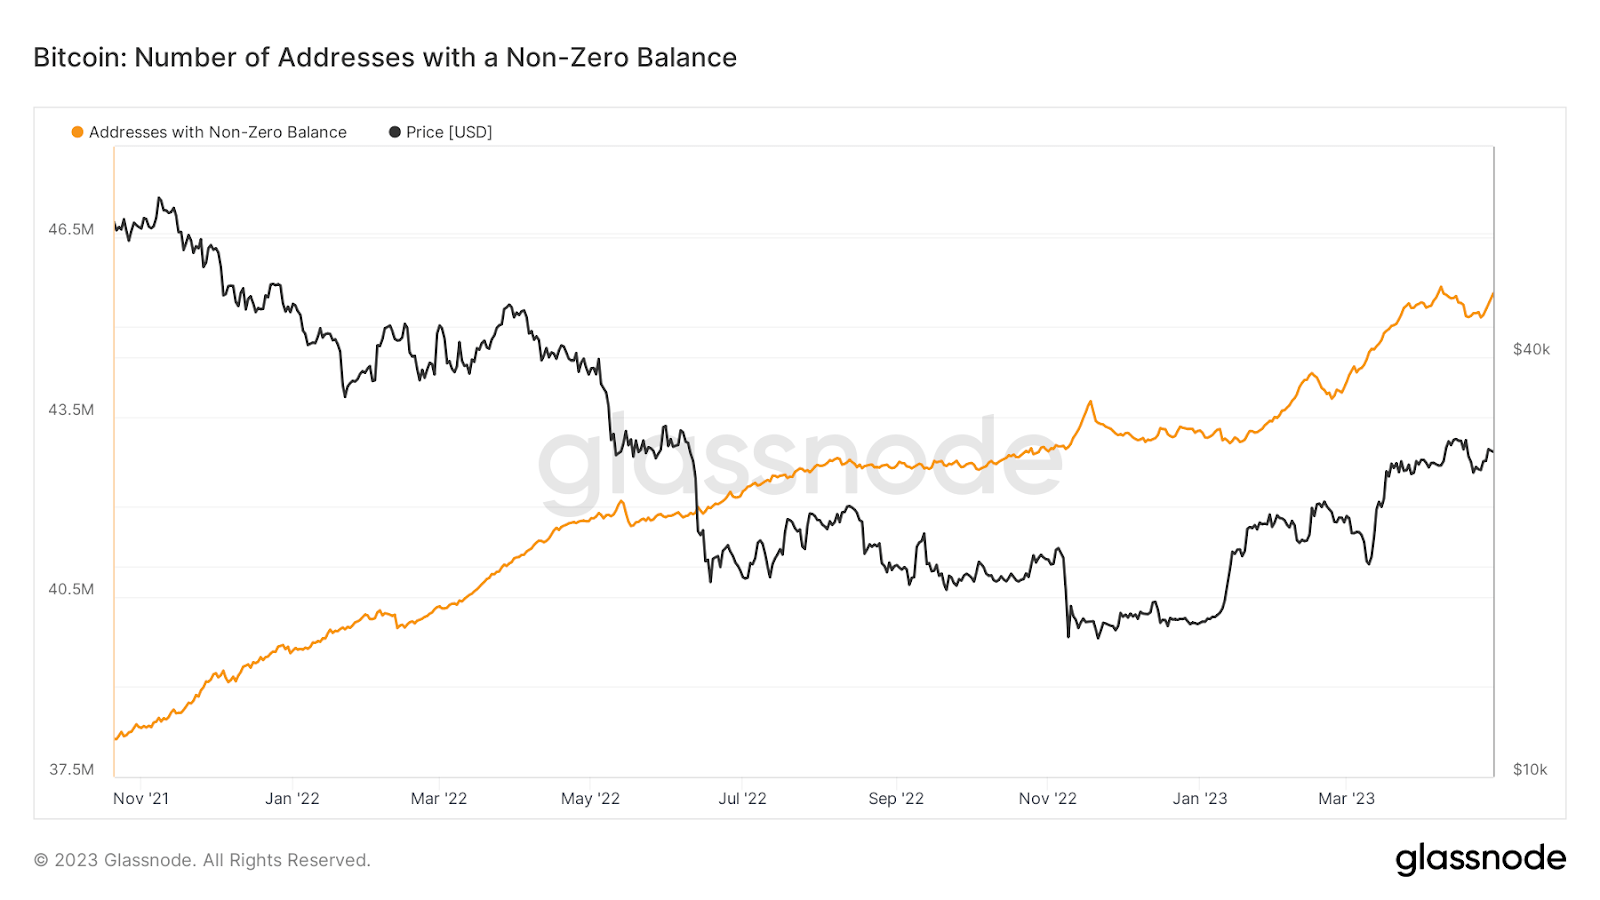
Source: Glassnode, BTC Active Addresses – Last month
Additionally, the Ordinals protocol utilizes Taproot. A Bitcoin transaction type that packages network transaction outputs together to make them more efficient and secure. Driven by Ordinals momentum, there has been a surge in Taproot usage over the last month.
Other technical Indicators
Trading volume is a measure of how much a given financial asset has been traded in a period of time. Traders look at volume to determine liquidity and the strength of conviction of a bull or bear trend.
What may concern Bitcoin bulls is that the current surge in BTC’s price has arrived with weak volume that is trending downwards. A general rule of thumb is that rising prices with lower or tepid volume are difficult to trust and the buying pressure may run out of fuel, stalling the rally.
The Relative Strength Index (RSI) is a momentum indicator. It assesses the speed and magnitude of a security’s recent price changes to evaluate whether it is overbought or oversold based on the veracity of the move. If a price moves too quickly too soon it is being overbought or over-sold. The general rule of thumb is that an RSI over 70 indicates that an asset may be overbought and a reading of 30 indicates that an asset is oversold.
The current RSI for bitcoin (BTC) is ~47.55 which suggests that the asset is far from oversold. It is in fact in a downtrend which suggests lagging bullish momentum.
Conclusion
Bitcoin has reached a promised land, beyond the golden cross. The last time BTC achieved this technical bullish flag, it triggered an extended bull run that ended with new all-time highs. The bulls will be hoping for more of the same this time around.
The price push to the golden cross in 2023, has been driven by softer macroeconomic data. It has also been buoyed by a surge in usage of Bitcoin, which has been driven by an emerging use case for the network — NFTs directly inscribed onto the network.
Despite the golden cross, there are some concerning flags emerging for bulls. One is major resistance at the US$24,000 price that has twice stalled price momentum for BTC in the last six months. Others include weak volume and a US Federal Reserve that may be tempted to raise interest rates aggressively again. The most concerning headwind, however, is the aggressive moves being made by the SEC, which has the potential to derail the growth of the entire sector in the United States.
 Brave New Coin reaches 1M+ engaged crypto enthusiasts a month through our website, podcast, newsletters, and YouTube. Get your brand in front of key decision-makers and early adopters in 2026. Limited slots remaining! Find out more today!


