Augur Price Analysis: Novelty betting markets growing in popularity

![]()
On the back of positive speculative momentum created by the launch of the Veil platform, the REP token has emerged as a market leading alt-coin, up more than 50% since the 1st of January. Although price has slid since its initial surge, a number of technical and fundamental indicators point to good times ahead for REP.
Augur (REP) is the Ethereum blockchain’s leading prediction marketplace that is designed to forecast and communicate the outcome of real world events based on a majority consensus principle.
Augur’s native token, REP, is required for operations within the platform such as being the medium of payment required to create a new betting market, while also being used to payout oracles who report event outcomes.
Markets can either be Binary (Yes/No or one/or the other markets) or can have multiple different outcomes.
The Augur platform functions with a smart contract which matches opposite orders. Peers who both want to make opposing bets on the outcome of specific betting markets are connected and interact with each other. For example, if someone wanted to buy an outcome such as ‘Yes, Donald Trump will declare a national emergency in February’ at odds ~60% with a $50 stake, there must be a counterparty willing to match this bet in reverse, so willing to stake $50 at 40% odds that Donald Trump will not declare a national emergency in February.
If a user buys an outcome that ends up being true (based on oracle reporting) in their favour, they will profit based on their stake. If the selected outcome ends up being false then the user loses their stake.
As all markets are open before the oracle finally reports on an outcome, users can cash out their stakes; hedging risk, minimizing losses and more quickly accessing profits if they are no longer interested in participating in the market.
Trading activity on Augur is conducted with ETH, and a user does not actually need any REP to participate in the Augur betting marketplace.

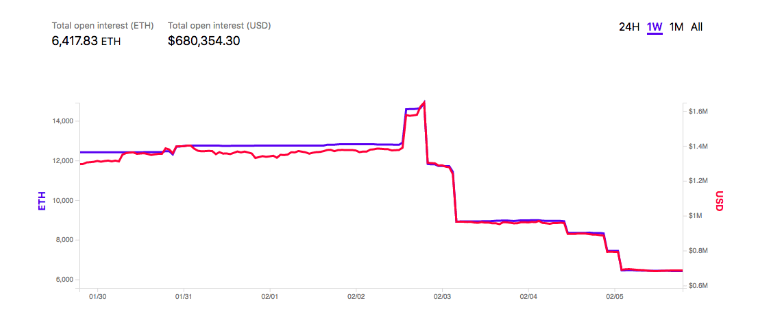
The current level of ETH staked in the Augur ecosystem, a spike and subsequent fall in stake occured around the Superbowl. Total ETH volume is equivalent to just over $900,000 and amounting to 0.008% of the total ETH in circulation.
Augur’s trading structure has lead to some inherent disadvantages vs a number of centralized legacy alternatives. Because all bets are peer-to-peer and need to be counter matched, on most Augur markets there is very little certainty of a bet order being filled.
In fact, a large percentage of created Augur markets end up being illiquid because of missing counterparties. Of the 1394 orders that have ever been created within Augur, only 905 have filled, meaning just over 35% of orders created on Augur have not been matched.
Additionally, most users likely choose to not even put orders in, knowing that liquidity is non existent on most Augur markets.
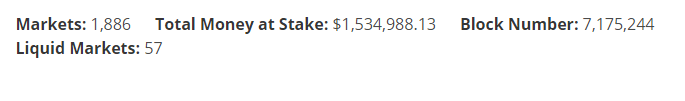
Data from Predictions.Global. While there are 1886 trackable markets on Augur, only 57 meet the lowest minimum threshold liquidity requirements (markets acceptable simulated spread, that may be attractive to traders.) A user may choose to participate in a non-liquid market but this would be somewhat pointless.
Singular betting events often dominate and take up a great chunk of open interest of ETH on Augur. A recent market surrounding an ambiguous question as to who controlled the US House of Representatives following the midterm elections, had $600,000 worth of ETH staked in it and was only recently settled following six dispute rounds.
The completion of the reporting resulted in the open interest on Augur falling by 57%. The large amount sunk into this one market is evidence of both the value in Augur as a platform to register novelty bets and of the missing coverage of bets across multiple markets.

Source: https://www.augur.net/
https://www.curiousgiraffe.io/augur/
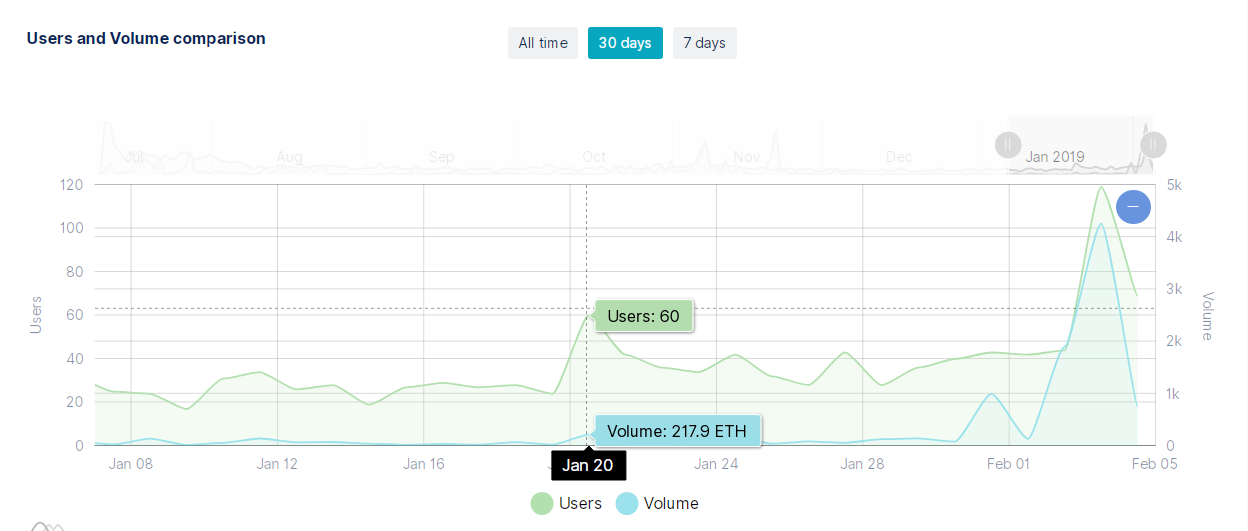
On most days over the last month the average number of active users on the Augur DApp sat at well under 50. On the 9th of January, for example, there were just 17 users active on the platform.
Source: Dappradar
Nonetheless, many of these users appear ready and willing to make large trades when the opportunity to do so arises. Superbowl Sunday, for example, was by far the busiest on the platform across the last month, 115 Augur users participated in 225 on-chain events, using 4,625 ETH worth ~$469,150 or just over $4000 per user. The majority of users and operations on Augur for the day revolved around trading (orders for bets on Augur made with ETH, not exchange trading).
A major obstacle in Augur accessing new users is the platform’s poor user experience. Non-technical traders face challenges understanding buy & sell outcomes and calculating profits. Additionally, dispute resolution within Augur can be long winded which affects how long it takes to receive payouts. This is exasperated because a number of event outcomes appear to be quite ambiguous. For many, these factors combine to make participating in Augur seem like more hassle than it’s worth.
In the near future, though, these technical barriers to access may be eased. In the last few months some infrastructure projects connected to the Augur platform have emerged, that have made it easier to interact with.
- Predictions.global allows for the sorting of Augur markets into a number of different categories and provides excellent granular information
- Augur analytics by curious giraffe collects a number of relevant Augur metrics and charts live data trends
- Veil is an Augur derivative market that makes trade execution more straightforward and is built using 0x
- The Augur Insider calculates volatility for Augur markets
- Augur dispute crowdsourcer lets users check the outcome states of different markets
The recent release of Veil was received warmly by markets and was considered a key factor in the January price run of REP.
The more accessible the Augur platform is, the greater the inherent value of the REP token. With users better understanding Augur trading scenarios and factors affecting their profits, more are likely to participate in trading, and thus create greater demand for market creation and oracle reporting.
Despite the low DApp user counts REP has been one of the best performing altcoins in 2019, due in part to speculation surrounding infrastructure releases like Veil, and the fact that REP is one of the few altcoins to have a genuine utility proposition. The price of REP has risen a credible ~71% in bearish wider market conditions since the 1st of January, from ~$7.70 to ~$13.13
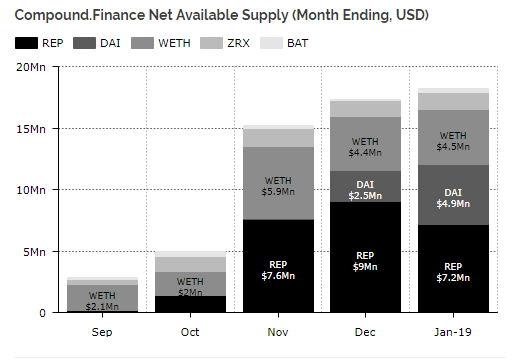
Additionally, utility for REP has been created through its use as an available lendable crypto on Coinbase backed Ethereum decentralized finance platform, Compound. Holders can deposit their REP on Compound and earn 0.01% APR on holdings, while borrowers can access REP with straightforward collateral requirements, offering near instant liquidity.
Source Diar Newsletter.
Inherent long term risks for Augur and REP’s success are; scalability challenges of the Ethereum blockchain which acts as the settlement layer for the platform, and gambling law regulators in a number of jurisdictions that may choose to target Augur for enforcement at some future date.
Exchanges and trading pairs

7 day-REP price and volume chart. Orange line represents an index price comprising of the 5 most popular REP markets, which are listed on the table to the right.
The most popular onramps for REP are generally popular crypto-to-crypto options with the REP/BTC and REP/ETH markets making up over 80% of daily trading. The USD value for daily volume of the REP/BTC pair is over $ 2.5 million. The two next most popular pairs are fiat to crypto REP/KRW and REP/pairs.

The most popular pair by exchange is the REP/ETH pair offered by emerging crypto platform LAToken, which on top of offering crypto exchange services also lets users tokenize assets. The REP/BTC market on Binance is also a popular liquid market to trade REP.
NVT signal
Derived from the NVT ratio, the NVT signal is a responsive blockchain valuation metric developed by Willy Woo and Dmitriy Kalichkin. Crypto markets are prone to bubbles of speculative purchasing, not backed up by underlying network performance and activity. The NVT signal provides some insight into what stage of this price cycle a token may be in.
A high NVT signal is indicative of a network that is going through one of these bubble periods, and may move towards a position of becoming overbought/overvalued, because of the market’s speculative assessments running out of steam.
Following a recent period of sharp forward movements, beginning in mid-January that drove the price of REP to a point of being overbought based on NVT evaluations, price has fallen — from trading around ~$18 on January 20th to currently trading around ~$13 in a correctionary period.
Qualitative fundamental indicators, however, suggest that this current correction may not last much longer, with the NVT signal line trending downwards and quickly pushing towards an oversold level.
Onchain activity in February may be driven by prop bets (novelty/side bets) surrounding some potential Trump administration decisions in the next few weeks and an upcoming SpaceX test flight which already has a few markets created around it with some open interest.
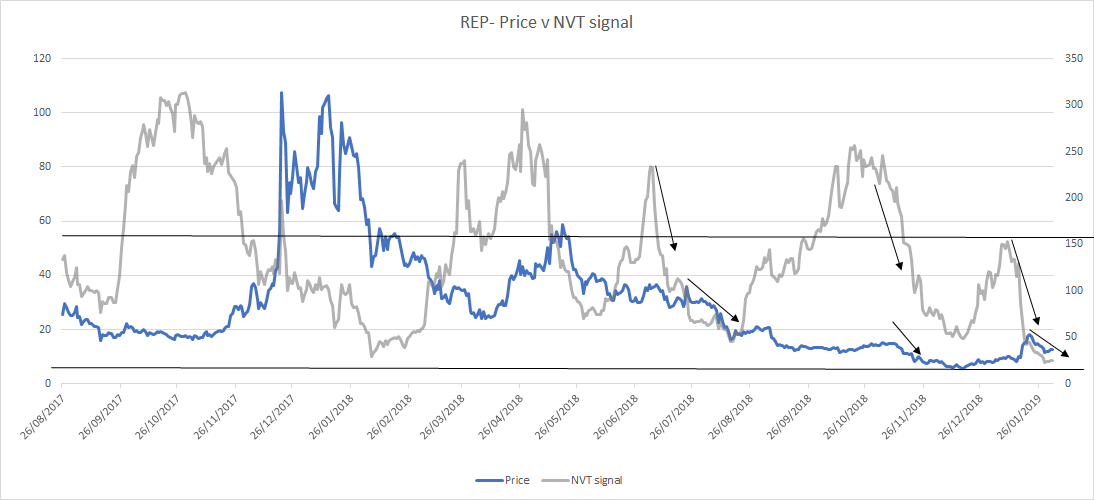
REP NVT signal and price. NVT signal calculated with data from Coinmetrics.io. Adjusted onchain transaction volume used for NVT signal
PMR signals
Metcalfe’s law is a measure of connections in a network, as established by Robert Metcalfe the founder of Ethernet. It has subsequently been used to analyze the true value of network-based financial products like Facebook and Bitcoin, and by comparing it to price, can provide a useful tool to assess whether a token is over or undervalued.
It is also a more straightforward metric to implement versus onchain transaction volume, which can be challenging to measure accurately in USD terms. Addresses are measured as the number of unique sending and receiving addresses participating in transactions daily.
This makes it a relatively transparent metric as compared to onchain volume. However, there may be a question of the granularity of the data, and who controls these addresses.
In a pattern similar to Augur DApp usage, REP onchain active address figures are low and most days hover between 200-1000.
On a number of days an average REP user controls as much $5000 worth of onchain transaction volume, suggesting that REP onchain operations are dominated by a select number of users. This is somewhat unsurprising given how intimidating interacting with the Augur ecosystem is, and how difficult calculating profit is for most users.
Augur’s historical PMR is high and as such appears to be quite disconnected to the price of REP because of the low active address base. Longer term the high PMR may be a concern for some investors because a network like Augur directly benefits and gains value based on the number of daily active users because of its peer-to-peer nature. In the coming year more infrastructure projects like Veil may encourage REP holders to participate in onchain activity.
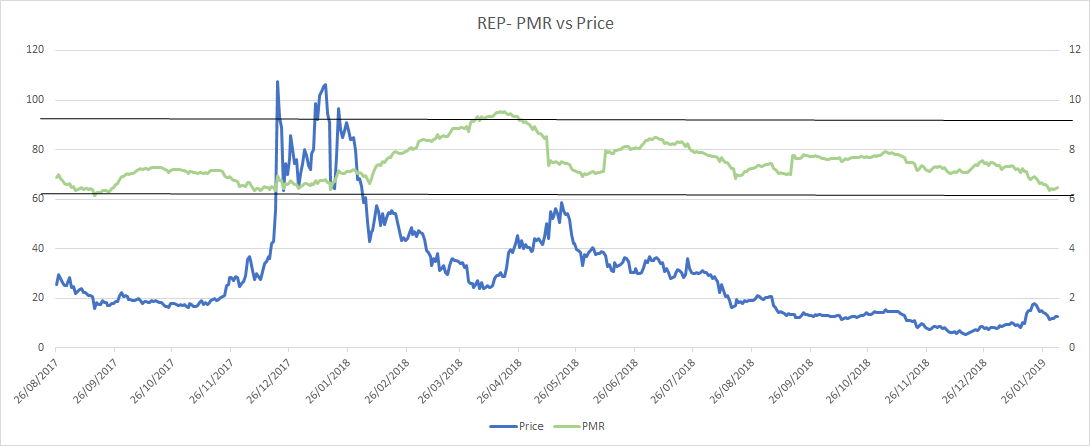
REP Kalichkin PMR and price. PMR calculated with data from Coinmetrics.io.
TAAR
Network transaction volume to active addresses ratio or TAAR, is a recently developed equilibrium valuation metric from Pugilist Ventures’ Christopher Brookins. TAAR combines ”quantity and quality” of network network activity into a single metric.
Fundamental expectations would suggest that when TAAR and price are closely distributed, price (valuation) and fundamentals are aligned in equilibrium.
The general pattern for REP’s TAAR compared to price since early 2018 is that ‘quality’ dominates ‘quantity’. Or, that onchain volume is a greater driver of REP’s fundamental value as compared to the number of daily active addresses on the network.
REP’s TAAR pattern suggests that it may be centralized, or accessible to only a few who understand its complex reporting and round-based dispute resolution mechanism. A rise in active addresses at current onchain volumes would aid in TAAR aligning more consistently with external price. The new infrastructure being built that eases the difficulty in participating with the Augur ecosystem may bring in new smaller users to the Augur ecosystem as market creators or oracles over the next year.

REP TAAR and price. TAAR calculated with data from Coinmetrics.io.
Technical analysis
Moving Averages and Long Term Trends
On the 1D chart, the death cross, using the 50 and 200 day EMAs, has persisted since early August 2018. The 200 day EMA (blue line) is currently acting as resistance. Since the beginning of 2018, the price of REP has been contained within a negative linear price trend with a Pearson’s R Correlation between time and price of ~0.86; even with the most recent price burst from Veil going live.
The aforementioned Veil-spike in price can be visualized by both the faster (15 period) and slower (30 period) TRIX (black arrow) oscillator, which broke a six month trend beneath 0. This positive price momentum can also be seen in the volume flow indicator (VFI), which is currently holding the 0 level. If the VFI falls below 0, the TRIX is likely to follow suit, which would likely see price retest $10. The VFI interpretation is a value above 0 is bullish and below 0 is bearish, with divergences between price and oscillator being high probability signals.
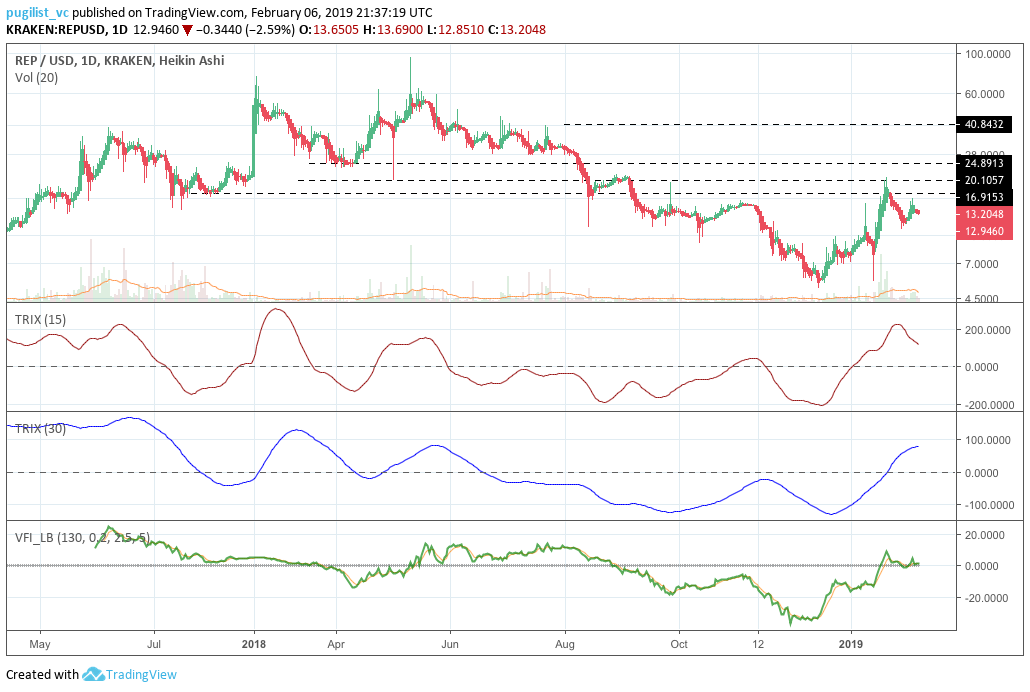
Lastly, after the price explosion, REP retested the 0.618 fibonacci retracement level of $11 and pushed higher. Currently, price seems poised to retest the 0.5 fibonacci retracement level of $12.72. If that level holds, price is likely to move higher with the 0.236 fibonacci retracement level of $16.58 being a price target.

Ichimoku Clouds with Relative Strength Indicator (RSI)
The Ichimoku Cloud uses four metrics to determine if a trend exists; the current price in relation to the Cloud, the color of the Cloud (red for bearish, green for bullish), the Tenkan (T) and Kijun (K) cross, Lagging Span (Chikou), and Senkou Span (A & B).
The status of the current Cloud metrics on the 1D frame with singled settings (10/30/60/30) for quicker signals is bullish; price is above the Cloud, Cloud is bullish, the TK cross is bullish, and the Lagging Span is above the Cloud and price.
A traditional long entry would occur with a price break above the Cloud, known as a Kumo breakout, with price holding above the Cloud. From there, the trader would use either the Tenkan, Kijun, or Senkou A as their trailing stop.
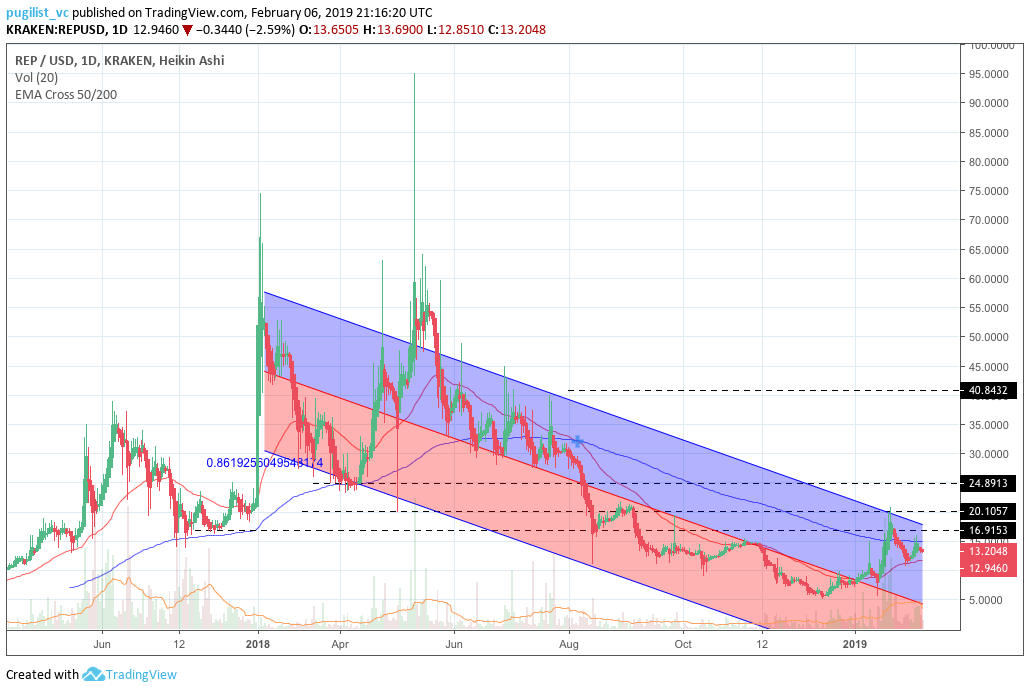
On January 15, 2019, REP completed a Kumo breakout. Since then, price has consolidated, but still remains above the Cloud while using the flat Kijun as support. Given the support levels, price momentum, and RSI (~53 – not overbought); REP has a decent chance of holding the Kumo breakout. If so, the price targets are $16.89 and $20.10 (dashed black lines). Price support levels are $11.38 and 10.35.
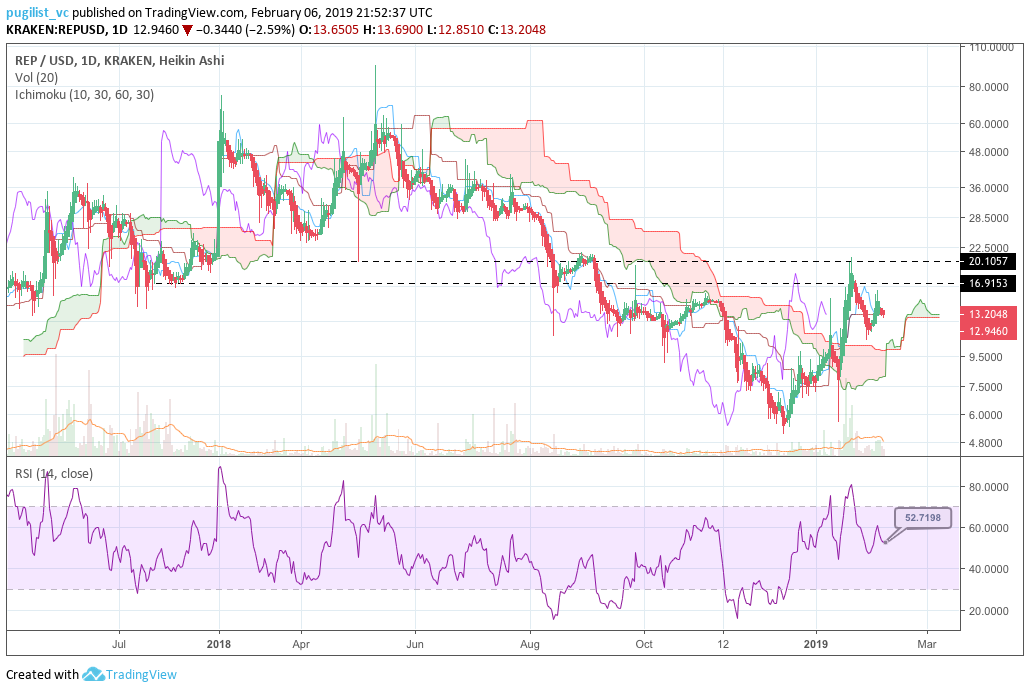
The status of the current Cloud metrics on the 1D time frame with doubled settings (20/60/120/30) for more accurate signals is bullish; price is above the Cloud, Cloud is bullish, the TK cross is bullish, and the Lagging Span is in the Cloud and above price.
On the slower settings, price completed Kumo breakout, and currently sits at flat Kijun support around $12.94. Again, the positive technicals show a decent likelihood that REP will maintain the current Kumo breakout with identical price targets and support levels.

Conclusion
The Augur project and its connected REP token has emerged as one of 2019’s early season altcoin pack leaders. While the current Augur platform more resembles a proof-of-concept or a beta test rather than a consumer ready product, long and medium term potential remains high. The price of REP has overperformed bearish trending digital asset markets in January, while leading industry analysts like Arjun Balaji have earmarked Augur as the breakout Dapp for 2019.
While the price of REP is in the midst of an ongoing correction following the period of healthy price gains, medium indicators remain strong. Alternate betting markets such as those surrounding US politics, which are likely difficult to access on non-decentralized betting marketplaces, have proven popular on the platform, while new supporting infrastructure being built for ease-of-access has added to implied long term value.
The current technicals for REP are bullish and show a solid probability of continuation. Both, the short term trader (10/30/60/30) and longer term trader (20/60/120/30), on the 1D chart, would view the current consolidation at $12.94 (Kijun support) as a solid long entrance point. Prudent stop losses might be set around $12.30, which coincides with a re-entrance to the Cloud. Both trader’s price targets and support levels are $16.89 and $20.10; $11.38 and 10.35, respectively.
Subscribe to BNC’s newsletters for insights and forecasts direct to your inbox
 Brave New Coin reaches 1M+ engaged crypto enthusiasts a month through our website, podcast, newsletters, and YouTube. Get your brand in front of key decision-makers and early adopters in 2026. Limited slots remaining! Find out more today!


