Bitcoin (BTC) Price Prediction: $59.9K Weekly Demand Zone Could Decide Between a $55K Drop and $86K Recovery

Bitcoin rebounded above $60,000 after plunging to a new cycle low near $55,260, but persistent bearish signals continue to challenge the recovery.
The sharp reversal followed approximately $2.7 billion in crypto liquidations within 24 hours, while Bitcoin’s weekly chart identifies the $59,968 demand zone as a critical level for its next major move.
The November 22 rebound recovered more than $5,500 within hours, highlighting the volatility surrounding the current correction. However, the recovery has yet to establish a confirmed trend reversal. Traders are now watching whether buyers can defend weekly support or whether renewed selling could push BTC toward $55,000.
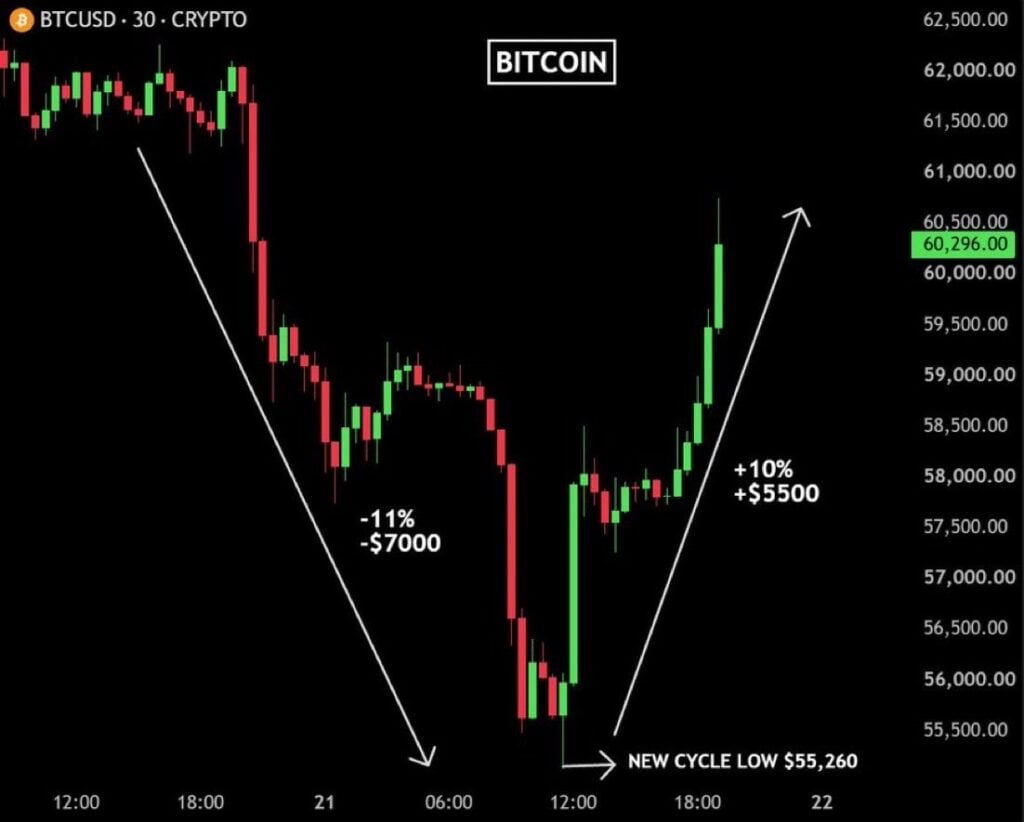
The Bitcoin price rebounded above $60,000 after plunging more than $7,000 in 15 hours to a new cycle low of $55,260. Source: @cryptoxlarg/X
Approximately $360 million in short positions were liquidated during the rebound, highlighting the impact of leveraged trading. Meanwhile, Glassnode’s latest spot-volume data indicates that trading activity is increasingly concentrated in Bitcoin as investors reduce exposure to riskier altcoins.
Why Did Bitcoin Start Falling From Its Major Highs?
Bitcoin’s correction followed a prolonged bullish rally that carried its price from the lower $30,000 region to above $120,000. However, buying momentum weakened near the highs as repeated rejections signaled exhaustion.
The market subsequently formed lower highs and bearish weekly candles, indicating a shift in control toward sellers. The breakdown below the $70,000–$75,000 market structure further weakened the previous bullish trend.
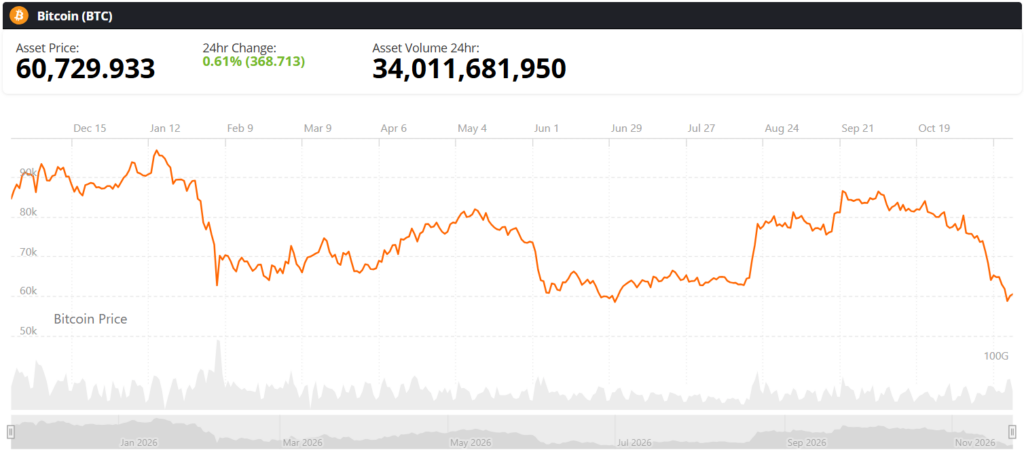
Bitcoin (BTC) price chart. Source: Brave New Coin
During subsequent recovery attempts, BTC repeatedly encountered resistance along a descending trendline. A rebound toward $86,000 also failed to produce a sustained breakout, allowing sellers to regain control.
The latest decline has brought Bitcoin toward the $59,968 weekly demand zone. Although the November 22 rebound lifted BTC above $60,000, buyers have yet to establish a confirmed change in the broader market structure.
According to Reuters, Bitcoin briefly fell to $55,251.60 on November 21, its lowest level in two years, before recovering more than 8% to approximately $59,952. The report highlighted concerns surrounding AI infrastructure spending, higher borrowing costs, regulatory uncertainty, and a stronger US dollar as factors affecting cryptocurrency sentiment.
The sharp reversal also exposed the risks associated with leveraged trading. Approximately $2.7 billion in cryptocurrency positions were liquidated over 24 hours, including around $360 million in short positions during Bitcoin’s recovery. Although the rebound demonstrated aggressive buying activity, liquidation-driven movements do not necessarily indicate a lasting trend reversal.
Why Could Bitcoin Recover Toward $86K?
Despite the bearish structure, the $59,968 demand zone provides a potential foundation for recovery. However, buyers must defend this region and reclaim several resistance levels before the $86,000 target becomes more credible.
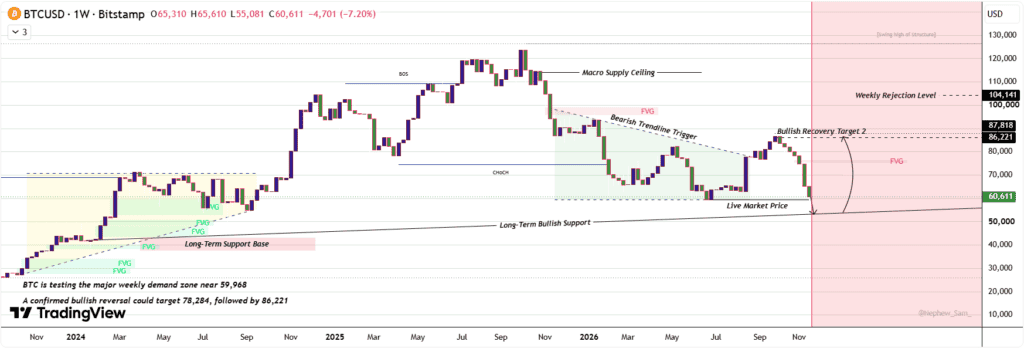
The $59,968 weekly demand zone is a critical level, with a bullish reaction potentially opening recovery targets at $78,284 and $86,221–$87,818. Source: Struxora-Algo on TradingView
The weekly demand area identified by Struxora-Algo on TradingView represents the first important level to watch. A strong bullish reaction could indicate that buyers are absorbing selling pressure.
Bitcoin’s recent recovery from approximately $55,260 also demonstrates how quickly liquidity-driven movements can reverse short-term price action. A temporary breakdown below support followed by a strong recovery could form a liquidity sweep, although confirmation would require sustained buying and a convincing weekly close.
Bullish engulfing candles, long lower wicks, or strong weekly recovery candles around demand could provide additional evidence of improving momentum.
A breakout above the descending trendline would represent another important development. Bitcoin would then need to reclaim the $70,000 market structure before challenging the $78,284–$80,000 resistance region.
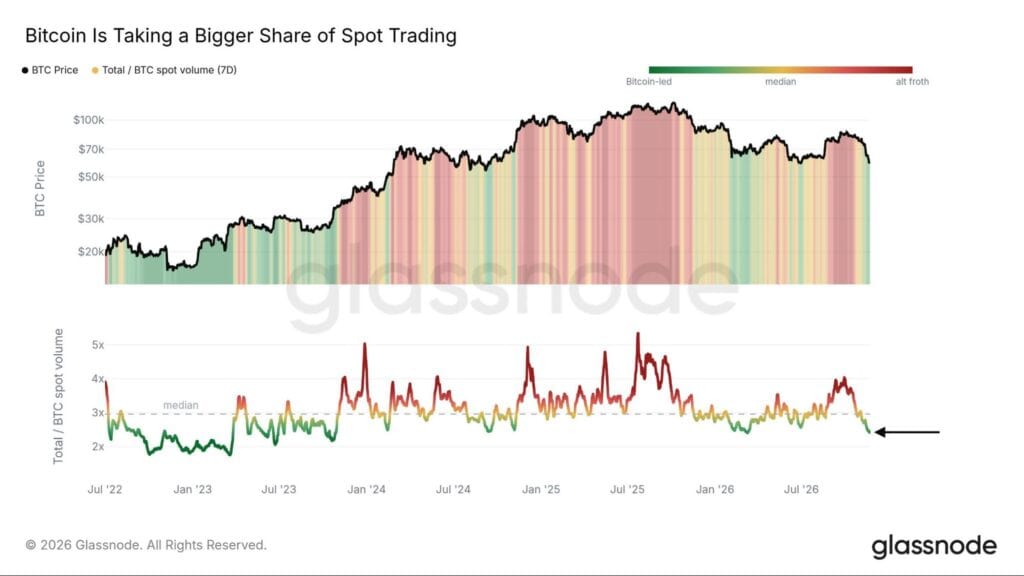
The 7-day altcoin-to-Bitcoin spot volume ratio has fallen from 4x in late September to below summer lows, signaling a sharp decline in altcoin trading activity. Source: Glassnode via X
Glassnode’s latest spot-volume data provides additional insight into market conditions. Its seven-day comparison shows that the ratio of total cryptocurrency spot volume to Bitcoin spot volume has fallen below previous summer levels after reaching approximately 4x in late September.
The decline indicates that altcoin trading activity has weakened relative to Bitcoin. Glassnode’s visualization highlights a shift toward Bitcoin-dominated trading during periods of reduced risk appetite, when investors become less willing to hold more volatile alternative cryptocurrencies.
This development does not independently confirm a bullish reversal, but it illustrates how market participation is becoming increasingly concentrated in Bitcoin.
Important Weekly Price Levels
The following levels provide the main technical references for Bitcoin’s current market structure, based on the TradingView technical summary.
- $114,655: Major swing resistance.
- $104,426: Key weekly resistance.
- $87,818: Major upside target.
- $86,221: First bullish recovery target.
- $78,284: Trendline breakout reference.
- $70,000: Previous market structure.
- $60,847: Reference price in the weekly chart.
- $59,968: Major weekly demand zone.
- $55,000: Potential downside area if support breaks.
- $41,590: Critical historical support.
The latest TradingView technical snapshot also highlights substantial overhead resistance. Bitcoin was trading near $61,013 in the referenced data, well below most major moving averages.
The 10-period EMA stood at $63,742, while the 20-period EMA was near $67,789. Longer-term averages, including the 50-period and 100-period EMAs, were positioned around $73,392 and $74,720, respectively.
The Hull Moving Average near $58,959 was a notable exception, generating a buy signal. However, the overall moving-average assessment remained bearish, with 13 sell signals, one neutral signal, and one buy signal.
These readings suggest that Bitcoin faces considerable resistance despite reclaiming $60,000.
Bullish Scenario – Road to 86K
Bitcoin’s bullish scenario depends primarily on defending the $59,968 weekly demand zone and producing convincing recovery signals.
A sustained recovery above $70,000 would help improve the damaged market structure. A subsequent breakout above $78,284 could strengthen the bullish outlook and open the way toward the $86,221–$87,818 region.
The latest momentum indicators offer limited support for a short-term rebound. The supplied TradingView snapshot placed the Relative Strength Index (RSI) at 27, indicating oversold conditions. Momentum also generated a buy signal, although most other oscillators remained neutral.
An oversold RSI can indicate that selling pressure has become stretched, but it does not guarantee an immediate reversal. Stronger price action, increasing buying participation, and a confirmed trendline breakout would provide more reliable evidence of recovery.
What Happens If Bitcoin Breaks Below $59.9K?
A decisive weekly close below the $59,968 demand zone would weaken the recovery setup and expose Bitcoin to further downside. The first area to monitor would be $55,000, which BTC approached during the latest selloff.
The bearish case is reinforced by Bitcoin’s position below most major moving averages, its unresolved descending trendline resistance, and the broader weakness in risk appetite. A breakdown could also trigger stop-loss orders and forced liquidations from leveraged long positions, accelerating selling pressure.
The classic pivot analysis identifies additional support near $58,181. If Bitcoin also loses $55,000, the historical support near $41,590 could become a longer-term reference point. Higher real yields, dollar strength, and continued volatility in traditional financial markets could add pressure to an already weak technical structure.
However, these remain conditional downside scenarios. A weekly breakdown below $59,968 would provide stronger confirmation than a temporary intraday move beneath support.
FINAL MARKET OUTLOOK
Bitcoin’s rebound above $60,000 has provided temporary relief after its sharp decline toward $55,260. However, the broader market structure remains bearish, with major moving averages and the descending trendline continuing to restrict recovery attempts.
The $59,968 weekly demand zone is now a critical level for the Bitcoin price prediction. A sustained defense of this region, supported by stronger weekly candles and a trendline breakout, could create conditions for a recovery toward $78,284 and eventually $86,221–$87,818.
Conversely, a decisive weekly breakdown below support would increase the possibility of another decline toward $55,000, with $41,590 representing a deeper historical support level.
Glassnode’s spot-volume data shows that market activity is becoming increasingly concentrated in Bitcoin as appetite for altcoins weakens. Meanwhile, the recent liquidation event demonstrates how leverage continues to amplify price movements during periods of extreme volatility.
For now, Bitcoin has demonstrated its ability to recover sharply from heavy selling pressure, but a confirmed trend reversal remains unestablished. The next weekly closes around $59,968, followed by potential resistance at $70,000 and $78,284, will provide important evidence of whether the market is stabilizing or preparing for another leg lower.
 Brave New Coin reaches 1M+ engaged crypto enthusiasts a month through our website, podcast, newsletters, and YouTube. Get your brand in front of key decision-makers and early adopters in 2026. Limited slots remaining! Find out more today!