Bitcoin (BTC) Price Prediction: BlackRock’s $663M ETF Inflow Reverses October Outflows—Can BTC Break the $90K Barrier?

Bitcoin (BTC) attracted renewed institutional interest on October 19 as BlackRock’s iShares Bitcoin Trust (IBIT) recorded a substantial inflow, helping lift total net flows into US spot Bitcoin exchange-traded funds (ETFs) into positive territory for the session.
The development offered a fresh bullish signal as Bitcoin traded within $81.185–$82,954, although questions remain about whether demand can sustain a move toward $90,000.
Glassnode’s ETF flow data highlighted the surge, while market analysts pointed to Bitcoin’s daily Relative Strength Index (RSI), liquidation levels, and on-chain demand metrics to assess the recovery. Together, these indicators present a mixed picture: institutional buying has strengthened, but broader spot demand remains a key factor in determining whether the latest rebound can develop into a sustained advance.
BlackRock Bitcoin ETF Inflows Lift Market Sentiment
BlackRock’s IBIT attracted approximately $665.2 million on October 19, according to ETF flow data compiled by TFTC. However, outflows from Fidelity’s FBTC and Grayscale’s GBTC reduced the combined net inflow across US spot Bitcoin ETFs to approximately $526.6 million. This distinction matters because IBIT’s individual inflow was larger than the amount ultimately entering the entire ETF group.
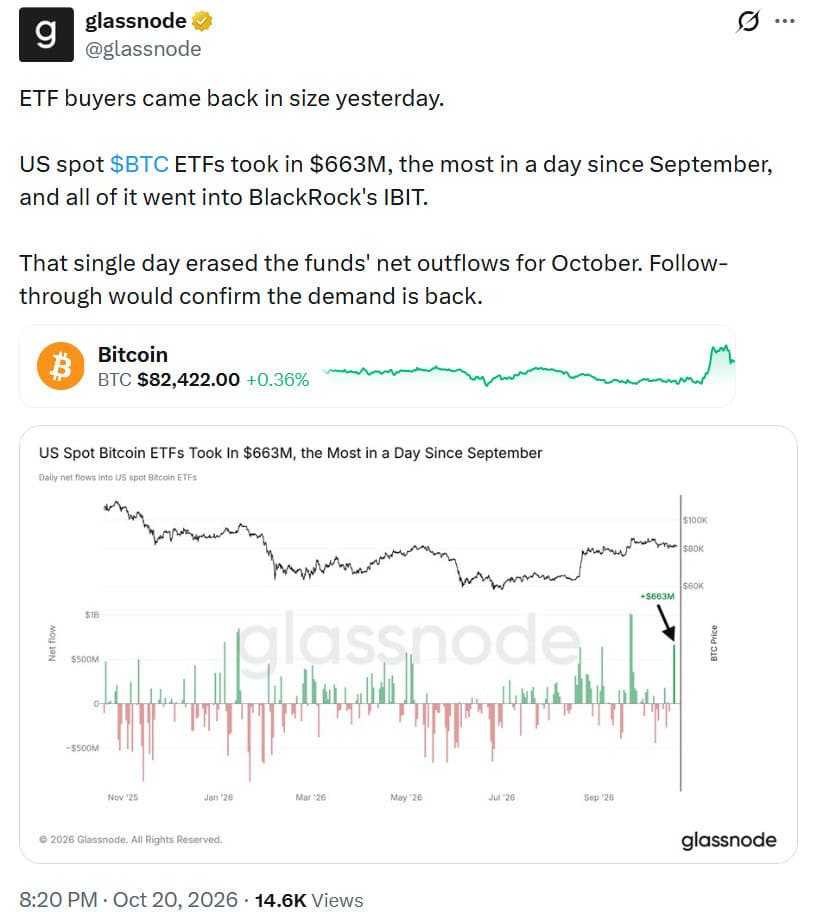
U.S. spot Bitcoin ETFs reported $663 million in inflows on October 19, led by BlackRock’s IBIT, though adjusted net inflows were closer to $527 million. Source: Glassnode via X
The daily inflow was the strongest since September, according to the supplied Glassnode analysis, and represented a significant change from the selling pressure seen earlier in October. However, the latest available figures showed that US spot Bitcoin ETFs remained down approximately $90.6 million for the month through October 19. The single-day inflow therefore narrowed October’s cumulative outflows but did not fully erase them.
The figures suggest that institutional demand may be returning, particularly through BlackRock’s fund. Yet one strong session does not establish a durable trend. Continued positive flows across multiple trading days would provide stronger evidence that investors are increasing their exposure to Bitcoin rather than making a short-term allocation.
Bitcoin Price Prediction: RSI Signals a Potential Recovery
Technical analysis shared by market commentator @Wealthmanager showed Bitcoin holding above a key daily support zone, with the 14-period RSI near 46. The indicator measures the strength of recent price movements and can help traders identify changes in momentum.
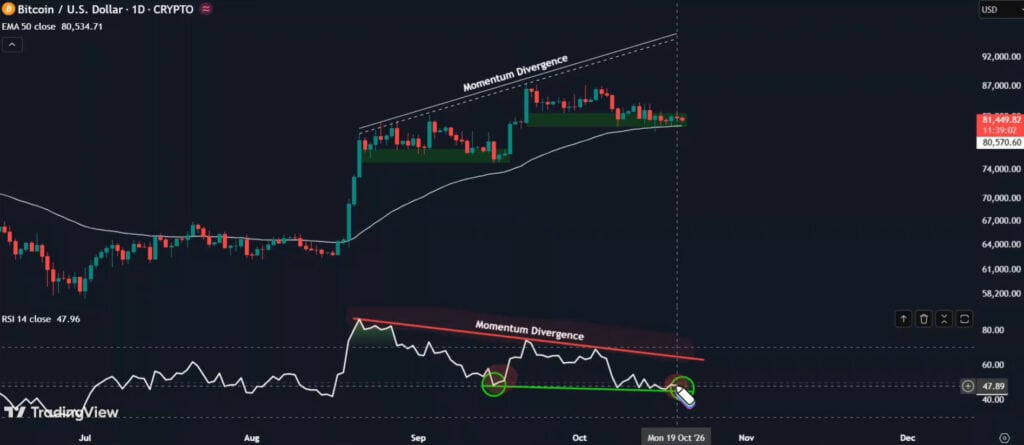
Bitcoin is holding above key daily support, while the 14-period RSI approaches levels that previously attracted buyers. Source: @Wealthmanager via X
The accompanying chart compares recent price action with earlier RSI divergences, highlighting periods when weakening downside momentum preceded price recoveries. If Bitcoin maintains support and the RSI begins moving higher, the setup could strengthen the case for a recovery. However, an RSI reading near 46 is not, by itself, a bullish confirmation. A sustained momentum shift and a break above nearby resistance would provide clearer evidence.
For the BTC price prediction, the immediate focus remains on whether buyers can defend the current support area and push the price above the recent trading range. Failure to hold support would weaken the recovery setup and could expose Bitcoin to another decline.
Bitcoin Price Faces a Key Test Above $84K
A CoinGlass liquidation heatmap showed Bitcoin advancing from around $81,000 to above $84,000, crossing a price area containing concentrated leveraged positions. Such heatmaps estimate where liquidation orders may cluster, helping traders identify levels where rapid price movements could trigger forced position closures.
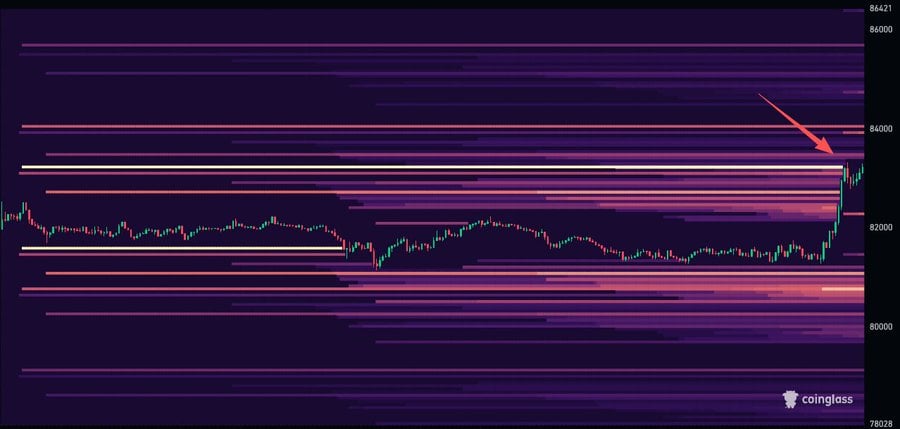
Bitcoin’s liquidation heatmap shows a sharp rally from around $81,000 to above $84,000, breaking through a key liquidity level. Source: CoinGlass via X
A move above a heavily populated short-liquidation zone can accelerate gains if bearish traders are forced to close their positions by buying back Bitcoin. However, liquidation clusters do not guarantee a breakout, and the resulting momentum may fade once forced buying subsides.
The $84,000 area therefore represents an important near-term reference point in the supplied chart analysis. A sustained move above this zone could improve the technical outlook, while a rejection may leave BTC vulnerable to renewed consolidation. Reaching $90,000 would require Bitcoin to clear intervening resistance and attract sufficient follow-through buying.
Bitcoin May Be Entering an Accumulation Phase
Crypto analyst @misterrcrypto argued that Bitcoin’s current consolidation resembles the 2022–2023 accumulation period, when the market traded within a broad range before beginning a stronger recovery. The analyst’s chart identified a potential bottoming phase around $81,000 and suggested that prolonged sideways trading could precede another advance.
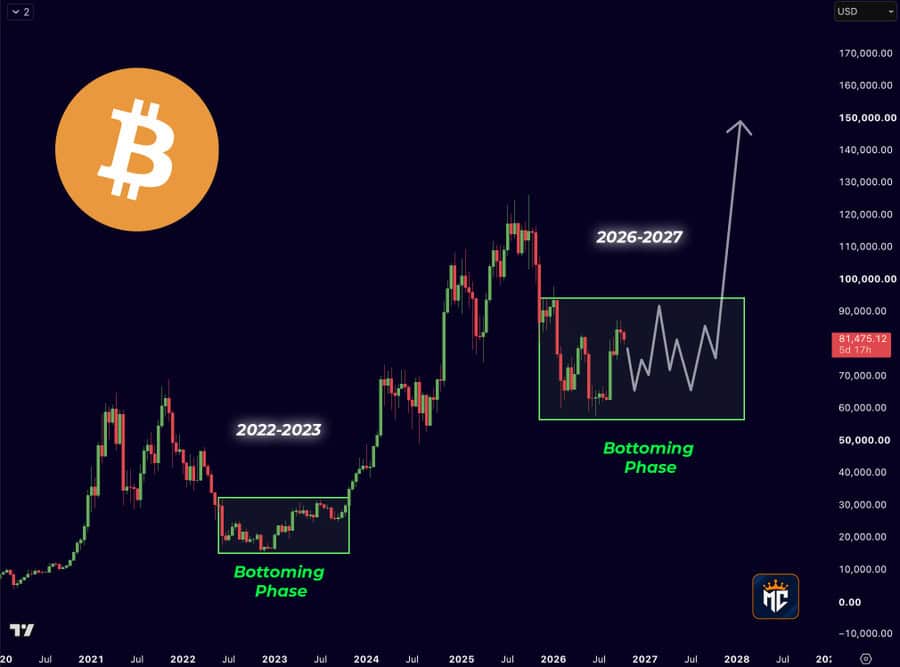
The attached chart overlays a “bottoming phase” box on 2026-2027 price action around $81,000, mirroring the 2022-2023 consolidation that preceded strong gains. Source: @misterrcrypto via X
Historical comparisons can help frame market scenarios, but they cannot establish that the same sequence will repeat. The duration of consolidation, investor demand, macroeconomic conditions, and the amount of available liquidity can all influence the next major move.
If Bitcoin continues to hold its recent support while buying pressure gradually improves, the accumulation thesis could gain credibility. Conversely, a breakdown below support would challenge the idea that the current range represents a durable market bottom.
Weak Spot Demand Remains a Risk for BTC
CryptoQuant’s apparent demand growth indicator continued to show negative readings in recent months, according to its latest analysis. The metric compares changes in Bitcoin supply with estimated demand to assess whether the market is absorbing available coins. Negative readings suggest that demand has not consistently kept pace with the supply entering circulation.
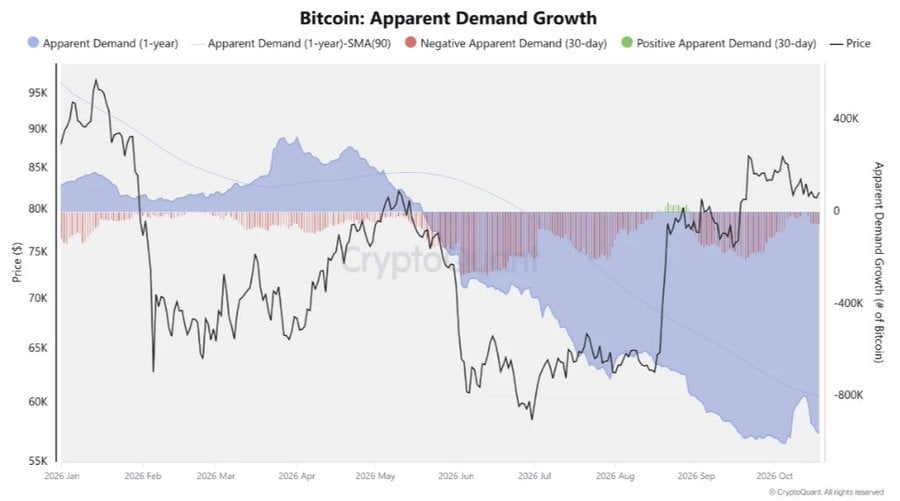
Bitcoin’s apparent demand growth has turned negative in recent months, indicating weak spot buying as prices consolidate near $80,000 in October 2026. Source: @cryptoquant_com via X
CryptoQuant contributor Rei Researcher noted that Bitcoin had recovered toward $82,000 even as apparent demand remained negative. The analysis indicated that demand had weakened since May 2026 and that short-term improvements had not yet produced a sustained reversal.
This creates an important distinction between a price rebound and a broader recovery. ETF inflows and short liquidations can support upward moves, but stronger spot buying would help demonstrate that investors are accumulating Bitcoin at current prices. Without that confirmation, rallies could remain vulnerable to profit-taking and renewed selling pressure.
Can Bitcoin Break the $90K Barrier?
Bitcoin’s near-term outlook depends on whether institutional inflows continue, technical support holds, and spot demand improves. BlackRock’s latest ETF inflow provides a constructive signal, while the move above $84,000 highlights the potential for derivatives positioning to amplify price changes.
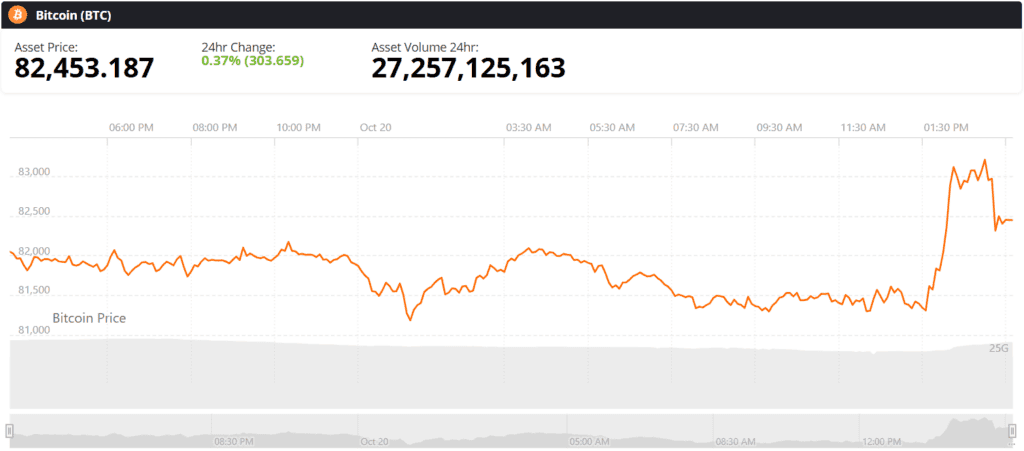
Bitcoin (BTC) was trading at around $82,453 at press time. Source: Brave New Coin
However, the negative apparent-demand readings and October’s still-negative cumulative ETF flows show that the recovery remains unconfirmed. Traders will be watching for sustained ETF inflows, a stronger RSI, and a decisive break above nearby resistance before treating $90,000 as a more immediate target.
For now, $90,000 remains a potential upside objective for BTC price rather than a confirmed destination. A sustained move toward that level would require broader participation from spot buyers alongside continued institutional demand.
 Brave New Coin reaches 1M+ engaged crypto enthusiasts a month through our website, podcast, newsletters, and YouTube. Get your brand in front of key decision-makers and early adopters in 2026. Limited slots remaining! Find out more today!