Bitcoin (BTC) Price Today: $65K Support Under Pressure as Glassnode Maps $60K–$62K Liquidation Cluster

Bitcoin faces renewed selling pressure near $65,000 as weakening demand, negative ETF flows, and underwater investor positions increase downside risks.
Glassnode’s futures liquidation heat map identifies a concentrated cluster of leveraged long positions between $60,000 and $62,000, raising concerns that another decline could trigger forced liquidations.
Meanwhile, CryptoQuant data show that large-holder accumulation has failed to offset broader distribution. However, several momentum indicators suggest Bitcoin price is oversold, as its moving-average structure continues to reflect a bearish trend.
Bitcoin Liquidation Heat Map Puts $60K–$62K in Focus
Glassnode’s liquidation heat map highlights a significant concentration of Bitcoin futures long positions between $60,000 and $62,000. These positions are associated with leveraged entries around the August breakout.
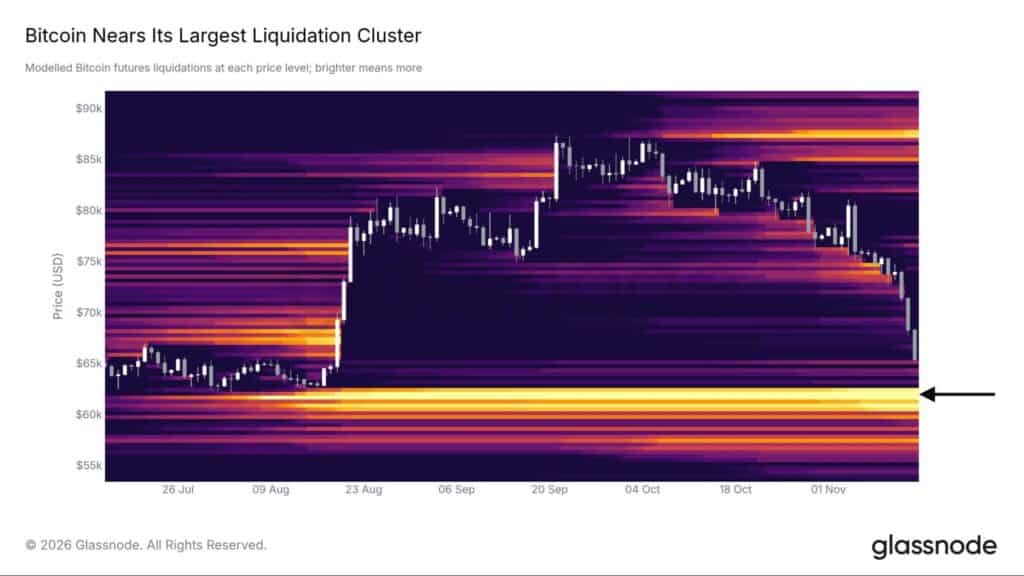
The chart highlights a significant concentration of Bitcoin futures long liquidations around $60,000–$62,000, linked to positions opened during the August breakout. Source: Glassndoe/X
Liquidation clusters identify price areas where leveraged traders could face forced position closures. If Bitcoin enters this zone, automatic liquidations could increase selling pressure and accelerate an existing decline.
While the $60,000–$62,000 range is not a confirmed downside target, the concentration of leveraged positions makes it a critical zone to monitor if Bitcoin’s selling pressure intensifies. Following weeks of November selling, traders are watching whether nearby support can hold or whether leveraged positions face another round of liquidations.
Recent Bitcoin Buyers Face Unrealized Losses
CryptoQuant reports that Bitcoin’s 24% decline has pushed recent buyers into negative unrealized returns. Their unrealized profits have fallen from approximately 35% in September to -15%, with an estimated on-chain cost basis of $80,300 against market prices near $65,000.
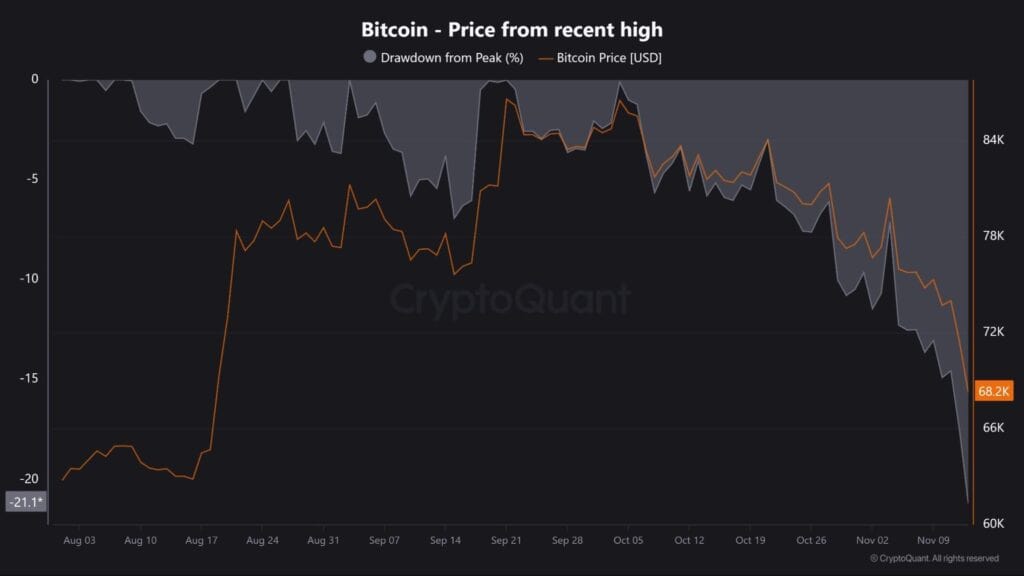
Bitcoin’s 24% decline has pushed recent buyers into losses, with unrealized returns falling from +35% in September to -15% as their $80,300 cost basis exceeds current prices near $65,000. Source: CryptoQuant/X
Wallet activity also reveals contrasting behavior among large holders. Addresses holding at least 1,000 BTC have accumulated approximately 47,000 BTC. However, wallets holding between 10 and 1,000 BTC have reduced their balances by around 65,000 BTC.
Negative US spot Bitcoin ETF flows and 30-day apparent demand of approximately -284,000 BTC add to the pressure. These figures suggest that accumulation among the largest holders has not been sufficient to offset broader distribution and weak market demand.
CryptoQuant identifies $68,700–$76,000 as an important resistance range. On the downside, $63,000 is a nearby support reference, while Bitcoin’s realized price near $53,800 represents a deeper on-chain level to monitor.
Bitcoin | Expanded Flat or Zigzag?
Elliott Wave analyst Mehdi_Abbasi_EWP identifies two possible interpretations of Bitcoin’s broader correction.
Bitcoin previously declined from $126,272 to approximately $57,870 before recovering toward $87,330. The latest downturn has created uncertainty over whether the recovery completed a corrective pattern or represented the first phase of a larger structure.
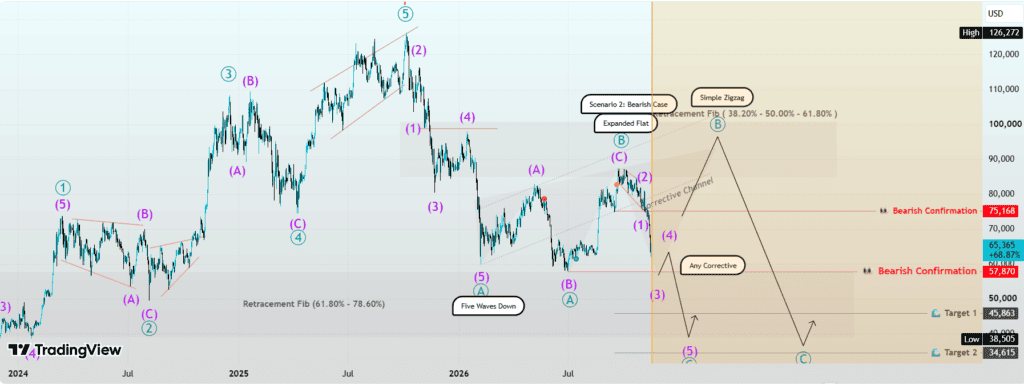
Bitcoin has developed a five-wave bearish Elliott Wave structure following its peak at $126,272. Source: Mehdi_Abbasi_EWP/TradingView
Scenario 1: Expanded Flat
Under the Expanded Flat interpretation, the recovery toward $87,330 may have completed Waves A and B, with the current decline beginning Wave C.
A five-wave bearish structure in the ongoing decline would support this scenario. A break below $57,870 would provide further confirmation.
The analyst identifies $45,863 and $34,615 as potential downside targets if this structure develops.
Scenario 2: Zigzag
The alternative interpretation views the advance from $57,870 to $87,330 as Wave A of a larger Zigzag correction.
Under this scenario, the current decline represents Wave B, leaving room for another corrective recovery before Wave C begins. The $95,000–$96,000 region, corresponding to the 38.2%–61.8% Fibonacci retracement zone, is an area to watch if buyers regain control.
However, the subsequent Wave C could still produce another decline, with $34,615 remaining a potential downside target.
The Structural Difference Between the Two Scenarios
The main distinction concerns whether the advance toward $87,330 completed an Expanded Flat’s corrective structure or represented the first wave of a larger Zigzag.
The internal wave structure and price behavior around $57,870 will help determine which interpretation is more consistent with market developments. Neither scenario is confirmed at this stage.
Bitcoin Technical Analysis: Oversold Signals Emerge Amid Bearish Momentum
Bitcoin trades near $65,458 in the supplied BITSTAMP technical snapshot, down approximately 2.49% in the latest session.
The overall technical summary shows a Sell signal, with 14 sell readings, five neutral, and seven buy signals. Moving averages carry a Strong Sell designation, while oscillators lean toward Buy as several momentum indicators enter oversold territory.
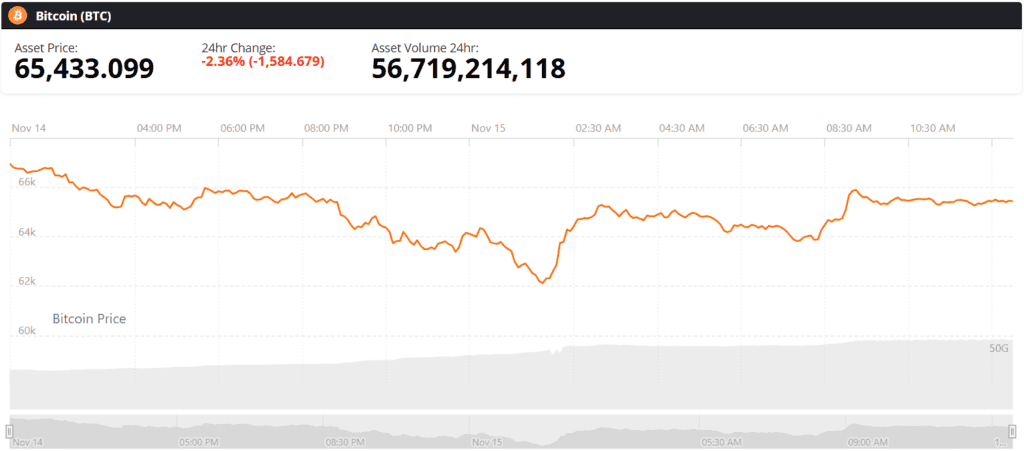
Bitcoin (BTC) price chart. Source: Brave New Coin
The Relative Strength Index (RSI) stands at 25, while the Stochastic %K is at 9 and the Commodity Channel Index (CCI) reads -215. These levels indicate substantial selling pressure and leave room for a potential short-term rebound.
However, the MACD remains negative at -3,499, while the Average Directional Index (ADX) stands at 31, indicating an established trend. The broader technical structure therefore remains bearish despite oversold readings.
Nearly all major moving averages sit above Bitcoin’s current price. The 10-day EMA is around $70,783, the 20-day EMA at $73,926, and the 50-day EMA near $77,094. The 200-day EMA stands at approximately $76,035.
These averages could create successive resistance barriers during a recovery. Bitcoin would need to reclaim the $70,000–$73,000 region before challenging higher levels.
Key Levels to Watch
Classic pivot calculations identify $80,274 as the central pivot, with resistance at $84,375, $91,321, and $102,367.
On the downside, support levels stand at:
- $73,329: First support
- $69,227: Second support
- $58,181: Third support
These levels complement the $63,000 support identified by CryptoQuant. A sustained breakdown could expose Bitcoin to the previous low near $57,870 and the realized price around $53,800.
Bitcoin Price Outlook: Will $65K Hold or Will Sellers Target $60K?
Bitcoin’s immediate outlook depends on whether buyers can defend the $63,000–$65,000 region and restore demand. Glassnode’s $60,000–$62,000 liquidation cluster highlights the potential for additional volatility if selling accelerates.
On the upside, $68,700 is an important initial resistance, followed by the broader $70,000–$76,000 region. Oversold momentum indicators could support a temporary recovery, but stronger spot demand and improved ETF flows would be necessary to challenge the broader bearish structure.
For now, weak demand, negative momentum, and persistent distribution keep downside risks elevated. Bitcoin’s reaction around nearby support levels will help determine whether the latest decline stabilizes or develops into another leg lower.
 Brave New Coin reaches 1M+ engaged crypto enthusiasts a month through our website, podcast, newsletters, and YouTube. Get your brand in front of key decision-makers and early adopters in 2026. Limited slots remaining! Find out more today!