Bitcoin (BTC) Price Today: Glassnode Flags Rising Hyperliquid Whale Shorts as BTC Breaks Below 50-Week MA

Bitcoin (BTC) is facing renewed selling pressure as large traders on Hyperliquid increase bearish bets, while the weekly close below a key long-term moving average raises concerns about further downside.
On-chain data from Glassnode shows a significant shift in whale positioning, adding to an increasingly cautious technical outlook.
BTC traded near $74,704 on Bitstamp, down approximately 1.45% at the latest available reading. The decline followed a weekly close around $74,968, below the 50-week moving average (MA), which stood between approximately $75,200 and $75,500. The move ended a seven-week streak above the indicator and marked Bitcoin’s first weekly close below it in roughly two months.
Glassnode Shows Hyperliquid Whales Increasing Bitcoin Shorts
Glassnode data indicates that large traders on Hyperliquid have shifted their Bitcoin perpetual futures positioning from net long to net short. The change occurred approximately two weeks ago, ending a seven-month period during which these traders maintained a predominantly bullish position.
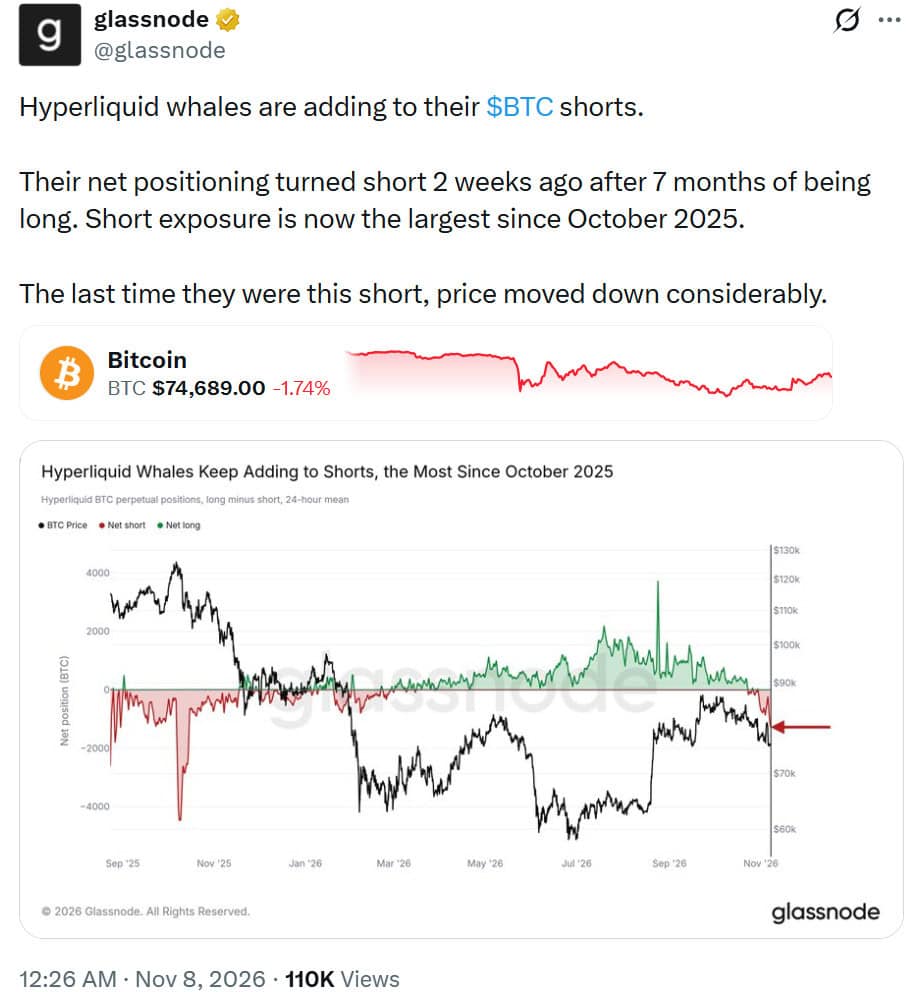
Hyperliquid whales have increased Bitcoin perpetual shorts, flipping their net positioning short two weeks ago after seven months long. Source: Glassnode via X
The 24-hour mean net positioning metric, which measures the difference between long and short exposure, shows that bearish positions have continued to increase. Short exposure has now reached its highest level since October 2025.
The historical comparison adds another layer of concern. The last time Hyperliquid whales maintained a comparable level of short exposure, Bitcoin experienced a considerable price decline. Although historical positioning does not establish that another selloff will follow, the latest data highlights growing caution among large derivatives traders.
The shift also coincides with Bitcoin’s failure to maintain support above the 50-week MA. Together, the derivatives positioning and weakening price structure suggest that large traders are becoming more defensive as the market searches for support.
Bitcoin Price Breaks Below 50-Week Moving Average
Bitcoin’s weekly close near $74,968 placed the asset below its 50-week MA, estimated at $75,200–$75,500. According to market commentary shared by AshCrypto, the breakdown ended a seven-week period above the indicator.
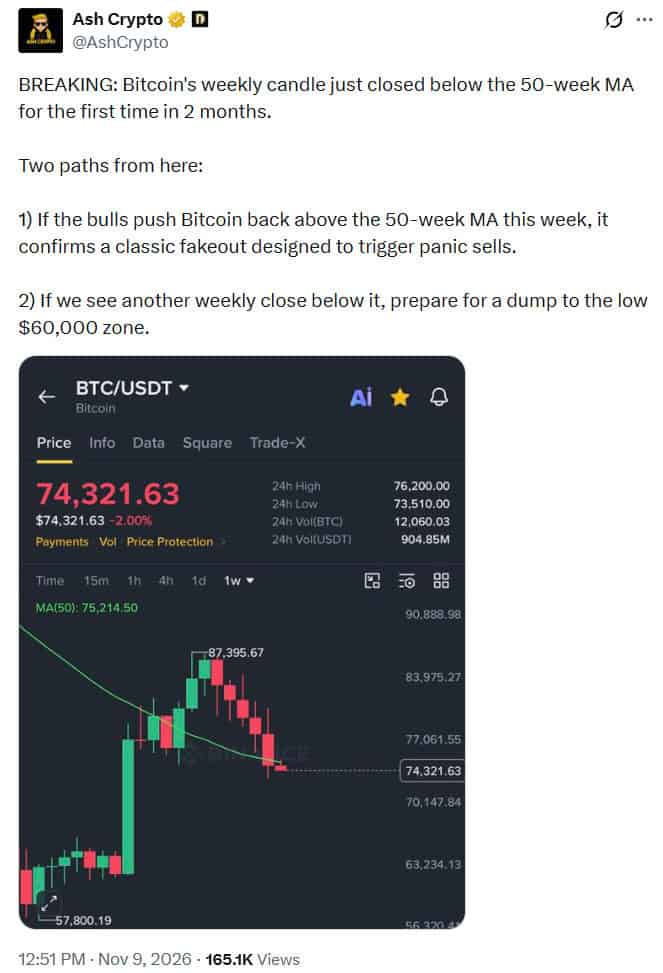
Bitcoin closed the week at approximately $74,968, breaking below the 50-week MA for the first time in two months and ending a seven-week streak above it. Source: @AshCrypto via X
The 50-week MA is closely watched because it provides a reference for Bitcoin’s longer-term trend. Previous market cycles have shown that sustained trading below this level can coincide with extended periods of weakness. However, temporary breaches have also occurred without establishing new cycle lows.
AshCrypto outlined two possible developments following the latest breakdown. A quick recovery above the 50-week MA during the current week could turn the move into a bullish fakeout, potentially trapping traders who entered short positions during the decline.
Conversely, another weekly close below the indicator would strengthen the bearish technical picture. Under that scenario, Bitcoin could face additional selling pressure, with the low-$60,000 region emerging as a potential downside area.
Historical comparisons from the 2011–2012 and 2019–2020 market cycles offer some context. In both periods, Bitcoin experienced dips below the 50-week MA after reclaiming the indicator without subsequently establishing new cycle lows. BTC is currently around 26% above its June 2026 low of $59,517.
BTC Technical Indicators Show Broad Selling Pressure
TradingView’s latest technical summary gives Bitcoin an overall Sell rating. Moving averages account for most of the negative readings, with 12 Sell signals, one Neutral signal, and two Buy signals. Oscillators present a more mixed picture, although the combined technical assessment remains bearish.
The aggregate reading stands at 13 Sell, seven Neutral, and six Buy signals. This suggests that the prevailing trend remains negative despite signs that some short-term momentum indicators are approaching oversold conditions.
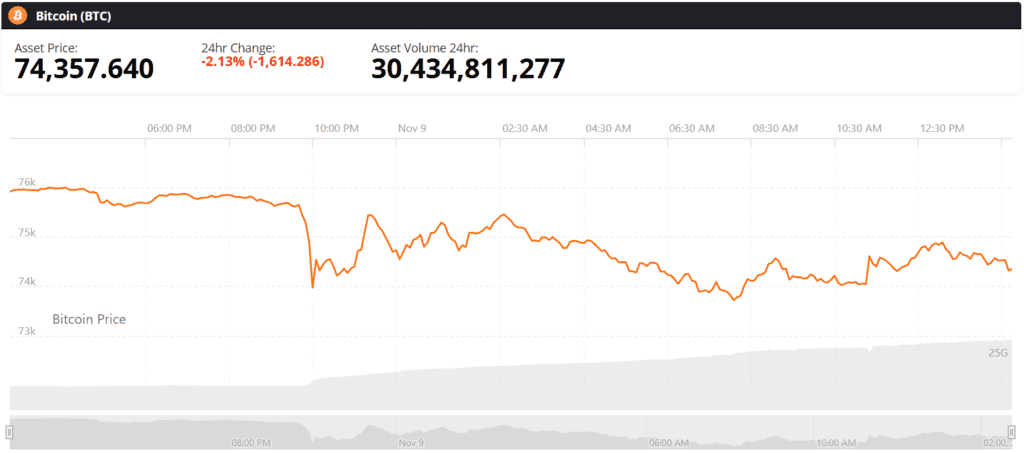
Bitcoin (BTC) price chart. Source: Brave New Coin
The Relative Strength Index (RSI) stands at 36, placing it below the midpoint of its range but above the conventional oversold threshold of 30. Meanwhile, the Stochastic indicator has fallen to 14, the Commodity Channel Index (CCI) stands at -127, and Williams Percent Range has reached -85. All three readings indicate stretched downside momentum and generate Buy signals under the TradingView methodology.
However, the Moving Average Convergence Divergence (MACD) remains negative at -1,709, maintaining a Sell signal. This divergence suggests that short-term selling pressure has become extended, but the broader momentum structure has yet to show a convincing recovery.
Bitcoin also trades below most of its key short- and medium-term moving averages. The 10-day EMA stands near $76,573, while the 20-day EMA is around $78,050. The 50-day EMA is approximately $79,209, placing several resistance levels above the current market price.
The 200-day simple moving average (SMA), near $73,153, remains an important longer-term reference. BTC is still trading above this level, leaving some room for the market to stabilize before testing deeper support.
Bitcoin Price Prediction: Key Support and Resistance Levels
Bitcoin’s immediate technical structure points to the $73,300–$73,150 region as an important support zone. This area combines the classic pivot S1 near $73,329 with the 200-day SMA around $73,153.
A sustained move below this confluence could expose the next downside level near $69,227, corresponding to the classic pivot S2. Further weakness could bring the broader $60,000 region into focus, particularly if Bitcoin records another weekly close below the 50-week MA.
On the upside, the first resistance area sits between approximately $76,500 and $78,500. This range includes the 10-day and 20-day moving averages, which Bitcoin would need to reclaim to improve its short-term technical structure.
A stronger recovery toward $79,200–$80,274 would encounter another resistance cluster, including the 50-day EMA and the classic central pivot. Reclaiming these levels would provide additional evidence that buyers are regaining control.
For now, Glassnode’s derivatives data, the weekly moving-average breakdown, and TradingView’s broader Sell rating point to continued caution. A recovery above the 50-week MA would weaken the immediate bearish signal, while another weekly close below it would keep lower support levels in focus.
 Brave New Coin reaches 1M+ engaged crypto enthusiasts a month through our website, podcast, newsletters, and YouTube. Get your brand in front of key decision-makers and early adopters in 2026. Limited slots remaining! Find out more today!