Bitcoin Price Analysis – Hash rate continues increasing

![]()
Network mining fundamentals have continued to soar in recent weeks with a new hash rate and difficulty all-time high. If the hash rate continues to increase over the next few months, the block reward halving will occur much sooner than the currently projected May date.
Bitcoin (BTC) is a decentralized digital currency released by Satoshi Nakamoto in 2009. The market cap is currently US$185.5 billion, with US$6.44 billion traded in the past 24 hours. The current spot price is down 49% from the all-time high established in December 2017.

The BTC network is secured by the SHA-256 consensus algorithm. Both the network hash rate and network difficulty repeatedly posted record highs in 2019. The increases were likely due to both new ASICs being manufactured as well as relatively cheap electricity available in China, and elsewhere, enabling older ASICs to again become profitable. As BTC spot prices began to decline later in the year, the hash rate increases slowed slightly, leading to a temporary and volatile hash rate plateau.
Average block times are currently just under ten minutes, with an estimated -1.17% difficulty adjustment in roughly two days. Network difficulty adjusts up to +/-25% every 2,016 blocks. As hash rate decreases before a difficulty adjustment, block times increase. As hash rate increases before a difficulty adjustment, block times decrease. The adjustment will target a 10 minute blocktime.

Watch a summary of this analysis on YouTube
BTC inflation stands at 3.67% and is set to decrease in a stepwise fashion over time. The next block reward halving is estimated to be 88 days from now, around May 12th, when annual inflation will decrease to 1.80%. As miners add hash rate to the network, and maintain a block time less than 10 minutes, the estimated time until the next halving will continue to slowly decrease.

Source: BitInfoCharts
Twenty-three new SHA-256 ASICs were released in 2019, with two released by Bitmain in December. The most profitable miners are currently the; Bitmain Antminer S17+, ASICminer 8 Nano Pro, MicroBT Whatsminer M20S, and the Bitfury Tardis.
Renewable energy sources around the world, including hydroelectric and geothermal power, bring electricity prices for most mining farms to US$0.04 cents/KWh or lower. Excluding the Bitmain Antminer S3, S5, S7, and V9, all ASICs are currently profitable at this electricity price point. If electricity prices suddenly rise in areas with large mining farms, the hash rate may drop. If BTC prices also drop, more and more ASICs become unprofitable and the hashrate will drop further.

Source: asicminervalue
Overt ASICBoost use continues to post record highs and currently accounts for 65% of all mined blocks. This competitive mining advantage will continue to squeeze out miners who do not leverage the software efficiency increase. Overt ASICBoost has no detrimental effects on the network and makes mining more profitable by lowering energy use. Other network factors that influence mining profitability include; price, block times, difficulty, block reward, and transaction fees.

Source: asicboost.dance
On the network side, both the on-chain transactions per day (line, chart below) and average transaction value in USD (fill, chart below) have risen significantly since April 2018 and February 2019, respectively. The current record for transactions in a single day was set in December 2017, at 500,000. The current record for average transaction values in USD was set on July 24th, at US$51,000.
Since July 2019, both of these metrics have declined, with transactions per day currently near 330,000 and the average transaction value at nearly US$9,300. Since the beginning of the year, both metrics have increased. Unconfirmed transactions have mostly held below 20,000 since August 2019, during peak congestion, and have dropped below 5,000 during off-peak times (not shown).

Source: CoinMetrics
The number of transactions using SegWit has ranged between 50% and 60% over the past few months. This significant increase was largely due to VeriBlock (VBK) implementing SegWit. VBK currently accounts for 1.46% of all on-chain transactions. Binance, the biggest exchange globally by users and trading volume, has yet to adopt SegWit addresses.
Segwit, or BIP141, activated on August 23rd, 2017 via a user-activated soft fork. The change allows individual transactions to occupy less block space than a non-SegWit transaction, and provides an effective block size limit of roughly 2.2MB. Although both non-SegWit and SegWit transactions can be sent over the network, SegWit users pay less in accumulated fees to achieve the same number of transactions.

Source: segwit.space
The average block size (fill, chart below) increased substantially from April 2018 to June 29th 2019, due to both an increase in on-chain activity as well as VBK, which secures other blockchains through the Proof of Proof consensus mechanism. From June 29th to late December, the average block size has dropped from nearly 4 MB to 1.35 MB. Since then, block size has increased to 1.6 MB.
The average transaction fee (line, chart below) is currently US$0.87, despite a growing block size and increased on-chain use since the record high fee of US$62 in late December 2017. Both the lack of zero-fee unconfirmed transactions and increased scalability have kept fees substantially lower than late in 2017.
Additionally, transaction batching and the increasing off-chain capabilities of the Lightning Network have decreased on-chain transaction bloat. Transaction batching is most effective for entities with a high amount of on-chain transaction outputs, such as miners and exchanges.

Source: CoinMetrics
The 30-day Kalichkin network value to on-chain transactions ratio (NVT) decreased from July to late-October and is currently 97 (line, chart below). While Kalichkin’s NVT does not account for inflation or the use of off-chain transactions, which would decrease the overall NVT ratio, the metric remains in the upper-third of the historic range.
The three previous highs in NVT, in February 2011, October 2014, and October 2018, were all followed by bearish price moves. Based on this metric, the probability for a local top in price will increase if another local NVT high is reached. In December 2018, NVT bottomed out at 46 before a price reversal.
Monthly active addresses (MAAs) increased substantially, from January 2019 to mid-July 2019 (fill, chart below), decreased from July to January, and have begun increasing again. MAAs grew to 850,000 in July 2019, from a yearly low of 550,000, and are currently around 750,000.
Daily active addresses (DAAs) surpassed one million three times in 2019, on June 14th, 26th, and 28th. June 2019 was the first-month that DAAs exceeded one million since February 2018. On December 14th, 2017, DAAs exceeded 1.28 million.
The Bitcoin network has far more active addresses than any other blockchain. A large uptick or sustained increase in DAAs should be seen as a bullish indicator for market prices as it suggests an increase in on-chain BTC demand. As off-chain transaction facilities increase, daily active addresses may stagnate or decline over time.

Source: CoinMetrics
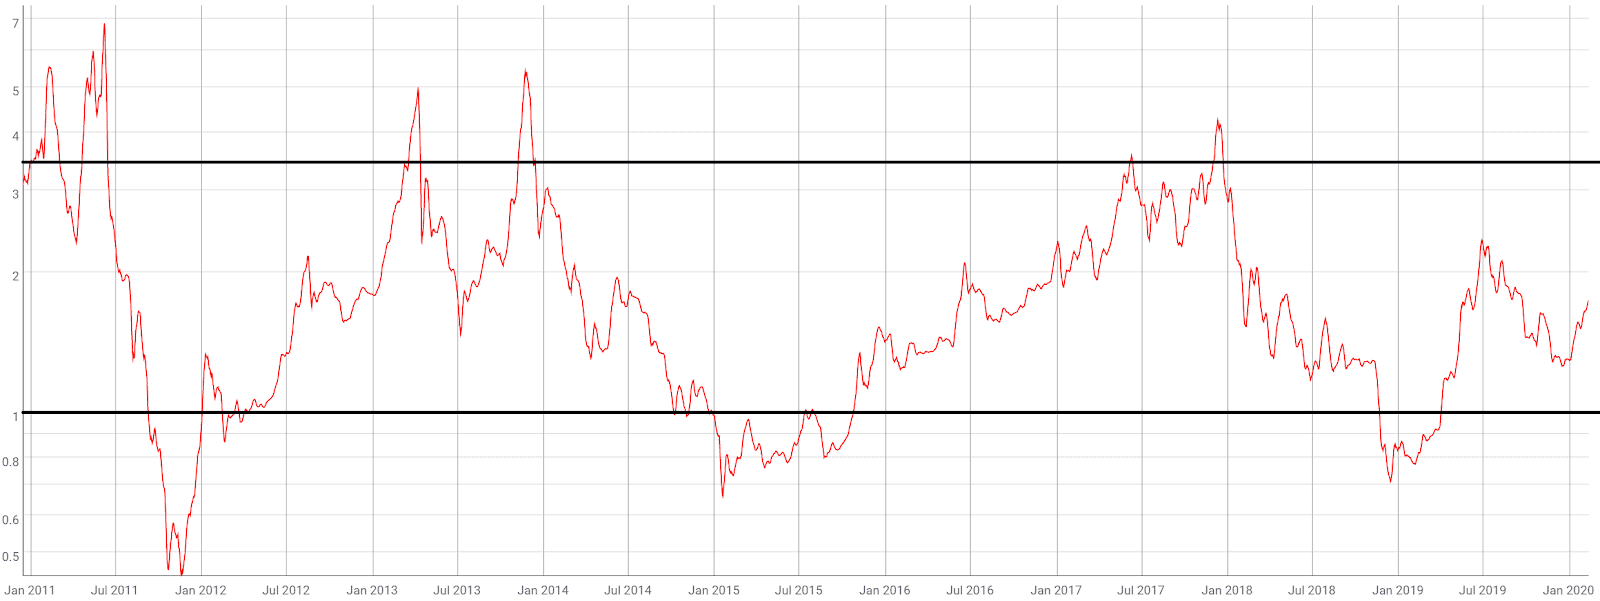
The market cap divided by the realized cap (MVRV) is another crypto-native fundamental metric used to assess overbought or oversold conditions. Realized cap approximates the value paid for all coins in existence by summing the market value of coins at the time they last moved on the blockchain.
Historically, periods of an MVRV less than one have represented oversold conditions, whereas periods of an MVRV greater than 3.5 have represented overbought conditions. Of the MVRV levels above four since January 2013, all three have coincided with record highs in price. Currently, MVRV is 1.74 and rising, suggesting the possibility of a bullish bias.
Source: CoinMetrics
Analyzing the age of unspent transaction outputs (UTXOs), or unspent coins, can also provide some insights into price movements. Spikes in newly moved coins tend to correlate with local tops or bottoms in market values, and can represent euphoria or capitulation. Coins which have not moved recently are represented in cooler colors, whereas coins on the move are represented by warmer colors.
Coins that have not moved in more than five years (dark blue) account for 21.64% of the circulating supply, or 3.94 million BTC. The six to twelve month age band (yellow), or coins not moved since February 2019 – August 2019, holds the next highest distribution at 14.19%. The one to the three-month band (orange) had gained 5% since April 2019, but has fallen in recent months. Historically, local tops in price have occurred when the one to three-month band, currently 7.67%, has represented more than 15% of all circulating UTXOs.

Source: https://plot.ly/~unchained/37.embed
Turning to developer activity, Bitcoin Core version 0.19.0.1 was released in November 2019 and provided various bug fixes and performance improvements. Future potential protocol improvements in the pipeline include Schnorr signatures, Taproot, and Graftroot.
Schnorr signatures and signature aggregation also bring the potential for storage and bandwidth reduction by at least 25%. Taproot and Graftroot improve upon Merkelized Abstract Syntax Trees (MAST) which offers three benefits; smaller transactions, more privacy, and larger smart contracts.
In September 2019, Pieter Wuille of Blockstream also unveiled plans for miniscript, a simplified way to write Bitcoin code. The current version, Script, is complex and difficult to use for those not intensely familiar with the language.
According to Wuille, miniscript allows a user to write some Bitcoin scripts, “in a structured, composable way that allows various kinds of static analysis, generic signing, and compilation of policies.” Miniscript is in the early stages of development and is currently being tested internally at Blockstream.
More than 170 developers have contributed nearly 1,700 commits in the past year, mostly on the main Github repo. Most coins use the developer community of GitHub where files are saved in folders called "repositories," or "repos," and changes to these files are recorded with "commits," which save a record of what changes were made, when, and by who. Although commits represent quantity and not necessarily quality, a higher number of commits can signify higher developer activity and interest.
The BTC project on Github has two active repos, “bitcoin” (top chart, shown below) and Bitcoin Improvement Protocols, “BIPs” (bottom chart, shown below).

Source: Github – bitcoin

Source: Github – bitcoin/bips
BTC exchange-traded volume over the past 24 hours has been dominated by Tether (USDT) trading, with the United States Dollar (USD) markets representing 4.33% of the total volume. Tether is a stable coin with a soft peg to the USD. Stablecoins in general currently represent nearly 90% of all reported volume over the past 24 hours.
In 2019, VanEck-SolidX once again withdrew its BTC ETF proposal from the Securities and Exchange Commission (SEC) review process. All previous ETF proposals thus far have been rejected by the U.S regulator. So far, the SEC has delayed decisions on all active BTC ETF applications. However, there are already several BTC ETNs available, in various jurisdictions across the globe, which are seeing increasing volumes.
In place of a traditional ETF, VanEck-SolidX introduced a limited version of a BTC ETF, made available to qualified institutional buyers. The 144a product currently has US$657,000 under management. The Bakkt physically-settled BTC futures exchange launched in September 2019 and has seen increasing volumes throughout 2019. Bakkt and the Chicago Mercantile Exchange (CME) have also launched a BTC options product.

Global over the counter (OTC) volume, from LocalBitcoins.com, declined from late 2017 to mid 2019, and then declined again from mid 2019 to early 2020. Global notional volume has held near or above US$50 million since the beginning of the year. In May 2019, LocalBitcoins discontinued servicing Iran, likely as a result of U.S sanctions and in June 2019, the option to pay for BTC in person with cash was disabled.
Latin America (brown) holds the highest percentage of total notional volume, followed by Eastern Europe (orange). The Middle East (yellow) and the Australia/New Zealand regions (grey) hold the lowest notional volume, both posted less than US$600,000 in trade volume over the past week. Notional volumes for Venezuela and Columbia stand at US$5.37 million and US$2.20 million, respectively. Venezuela’s central bank also announced plans to hold BTC within its reserve system.

Source: UsefulTulips
Worldwide Google Trends data for the term "bitcoin" increased dramatically from March to June 2019, marking a new yearly high. Since June, search interest has dropped but has begun to increase slightly again.
The previous increase in search traffic has likely been related to both the sharp increase in price in Q2 as well as mentions from several prominent U.S government officials, including the President of the United States. Throughout the course of 2018, “bitcoin” related searches declined dramatically. Despite the declining interest, the search “what is bitcoin” was the most popular “what is” Google search of 2018.
A slow rise in searches for "bitcoin" preceded the bull run in Q4 2017, likely signaling a large swath of new market participants at that time. However, a 2015 study found a strong correlation between google trends data and BTC price whereas a 2017 study concluded that when U.S. Google "bitcoin" searches increased dramatically, BTC price dropped.

Technical Analysis
On the daily chart for the BTC/USD market, the spot price relative to the 50-day Exponential Moving Average (EMA) and 200-day EMA can be used as a litmus test for the trend. In late January, the 50-day EMA crossed above the 200-day EMA, which is known as a Golden Cross, and is considered an extremely bullish trend signal. The 50-day EMA is currently at US$8,930 and the 200-day EMA is currently at US$8,470, both should now act as support.
The volume Profile of the Visible Range (VPVR) shows a large volume support node at US$8,200 (horizontal bars, chart below) with very little volume resistance above the current price zone. Additionally, yearly Pivot Points, at US$13,000 and US$18,600, should both act as resistance while the yearly pivot at US$8,100 should also act as support.
The Bitfinex long/short ratio (top panel, chart below) is currently 80% long, with longs increasing significantly over the past week, reaching record high levels. A significant price movement downwards will result in an exaggerated move further, as the long positions will begin to unwind. This is known as a “long squeeze.” There are also bearish volume and RSI divergences building, suggestive of waning bullish momentum.

A high timeframe Pitch Fork (PF) with anchor points in January, July, and August 2015 shows price reaching the upper resistance limit of US$14,000 in late June 2019 and then returning to the support zone in November and December. Throughout any given trend price returns to the median line several times, currently at US$15,000 (yellow).

Turning to the Ichimoku Cloud, there are four key metrics; the current price in relation to the Cloud, the color of the Cloud (red for bearish, green for bullish), the Tenkan (T) and Kijun (K) cross, and the Lagging Span. The best entry always occurs when most of the signals flip from bearish to bullish, or vice versa.
On the daily chart, Cloud metrics are bullish; the spot price is above the Cloud, the Cloud is bullish, the TK cross is bullish, and the Lagging Span is above the Cloud and above price. Price is currently 20% above the Kijun, which is suggestive of overbought conditions.

Price has also formed a potential bearish reversal pattern, the rising wedge. Hallmarks for this pattern include a series of higher highs and higher lows confined in a tightening zone. Historically, for cryptocurrencies, rising wedges have had a tendency to represent continuation and not reversal. A likely eventual pullback target is approximately US$8,500, or 50% from the December low to recent local high.

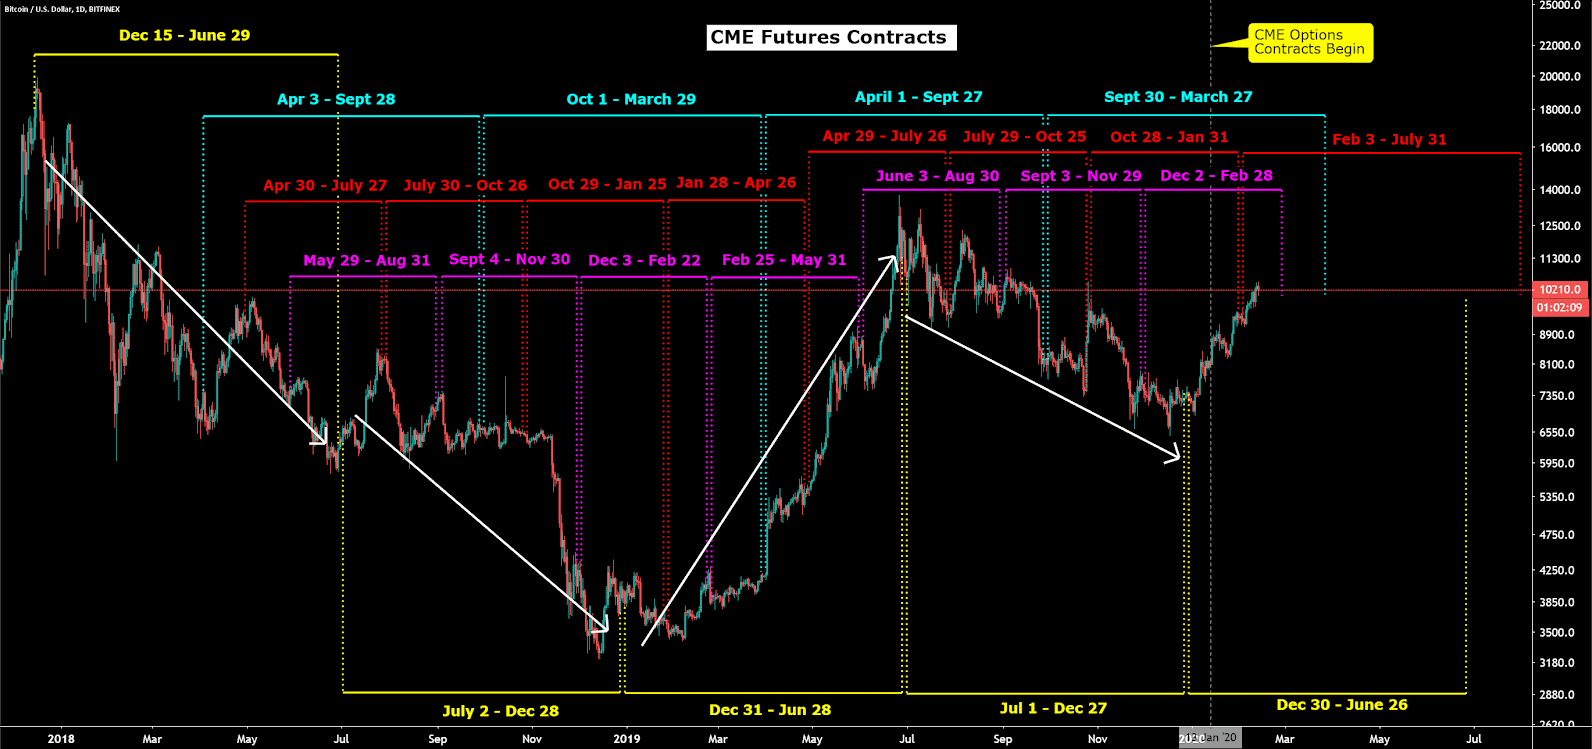
Lastly, the opening and expiration dates of the Chicago Mercantile Exchange (CME) BTC cash-settled futures contracts, launched in December 2017, have had a significant impact on price. The CME facilitates trades for the largest portion of derivatives contracts in the world.
In July 2019, the CME saw the highest notional volume ever in a single day for the BTC futures product, exceeding US$1.5 billion. Historically, price volatility tends to increase dramatically near any active contract expiration, as was again the case leading into January 31st. The July 1st to December 27th contract yielded an excellent short trade for the entirety of the contract, which is similar to the bi-annual contract of the same time period in 2018.
Conclusion
Network mining fundamentals have continued to soar in recent weeks with a new hash rate and difficulty all-time high. If the hash rate continues to increase over the next few months, the block reward halving will occur much sooner than the currently projected May date. Based on the next difficulty adjustment, the hash rate may have plateaued temporarily.
Transactions per day and monthly active addresses have increased significantly since January 1st. However, both NVT and MVRV, which are inversely related to on-chain activity, have also begun increasing over the past few weeks, suggesting weakening on-chain use relative to the Bitcoin market cap.
Technicals suggest a definitive trend shift as the BTC/USD spot price has breached both the 200-day EMA and the daily Cloud. Additionally, a bullish 50-day and 200-day EMA cross has also occurred. In the near term, higher highs are less likely than a pullback to US$8,500, especially with a bearish rising wedge nearing the end of completion.
 Brave New Coin reaches 1M+ engaged crypto enthusiasts a month through our website, podcast, newsletters, and YouTube. Get your brand in front of key decision-makers and early adopters in 2026. Limited slots remaining! Find out more today!


