Bitcoin Price Analysis – Technicals show potential for 21% decline in coming weeks

![]()
Technicals for BTC/USD reveal a bullish trend shift with the current spot price above both the 200-day EMA and the Cloud. US$8,100 is a key support level, along with the Cloud and Kijun at US$7,200. Overhead resistance stands at the yearly pivot of US$13,000. Over the next few weeks, a bearish edge-to-edge trade on the daily Cloud may trigger, with a price target of US$7,200.
The Bitcoin (BTC) market cap is currently US$168.1 billion, with US$2.23 billion traded in the past 24 hours. The current spot price is down 55% from the all-time high established in December 2017, but up over 130% from March 2019 lows.
The BTC network is secured by the SHA-256 consensus algorithm. Both the network hash rate and network difficulty have repeatedly posted new record highs over the past two years (top chart, below). Average block times are currently around ten minutes (bottom chart, below), after a recent +15% difficulty adjustment. The next difficulty adjustment will occur in about 10 days with a projected +7.5% change.
Watch a summary of this analysis on YouTube
Network difficulty adjusts every 2,016 blocks. As hash rate decreases before a difficulty adjustment, block times increase. As hash rate increases before a difficulty adjustment, block times decrease. The difficulty adjustment in five days will target a 10-minute blocktime. Historically, because of continuous increases in hash rate, average network block times have held mostly below the 10-minute target.
Source: BitInfoCharts
Source: BitInfoCharts
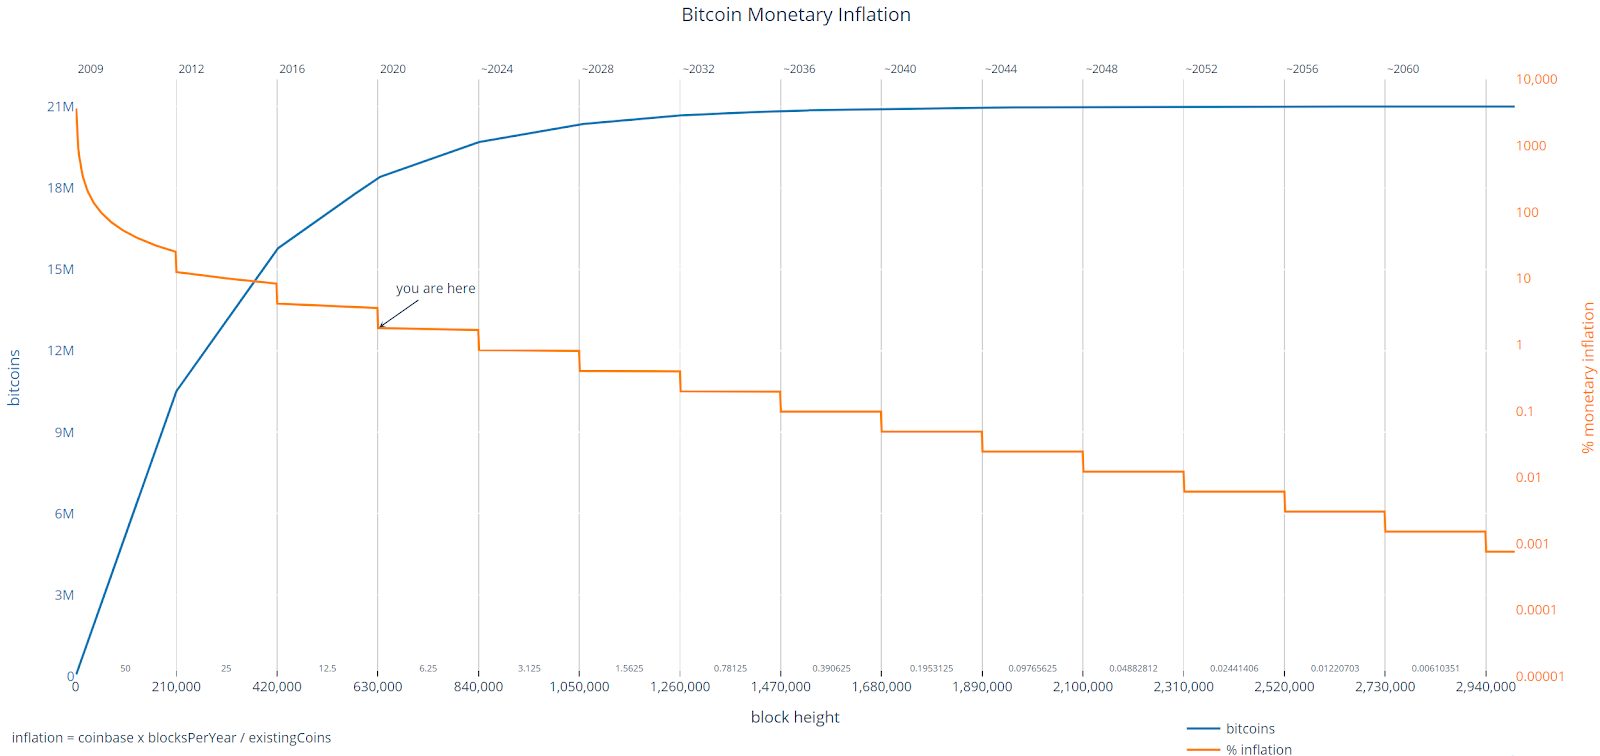
After the third block reward halving in Bitcoin’s history earlier this year, inflation on the network now stands near 1.80%. Inflation is set to decrease in a stepwise fashion over time. The next block reward halving is estimated for June 2024.
Source: @bashco_
Twenty-three new SHA-256 ASICs were released in 2019, with two released by Bitmain in December. Five more ASICs have been released so far this year, which may explain the continued rise in hash rate throughout early 2020. Two more ASICs are also set for release in October. The most profitable miners are currently the Bitmain Antminer S19 Pro, and S19, the MicroBT Whatsminer M30S, and the Bitmain Antminer T19.
Renewable energy sources around the world, including hydroelectric and geothermal power, bring electricity prices for most mining farms to US$0.04 cents/KWh or lower. Currently, 46% of all SHA-256 ASICs are not profitable at this electricity cost. If electricity prices suddenly rise or if BTC prices drop, more and more ASICs become unprofitable and the hash rate will likely begin to decline. Other network factors that influence mining profitability include; price, block times, difficulty, block reward, and transaction fees.

Source: asicminervalue
On the network side, on-chain transactions per day (line, chart below) took a steep dive in late March, but have begun increasing again. Average transaction values in USD (fill, chart below) have ranged from US$5,000 to US$10,000 over the past year. The current record for transactions in a single day was set in December 2017, at 500,000. The current record for average transaction values in USD was set in January 2016, at US$51,000.
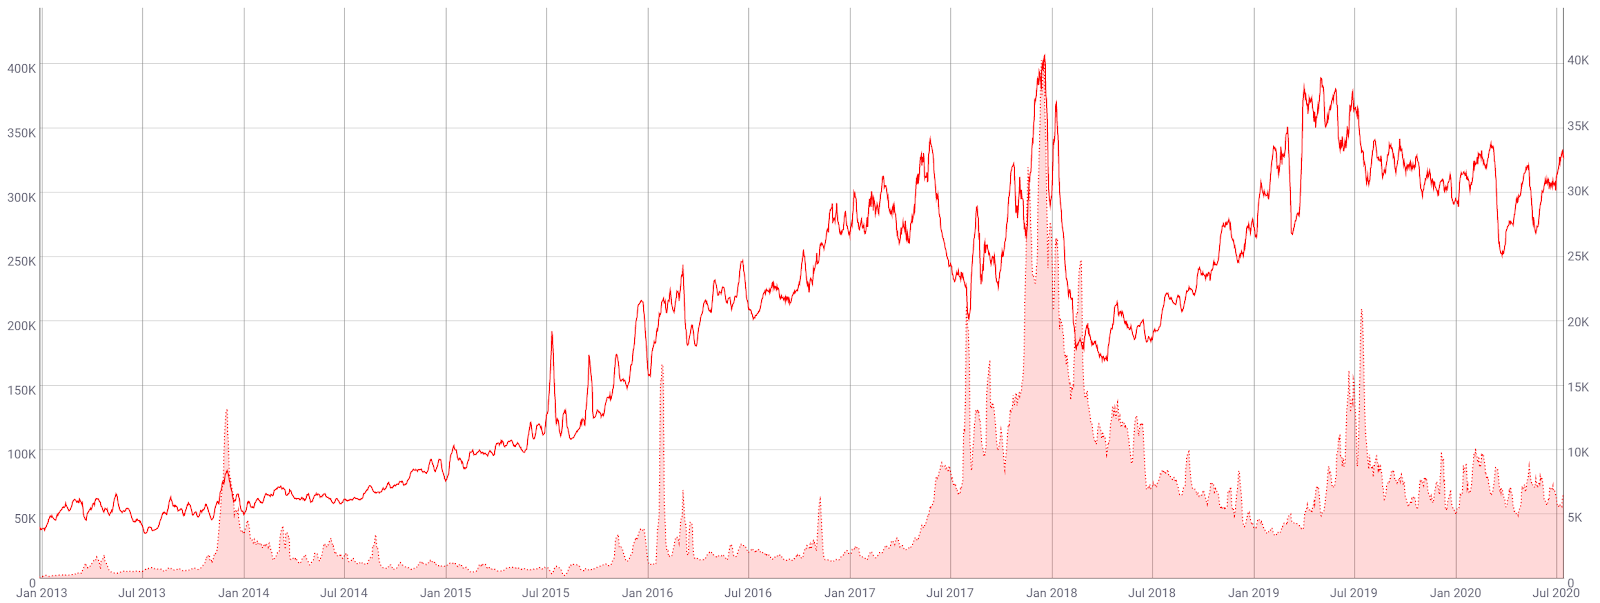
Source: CoinMetrics
Unconfirmed transactions have mostly held below 20,000 since August 2019, during peak congestion, and have dropped below 5,000 during off-peak times (chart below). Over the past few months, with increased price volatility, unconfirmed transactions have increased to nearly 90,000 during peak times. A decline in hash rate earlier this year led to an increase in block times, which also contributed to network congestion.
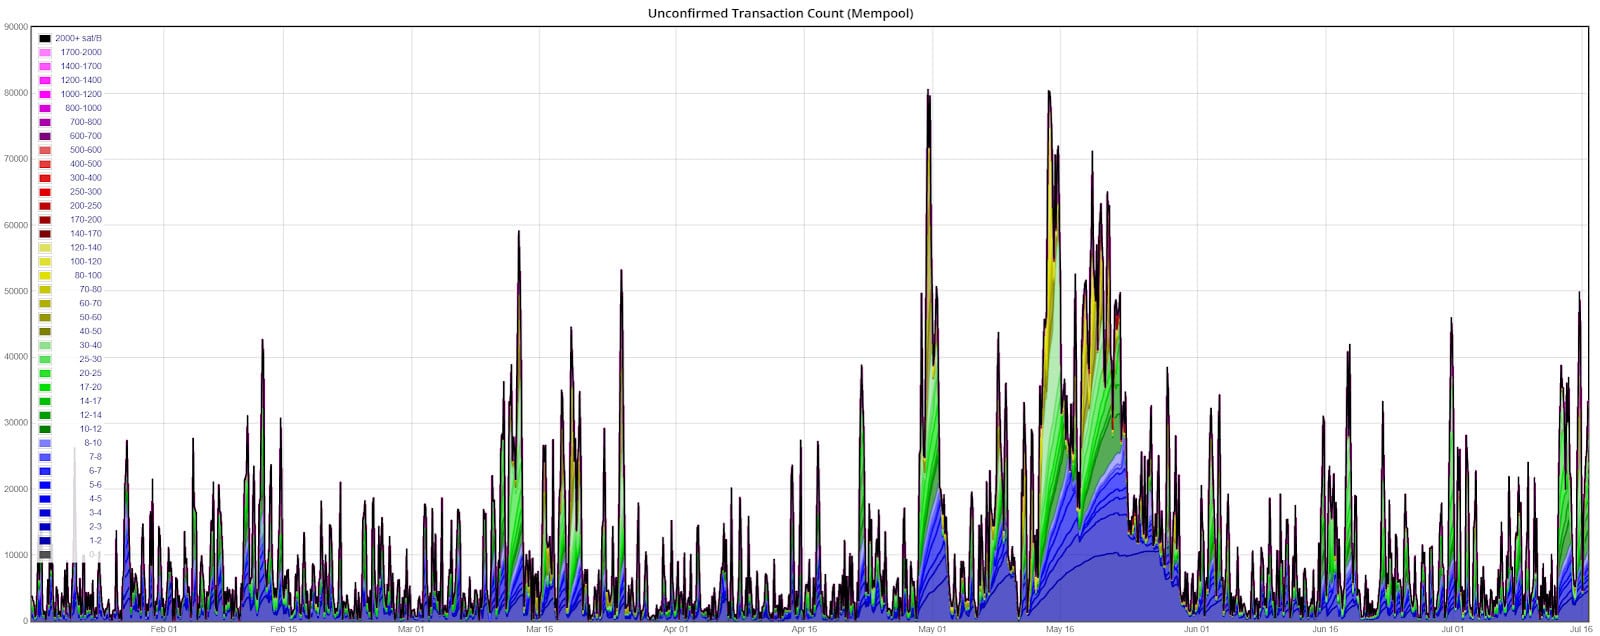
Source: https://jochen-hoenicke.de/queue/#0,6m
The average block size per day (top chart, below) has consistently held above 1.2 MB since late last year, with blocks on March 24th and June 11th holding near 1.4 MB. The block size limit is currently 2-4 MB, depending on the types of transactions being sent, thanks to SegWit activation on August 23rd, 2017 via a user-activated soft fork.
The average transaction fee (line, chart below) is currently US$1.32, despite a growing block size and increased on-chain use since the record high fee of US$62 in late December 2017. Both the lack of zero-fee unconfirmed transactions and increased chain scalability have kept fees substantially lower than late in 2017.
Additionally, transaction batching and the increasing off-chain capabilities of the Lightning Network have decreased on-chain transaction bloat. Transaction batching is most effective for entities with a high amount of on-chain transaction outputs, such as miners and exchanges.
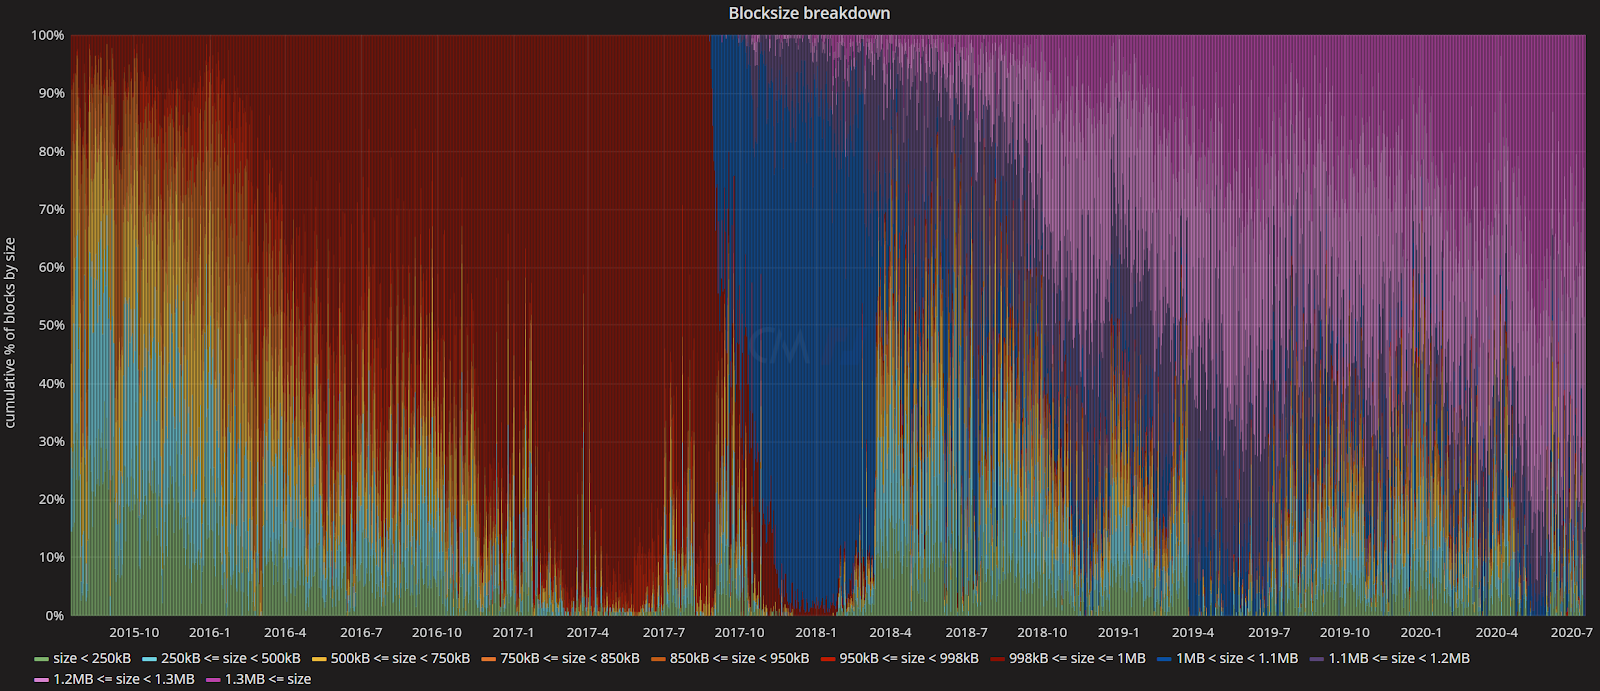
Source: txstats
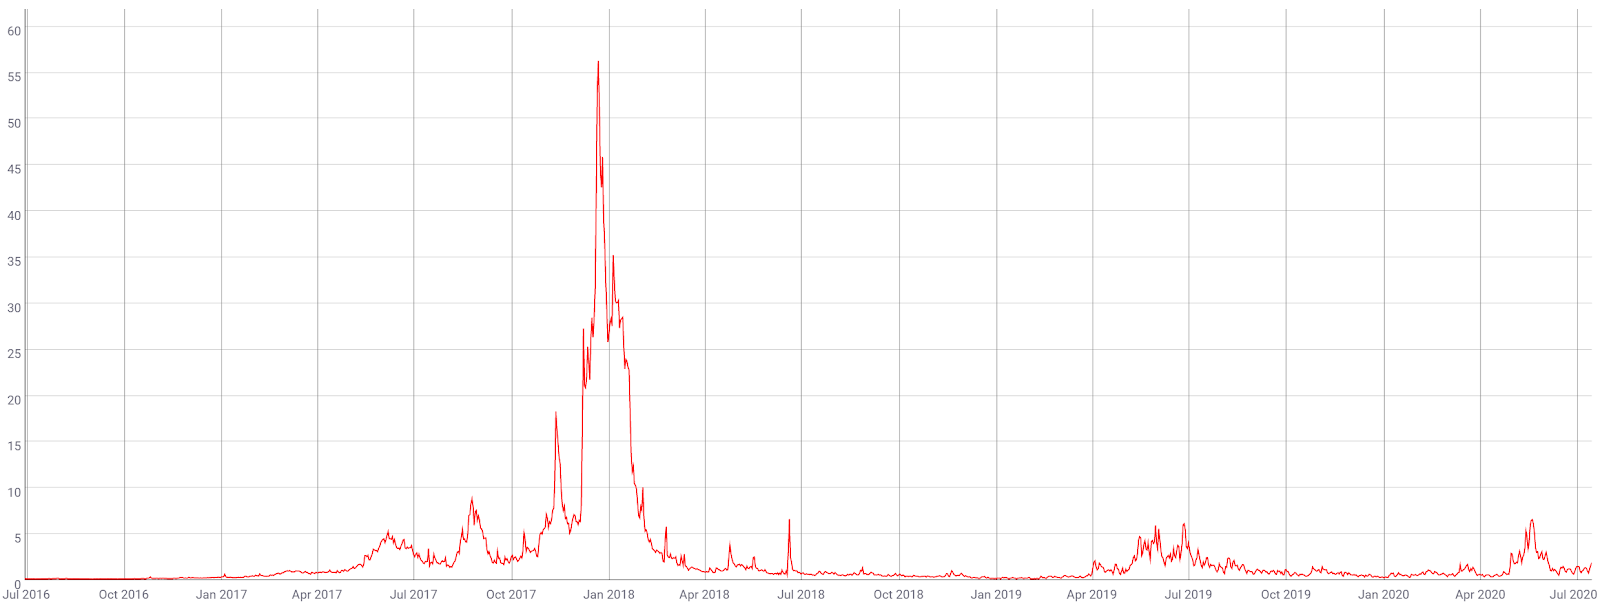
Source: CoinMetrics
The 30-day Kalichkin network value to on-chain transactions ratio (NVT) has ranged from 50 to 100 since January 2019 (line, chart below). While Kalichkin’s NVT does not account for inflation or the use of off-chain transactions, which would decrease the overall NVT ratio, the metric remains in the upper half of the historic range.
Previous highs in NVT; in February 2011, October 2014, December 2017, October 2018, July 2019, and February 2020, were all followed by bearish price moves. Based on this metric, the probability for a local top in price will increase if another local NVT high is reached. In December 2018, NVT declined to 46 before a price reversal.
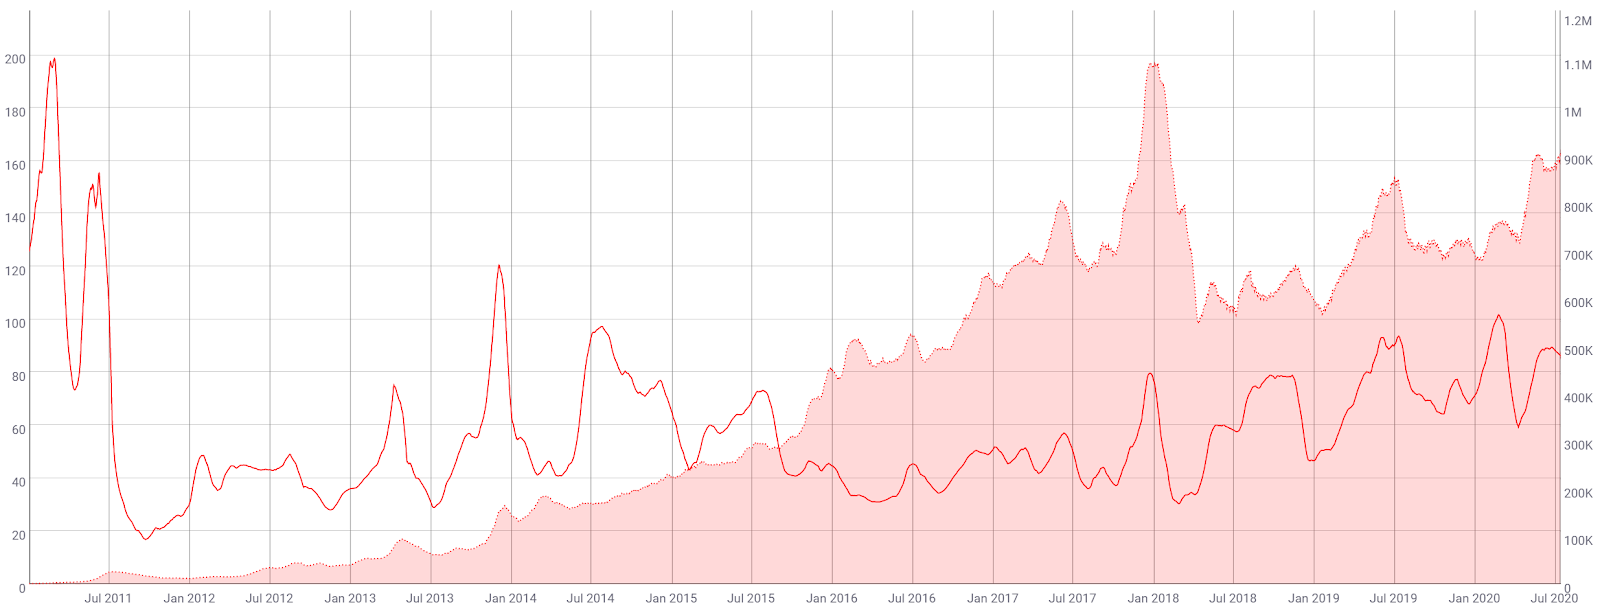
Monthly active addresses (MAAs) have increased to 905,000 over the past month, marking a two-year high (fill, chart below). MAAs grew to 850,000 in July 2019, from a 2019 yearly low of 550,000. MAAs hit an all-time high of 1.096 million in December 2017.
Daily active addresses (DAAs) surpassed one million three times in 2019, on June 14th, 26th, and 28th. June 2019 was the first-month that DAAs exceeded one million since February 2018. DAAs nearly exceeded 940,000 on April 7th and hit 1.02 million on May 7th, 2019. This year, DAAs also broke one million on May 7th, June 11th, June 23rd, July 1st and July 9th. On December 14th, 2017, DAAs exceeded 1.28 million.
The Bitcoin network has far more active addresses than any other blockchain. A large uptick or sustained increase in DAAs can be seen as a bullish indicator for market prices as it suggests an increase in on-chain BTC demand. As off-chain transaction facilities increase, daily active addresses may stagnate or decline over time.
Source: CoinMetrics
The market cap divided by the realized cap (MVRV) is another crypto-native fundamental metric used to assess overbought or oversold conditions. Realized cap approximates the value paid for all coins in existence by summing the market value of coins at the time they last moved on the blockchain.
Historically, periods of an MVRV Z-score less than zero have represented oversold conditions, whereas periods of an MVRV Z-score greater than seven have represented overbought conditions. Since 2013, all three MVRV Z-score spikes above seven have coincided with record highs in price. MVRV is currently 0.95, after spiking to -0.20 on March 12th. All previous periods with an MVRV Z-score below zero consolidated for several months before moving into positive territory.
Source: lookintobitcoin
Analyzing the age of unspent transaction outputs (UTXOs), or unspent coins, can also provide some insights into price movements. Spikes in newly moved coins tend to correlate with local tops or bottoms in market values, and can represent euphoria or capitulation. Coins that have not moved recently are represented in cooler colors, whereas coins on the move are represented by warmer colors.
Coins that have not moved in more than five years (dark blue) account for 21.65% of the circulating supply, or around 4.07 million BTC. The two to three year age band (turquoise), or coins not moved since July 2017 – July 2018, holds the next highest distribution at 15.00%. The one to the three-month band (orange) gained 5% from April 2019 to June 2019, but has fallen in recent months. Historically, local tops in price have occurred when the one to three-month band, currently 8.96%, has represented more than 15% of all circulating UTXOs.

Source: https://plot.ly/~unchained/37.embed
Turning to developer activity, Bitcoin Core v0.19.1 and v0.20.0 were both released this year and provided various bug fixes and performance improvements. Future potential protocol improvements in the pipeline include Schnorr signatures, Taproot, and Graftroot.
Schnorr signatures and signature aggregation also bring the potential for storage and bandwidth reduction by at least 25%. Taproot and Graftroot improve upon Merkelized Abstract Syntax Trees (MAST) which offers three benefits; smaller transactions, more privacy, and larger smart contracts.
In September 2019, Pieter Wuille of Blockstream also unveiled plans for miniscript, a simplified way to write Bitcoin code. The current version, Script, is complex and difficult to use for those not intensely familiar with the language.
According to Wuille, miniscript allows a user to write some Bitcoin scripts, “in a structured, composable way that allows various kinds of static analysis, generic signing, and compilation of policies.” Miniscript is in the early stages of development and is currently being tested internally at Blockstream.
More than 50 developers have contributed over 2,100 commits in the past year, mostly on the main Github repo. Most coins use the developer community of GitHub where files are saved in folders called "repositories," or "repos," and changes to these files are recorded with "commits," which save a record of what changes were made, when, and by who. Although commits represent quantity and not necessarily quality, a higher number of commits can signify higher developer activity and interest.
The BTC project on Github has two active repos, “bitcoin” (top chart, shown below) and Bitcoin Improvement Protocols, “BIPs” (bottom chart, shown below).

Source: Github – bitcoin

Source: Github – bitcoin/bips
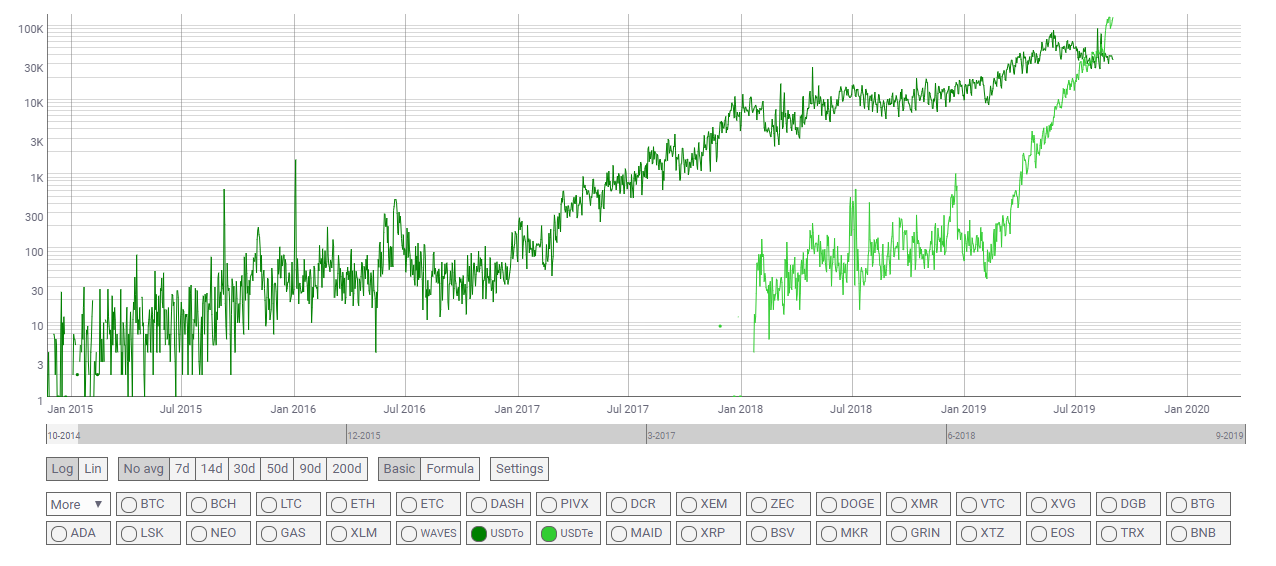
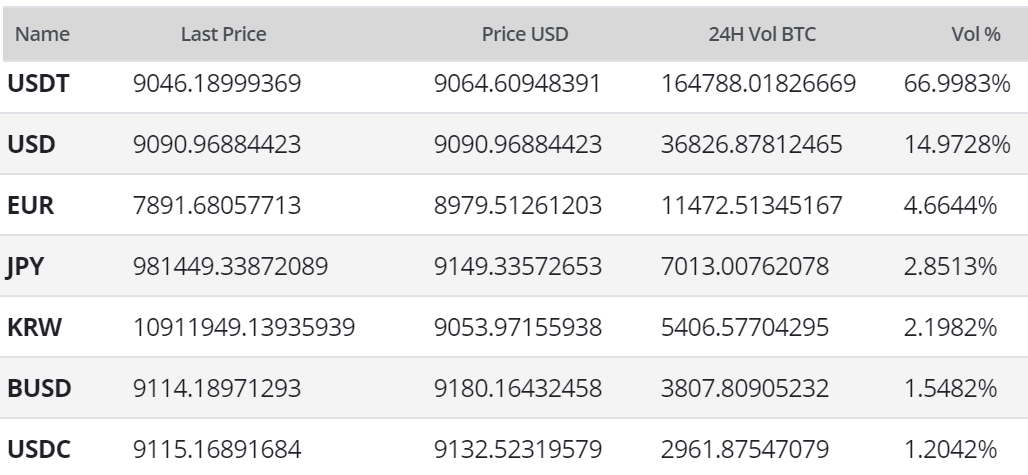
BTC exchange-traded volume over the past 24 hours has been dominated by Tether (USDT) trading, with the United States Dollar (USD) markets representing 15% of the total volume. Tether is a stable coin with a soft peg to the USD. Stablecoins in general currently represent over 75% of all reported volume over the past 24 hours.
In lieu of an ETF in the U.S., the Chicago Mercantile Exchange (CME) launched cash-settled BTC futures in Q4 2017. The institutional product has seen large volumes and open interest over the past year with an all-time high in open interest on May 19th. Bakkt physically-settled and cash-settled BTC futures exchange launched in September 2019 which saw increasing volumes throughout 2019, and increasing volumes and open interest since April. Bakkt and the CME have also launched a BTC options product.


Global over the counter (OTC) volume, from LocalBitcoins.com, declined from late 2017 to mid-2019, and then declined again from mid-2019 to early 2020. Global notional volume has held near or above US$50 million since the beginning of the year. In May 2019, LocalBitcoins discontinued servicing Iran, likely as a result of U.S sanctions, and in June 2019, the option to pay for BTC in person with cash was disabled.
Latin America (brown) holds the highest percentage of total notional volume, followed by Eastern Europe (orange). The Middle East (yellow) and the Australia/New Zealand regions (grey) hold the lowest notional volume, both posted less than US$1,000,000 in trade volume over the past week. Notional volumes for Venezuela and Colombia stand at US$4.5 million and US$2.6 million, respectively. Venezuela’s central bank has also floated plans to hold BTC within its reserve system.

Source: UsefulTulips
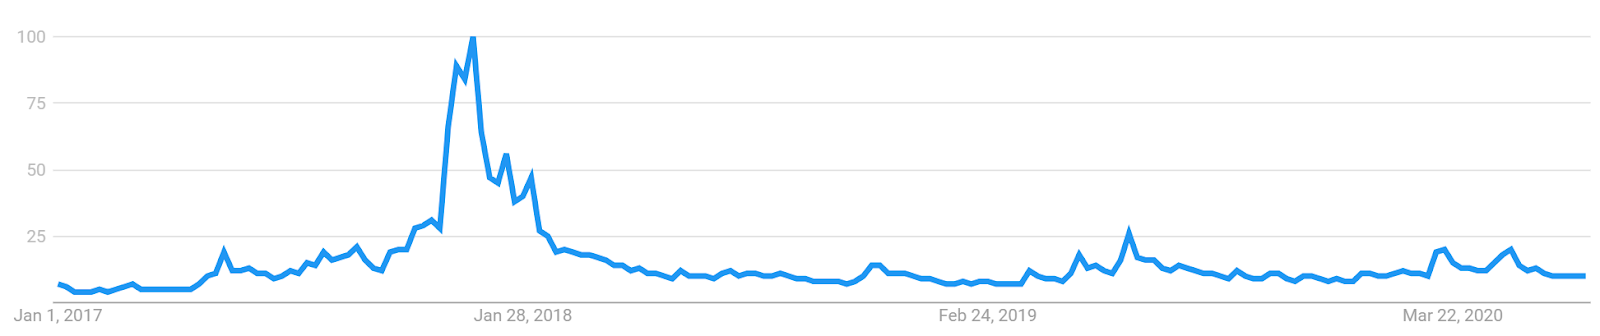
Worldwide Google Trends data for the term "bitcoin" increased dramatically from March to June 2019, marking a new yearly high. Since June, search interest has dropped but has begun to increase slightly again in recent weeks, likely related to the block reward halving event.
The previous increase in search traffic has likely been related to both the sharp increase in price in Q2 as well as mentions from several prominent U.S government officials, including the President of the United States. Throughout the course of 2018, “bitcoin” related searches declined dramatically. Despite the declining interest, the search “what is bitcoin” was the most popular “what is” Google search of 2018.
A slow rise in searches for "bitcoin" preceded the bull run in Q4 2017, likely signaling a large swath of new market participants at that time. However, a 2015 study found a strong correlation between google trends data and BTC price whereas a 2017 study concluded that when U.S. Google "bitcoin" searches increased dramatically, BTC price dropped.

Technical Analysis
As a bullish recovery continues to manifest after the significant March 12th drop, roadmaps for future market movements can be found on high timeframes using Exponential Moving Averages, Volume Profile Visible Range, Yearly Pivots, divergences, and Ichimoku Cloud. Further background information on the technical analysis discussed below can be found here.
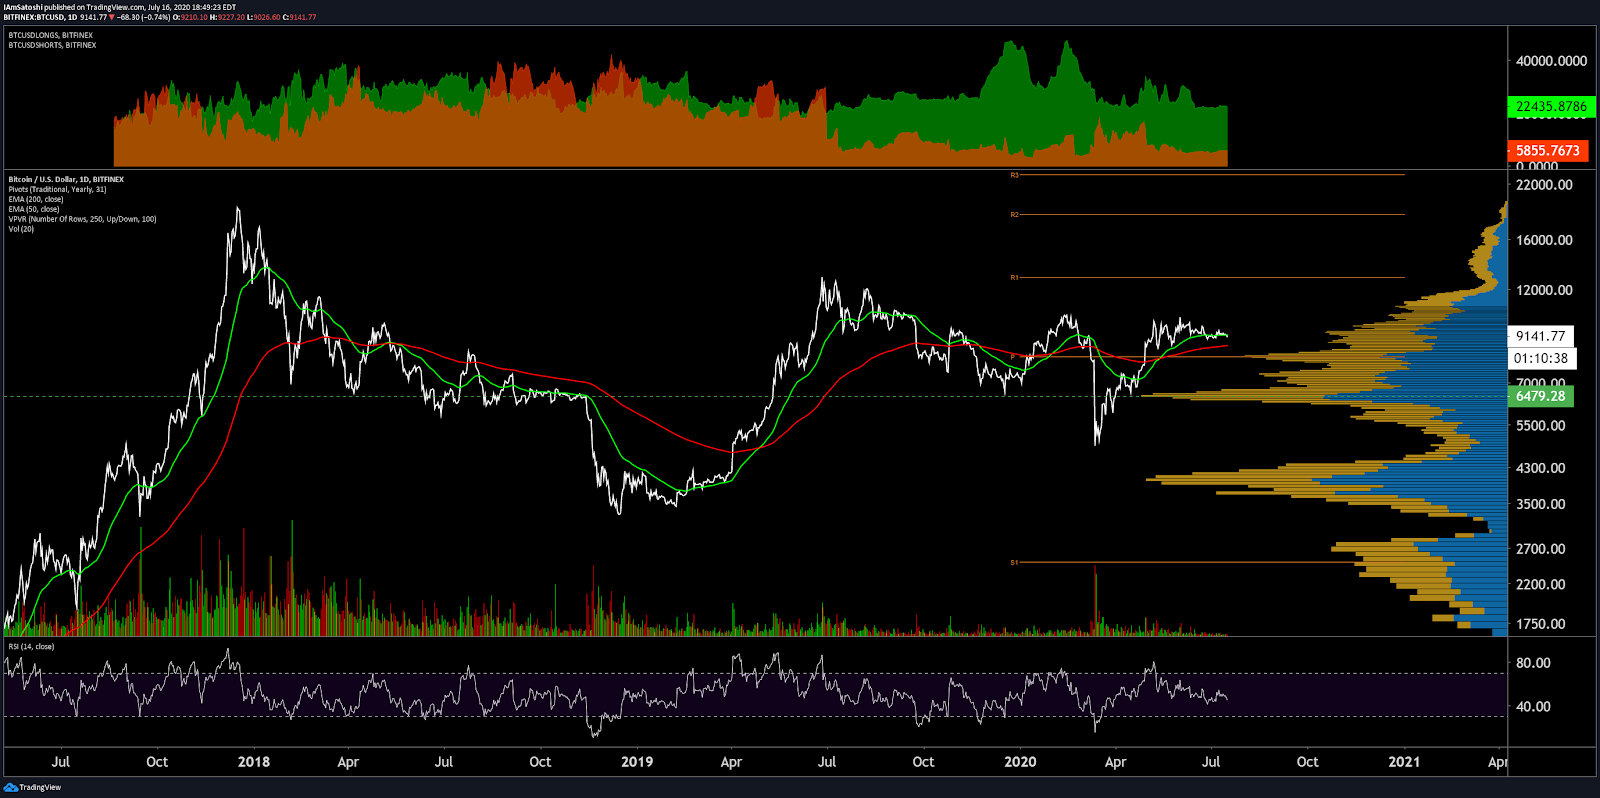
On the daily chart for the BTC/USD market, the spot price relative to the 50-day Exponential Moving Average (EMA) and 200-day EMA can be used as a litmus test for the trend. In late January, the 50-day EMA crossed above the 200-day EMA, known as a Golden Cross, and was quickly followed by a bearish Death Cross on March 14th. The 50-day and 200-day EMAs are now sitting below the spot price at US$9,100 and US$8,700, respectively, after completing a Golden Cross on May 13th.
The volume Profile of the Visible Range (VPVR) shows a large volume support node at US$8,200 (horizontal bars, chart below) with relatively little volume resistance above that zone. Additionally, yearly Pivot Points, at US$8,100, US$13,000, and US$18,600, should all act as resistance.
The Bitfinex long/short ratio (top panel, chart below) is currently 79% long, with longs decreasing 32% since June 3rd. There is a high likelihood for a price bottom if shorts overtake longs in the coming weeks. Historically, most periods with significant short interest have only fueled higher prices. There are no active volume or RSI divergences currently, but RSI did hit a new yearly low on March 12th, suggestive of significantly oversold conditions.
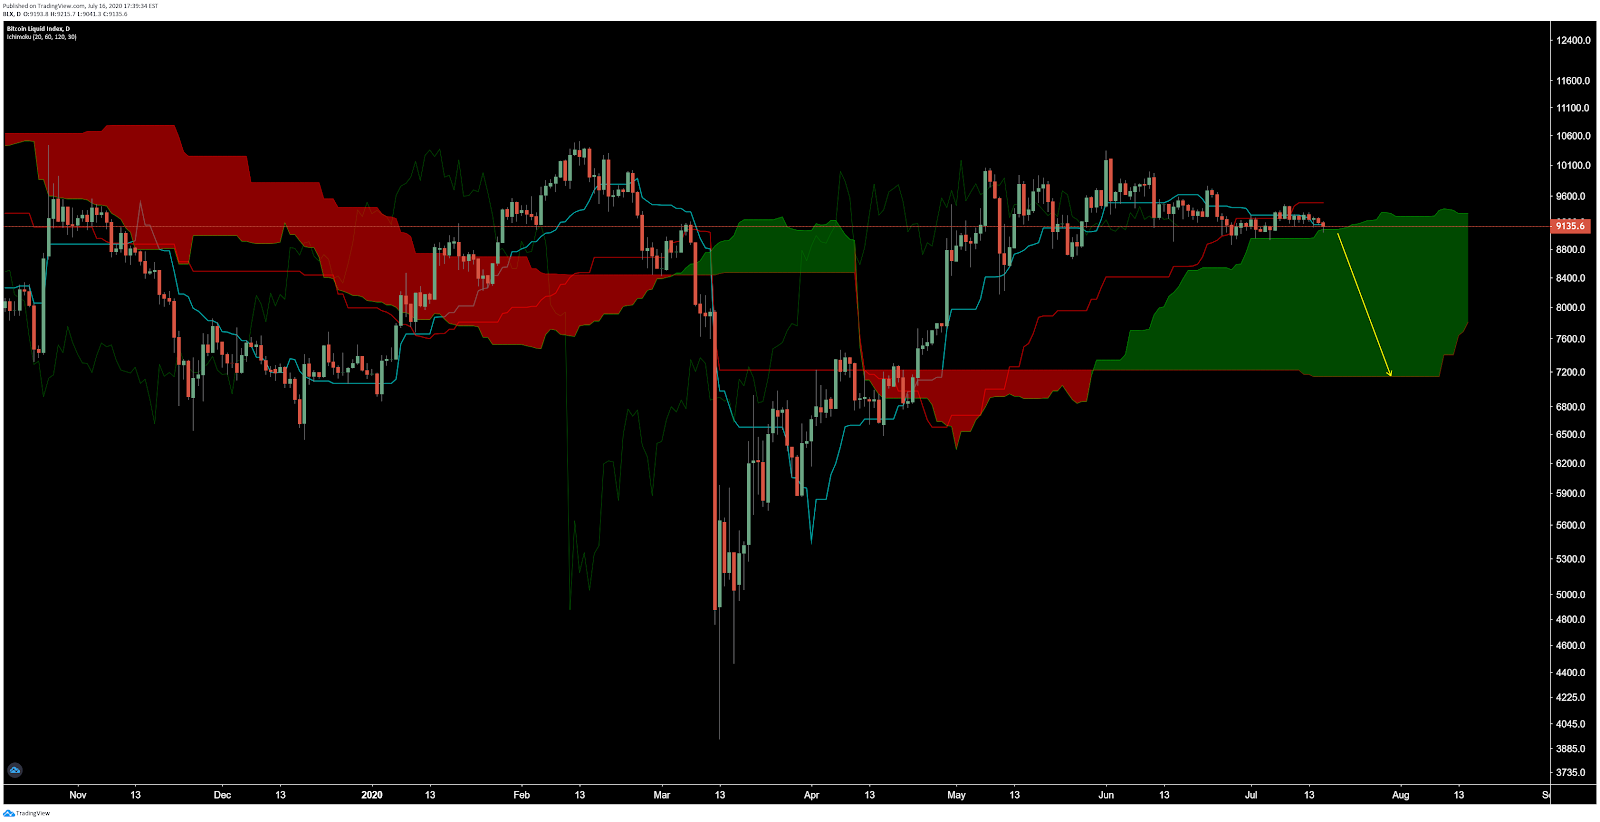
Turning to the Ichimoku Cloud, there are four key metrics; the current price in relation to the Cloud, the color of the Cloud (red for bearish, green for bullish), the Tenkan (T) and Kijun (K) cross, and the Lagging Span. The best entry always occurs when most of the signals flip from bearish to bullish, or vice versa.
On the daily chart, Cloud metrics are bullish to neutral; the spot price is above the Cloud, the Cloud is bullish, the TK cross is bearish, and the Lagging Span is above the Cloud and below price. The trend will remain bullish so long as the spot price remains below the Cloud.
Over the next few weeks, a bearish edge-to-edge trade may trigger if price drops into the Cloud below US$8,950. The short trade will likely reach for the other edge of the Cloud at US$7,200. This price movement would satisfy the possibility of a macro inverted head and shoulders pattern that has developed since October 2019.

Correlations with volatility in legacy financial markets have also had a significant impact on Bitcoin price. Since October 2014, spikes in the Chicago Board Options Exchange’s CBOE Volatility Index (VIX) have represented local lows in BTC price. Over the past month, the VIX, or the ‘fear index’, has fallen below 30, from a high of 86, the highest level since the 2008 financial crisis when the metric peaked at 90 (middle panel, chart below). The U.S. S&P 500 and Nasdaq indices have had a 20% and 0% rolling 30-day correlation with BTC over the past week, respectively (bottom panels, chart below). These correlations are down significantly from January and March when both neared a 100% correlation with BTC price.

Lastly, the opening and expiration dates of the Chicago Mercantile Exchange (CME) BTC cash-settled futures contracts, launched in December 2017, have had a significant impact on price. The CME facilitates trades for the largest portion of derivatives contracts in the world.
In July 2019, the CME saw the highest notional volume ever in a single day for the BTC futures product, exceeding US$1.5 billion. Historically, price volatility tends to increase dramatically near any active contract expiration. The July 1st to December 27th contract yielded an excellent short trade for the entirety of the contract, which is similar to the bi-annual contract of the same time period in 2018. The bi-annual contract that expired on June 26th saw a 23% increase from open to close despite the March 12th drop. July 31st is the next contract rollover period, suggesting volatility should increase in the week preceding the rollover.


Conclusion
Network hash rate and difficulty have been just as volatile as price over the past few months but both are once again near all-time highs. The third block reward halving occurred earlier this year, which will very likely continue to squeeze out only the most efficient miners. Thus far, five new ASICs have been released this year, which may help keep the hash rate elevated for many months to come.
Transactions per day dropped dramatically in mid-March but have since returned to previous levels. Monthly active addresses have hit new multi-year highs with daily active addresses surpassing one million earlier several times this year. NVT and MVRV, which are both inversely related to on-chain activity, suggest decreasing or stagnant on-chain utility relative to market cap in the past few weeks.
Technicals for BTC/USD reveal a bullish trend shift with the current spot price above both the 200-day EMA and the Cloud. Based on yearly pivots and volume, US$8,100 is a key support level, along with the Cloud and Kijun at US$7,200. Overhead resistance stands at the previous local highs and yearly pivot of US$13,000. Over the next few weeks, a bearish edge-to-edge trade on the daily Cloud may trigger, with a price target of US$7,200. This price action would also help complete a macro inverted head and shoulders pattern which has been building since October 2019.
Historically, legacy markets will also need to stabilize in order for buyers to return to the crypto market. In the months to come, Bitcoin may reach new highs swiftly as quantitative easing and global central bank money printing surge to unparalleled levels.
 Brave New Coin reaches 1M+ engaged crypto enthusiasts a month through our website, podcast, newsletters, and YouTube. Get your brand in front of key decision-makers and early adopters in 2026. Limited slots remaining! Find out more today!


