It’s Not Over Yet – 4 Bearish Bitcoin Price Signals

![]()
As the chaos continues in crypto markets, careful evaluation of technical indicators can provide actionable insights for traders who want to filter the noise. Here we profile four important indicators and the story they’re telling about the near term BTC price.
The Bitcoin and digital asset markets are in a deep bear market. It has been an extremely difficult year for digital assets with major industry players such as Terra, FTX, and 3AC falling by the wayside due to unstable and unsustainable risk models. Additionally, a bleak global macro situation has led investors to shift away from risk assets.
Year to date the price of Bitcoin has dropped by ~65%. Since it touched an all-time high in early November 2021, its price has dropped by ~75%. The latest body blow Bitcoin has suffered in its bearish multi-month drop was the collapse of major centralized exchange FTX and its connected ecosystem of trading firms, lenders, and venture capitalists. Since November 7th, around the date it became clear that FTX would not be able to turn things around, the price of BTC has fallen by ~24%.
In an interview with Brave New Coin, Stefan Rust, the CEO of Laguna Labs said while we are sitting at two-year lows today, “there is undoubtedly more pain to come for Bitcoin in what will likely be a final capitulation towards the bottom.”
There are a number of serious malpractice allegations being levied at FTX. This includes that it used customer and corporate funds to prop up Alameda Research, a crypto trading, and investment firm with murky ties to FTX CEO Sam Bankman-Fried.
FTX, along with 130 affiliated companies, has filed for Chapter 11 bankruptcy in the United States. Numerous other significant corporate players have also filed for bankruptcy – the latest being BlockFi, which filed for Chapter 11 bankruptcy protection today. Lawyers have stated that it may take many years for the FTX’s reported 5 million users to get their money, trusted to a seemingly regulated, ‘good guy’ custodian, back. The same will be true of the other major bankruptcies, with three to five years being a likely timeframe based on typical large scope Chapter 11 reorgnaizations in the United States.
The FTX collapse and the reputational damage it has created for the crypto ecosystem is a serious headwind that will likely cause the price of BTC to continue to be depressed. This backs up Rust’s argument that more pain is yet to come.
In addition to the macro crypto news, traders also look to technical indicators – as It’s not just news but price and volume patterns that determine market psychology and mood. Alongside the bearish fundamental clouds, a number of technical indicators also point to this period of price depression continuing. In this article we will examine four of them.
1. Death Cross
The death cross is a chart pattern that often indicates the transition from a bull market to a bear market. This pattern emerges when the short-term moving average price of an asset crosses its long-term moving average from above to below. A death cross is a signal that indicates the beginning of a long-term bear market. Both the death cross and its bullish equivalent, the golden cross, are a solid confirmation of a long-term trend by the occurrence of a short-term moving average crossing into long-term trend territory.
There are two death crosses with different timeframes for Bitcoin that are noteable. The 7-day moving average crossing from above to below the 30-day cross and the 50-day moving average crossing from above to below the 200-day.
The first death cross is an indication of a recent transition to a shorter-term period of bearishness that may not be a multi-month. It more likely suggests a temporary continuation of recent bearish price action, in this case, a continuation of the bearishness generated by the FTX price capitulation event.
In the case of the longer-term death cross, the 50-day moving average line (red) going above to below the 200-day price (green), the length of the bearish trend appears set to be longer. This death cross was confirmed early in 2022 and the price of BTC has been stuck below the cross pattern since. This implies that Bitcoin is still in the midst of a long-term bear market and we may need to see the short-term average line cross above the long-term one to be confident that a bull trend is starting.
2. Bearish engulfing
The Bearish engulfing is a technical chart pattern that generally signals lower prices to come. This pattern consists of an ‘up’ or green candlestick, visualizing a positive price movement, that is followed by a larger ‘down’ red candle, visualizing a negative price movement.
The larger candle engulfs and absorbs the smaller candle which implies that sellers have overtaken buyers and are pushing the price downwards more aggressively than the previous cycle of buyers pushing it up.
The bodies of the candles or the difference between the open and the close price are key to confirming an engulfing. The body of the red candle has to truly engulf the green candles. Additionally, the pattern has less significance in choppy or sideways markets.
In this situation, when assessing candle patterns we take a longer-term view, looking at monthly candles, and judge whether there is vigorous and sustained selling pressure.
We see a pretty textbook bearish engulfing candle pattern forming on the last two monthly Bitcoin price candles. A small green candle in October 2022 is engulfed by a big bearish red candle in November 2022. This suggests presently in the shorter to medium term, that bulls are stronger than bears.
3. Bearish Pennant
Bearish pennants are a continuation pattern that represents a pause in a longer-term downtrend, offering an opportunity for traders to go short. They occur after sharp price drops and resemble a triangular flag within which the price of an asset moves sideways, making lower highs and higher lows before another collapse.

As shown above, there have been two major bearish pennants that have formed for the Bitcoin price in 2022, characterized by the lower tightening sideways movement of lower highs and higher lows. The first bearish pennant formed between January and May 2022, with a second one forming immediately after.
The price of BTC did not break down as the flag tightened, it actually rose. This uptrend following the pennant did not last very long. The price of BTC did eventually fall and the longer-term downtrend the asset has been going through continued.
As the two Bearish pennants have formed one after another, the price of BTC may be breaking down into another period of sideways price movement and another flag-like bearish pennant.
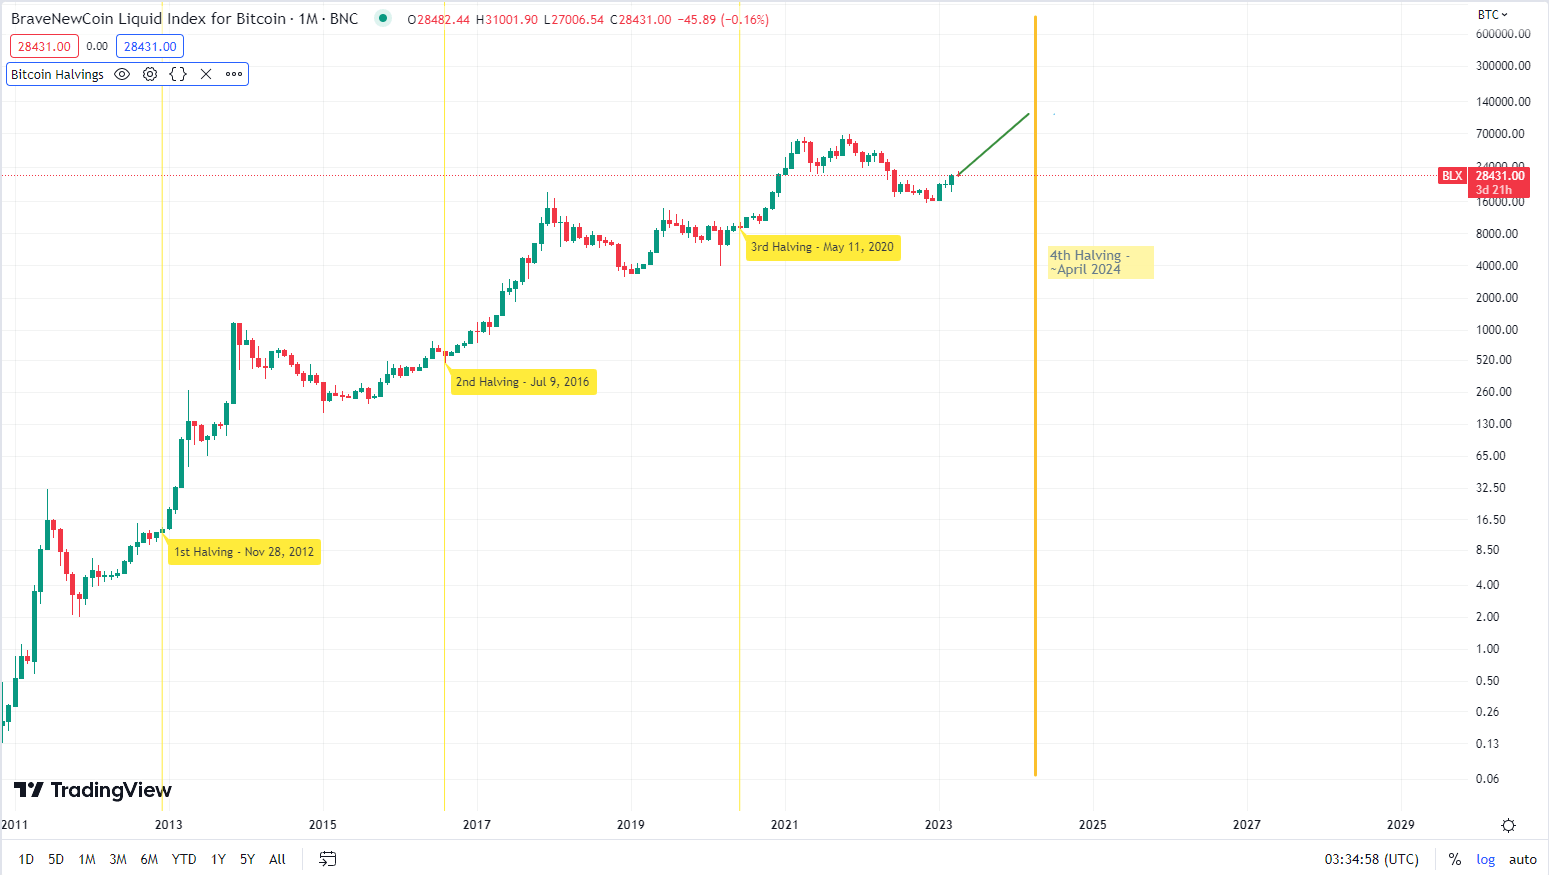
4. The 4-year Simple Moving Average
The Simple moving average is a widely used indicator that helps to smooth out price action by filtering out noise from short-term price fluctuations.

N is the period of days that we want to smooth out. In this case, we are going to look at four years. We select this period of time because it is the length of time between each Bitcoin halving.
Bitcoin was built with a pre-planned deflationary monetary policy. Every 210,000 blocks a halving occurs – approximately every four years. The halving cuts the miner’s Bitcoin reward in half, reducing the rate at which new BTC supply is issued.
Bitcoin’s position as a verifiable scarce asset, with some demand, means that as it becomes more difficult to acquire with each new halving, and its intrinsic value increases. This deflationary mechanism has significant implications for BTC’s stock-to-flow model, given the ‘flow’ or production rate of the asset halves every 4 years.
Bitcoin’s long-term price cycles have often been closely tied to this 4-year pattern. The years of, before, and after a halving have been the most bullish for the asset— 2019-2021, 2015-2017, and 2011-2013. The years in between these periods are generally the most bearish— 2022, 2018, and 2014.
| Halving Year | Block Height | Block Reward | Date |
| 2024 | 840,000 | 3.125 | June 20, 2024
01:38:44 PM UTC |
| 2020 | 630,000 | 6.25 | May 11, 2020
7:23:43 PM UTC |
| 2016 | 420,000 | 12.5 | July 9, 2016
4:46:13 PM UTC |
| 2012 | 210,000 | 25 | November 28, 2012
03:24:38 PM UTC |
| 2009 | 1 (Genesis Block) | 50 | January 9, 2009
2:54:25 AM UTC |
The next halving is set to occur on June 20th 2024, Perhaps April-July 2023 may be the time to aggressively re-enter Bitcoin markets?
Bitcoin’s monthly and yearly gains – bitcoinmonthlyreturns.com
Historically the 4-year moving average line for Bitcoin has been a strong floor and bounce-off point for the price. During this most recent bear trend, however, the price has clearly broken below the 1458-day simple moving average line and stayed below it for some time.
This may signal a temporary or permanent shift away from the Bitcoin halving cycle patterns. 2022 has the unfortunate position of being an ‘inbetween’ halving year. 2023 being a strong year for BTC gains would fit in with the historical patterns and the idea that hype surrounding an upcoming halving can drive bullish bitcoin price action.
 Brave New Coin reaches 1M+ engaged crypto enthusiasts a month through our website, podcast, newsletters, and YouTube. Get your brand in front of key decision-makers and early adopters in 2026. Limited slots remaining! Find out more today!


