MANA Price Analysis – VR platform boosted by HTC deal
MANA, the native token of decentralized VR world Decentraland, has enjoyed strong price gains following news that the HTC Exodus 1 blockchain phone would be released with built-in support for the token. Though more speculative momentum may come with an upcoming Coinbase listing, true fundamental value remains elusive.
Decentraland (MANA) is an Ethereum (ETH) ERC-20 token which enables the purchase of ERC-721 non-fungible tokens (NFTs) that are representative of digital land plots (LAND). MANA can also be used to make in-world purchases of digital goods and services. The MANA token is ranked 80th on the BraveNewCoin market cap table and is down 84% from ATH established in January 2018. The market cap currently stands at US$43.9 million with 15% of the total market cap traded in the past 24 hours, or US$6.63 million.
Citing the need to create a decentralized world for virtual reality (VR), a team founded by Esteban Ordano began working on the blockchain-based virtual land concept in 2015. The team also includes project leads Ari Meilich and Tony Sheng as well as experience architect Christopher Chapman.
The three layers of the MANA protocol include; a consensus layer, which tracks ownership and land contracts through an ETH smart contract, a land content layer, where a decentralized distribution system renders the contract in the virtual world, and a real time layer that provides peer-to-peer connections for users to interact with each other.
Participants who own LAND can then create, experience, and monetize content and applications. LAND is permanently owned by the community, giving owners full control over their creations. Landowners control what content is published to their portion of land, which is identified by a set of cartesian coordinates (x,y). Contents can range from static 3D scenes to interactive systems, such as games.
Potential buyers of LAND can find property for sale on market.decentraland.org and connect an ETH wallet, like Metamask, containing MANA tokens. Available LAND parcels for sale can be found with a price and time duration left in the sale and purchase directly or bid through a Dutch Auction process. MANA tokens are burned when users purchase LAND tokens.
Each parcel of LAND is 10M x 10M or 33 ft x 33 ft in size. The in world map (below) is separated by districts and connected with a series of non-purchasable roads (black lines). Plazas (white squares) are also not for sale. Thus far, plot 22,2 was the most expensive block of LAND sold at ~US$175,000 or 2,000,000 MANA in March 2018.
The Decentraland ICO occurred on August 18th, 2017 and was sold out within 35 seconds.
The crowd sale raised US$24 million, or 86,206 ETH at that time. In total, 2.805 billion MANA tokens were created with 1.05 billion MANA tokens circulating currently. Decentraland retained 60% of the token supply for team members, advisors, and various adoption initiatives. Founders tokens will remain vested for three years. Additionally, subject to MANA holder voting, 8% of the first year’s total token supply will be added to the circulating supply every year. Ideally, this will replenish the MANA tokens burned when purchasing LAND.
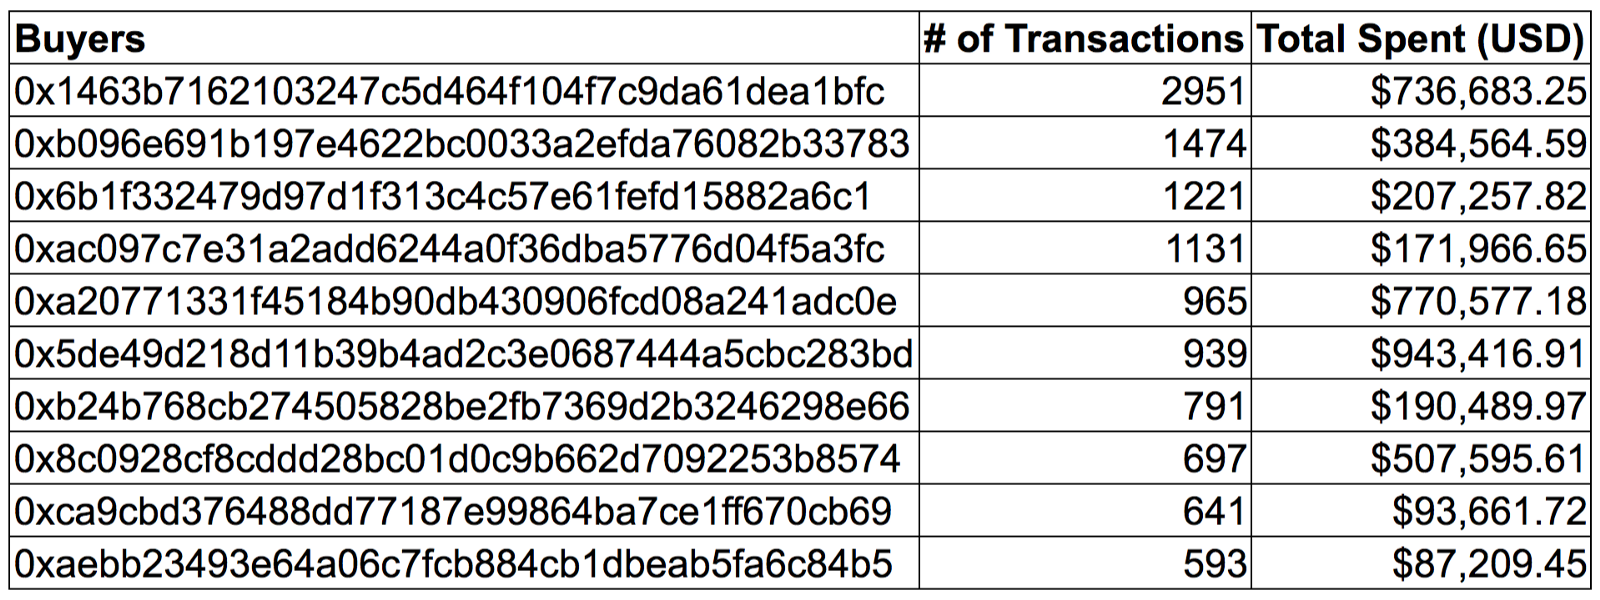
Although the sale had 2,000 unique buyers, at least 10,000 users had indicated interest in the sale, most of whom were unable to participate because other users had swooped in first. Decentraland held a follow-up mini-sale where whitelisted buyers were able to purchase 2% of the remaining MANA tokens.
The project spent most of ETH ICO treasury in 2018 (red bars below) with most of the coins sold in March of that year when ETH prices ranged from US$400-US$800. The project currently retains 1,250 ETH with 635 ETH spent in past 30 days.
Source: https://app.santiment.net/projects/decentraland
Historically, transactions per day (line, chart below) have remained below 1,000 and even below 500 on most days. A spike in transaction volume coincided with the December 2017 and January 2018 highs in MANA price suggesting this was due to speculative demand. Daily Active Addresses (fill, chart below) followed a nearly identical pattern of very little activity.
Source: coinmetrics.io
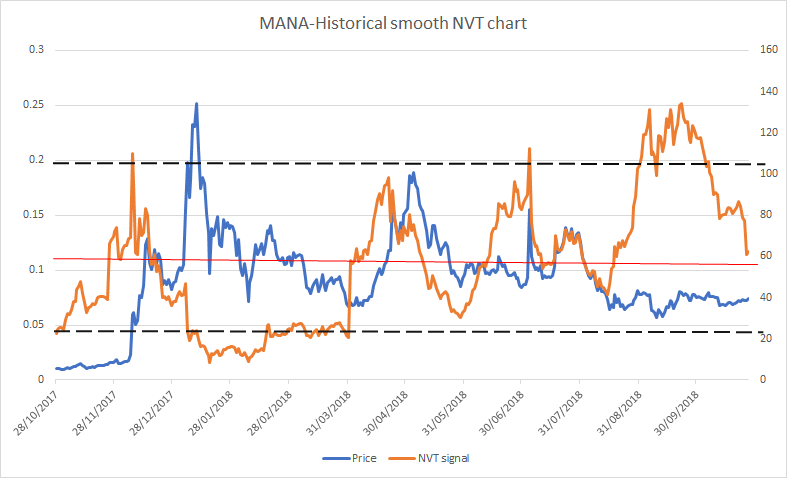
The 30-day Kalichkin network value to estimated on-chain daily transactions (NVT) ratio (line, chart below) has oscillated wildly between 0 and 90 since inception. MANA likely needs another year or two of activity before this metric produces useful information. Inflection points in NVT can be leading indicators of a reversal in an asset’s value. A clear uptrend in NVT suggests a coin is overvalued based on its economic activity and utility, which should be seen as a bearish price indicator, whereas a downtrend in NVT suggests the opposite.
Turning to developer activity, MANA has 74 repos on GitHub with the highest activity occurring on the marketplace repo where at least 10 developers have contributed a cumulative 604 commits in the past year. In January, Software Developer Kit (SDK) 5.0 was released adding the possibility for motion and animations in the Decentraland world.
Most coins use this development platform, where files are saved in folders called "repositories," or "repos," and changes to these files are recorded with "commits," which save a record of what changes were made, when, and by who. Although commits represent quantity and not necessarily quality, a higher number of commits can signify higher dev activity and interest.
Source: https://github.com/decentraland/marketplace/graphs/contributors
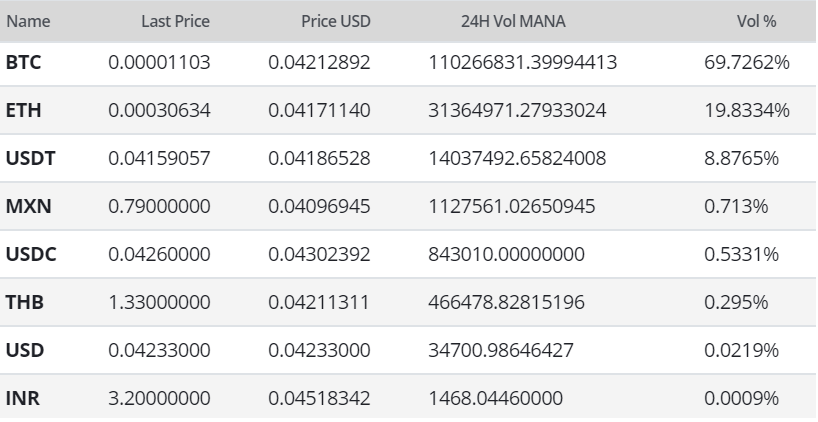
MANA exchange traded volume is mainly led by the Bitcoin (BTC) pair with 62% of all MANA volume occurring on Binance in the past 24 hours. In December 2018, Coinbase listed the MANA/USDC pair on Coinbase Pro. Earlier this week, the yet-to-be-released HTC Exodus 1 announced mobile wallet support for MANA at a Mobile phone expo in Barcelona.
Google Trends data for the term "Decentraland" remain down sharply since mid December 2017. A slow rise in searches for "Decentraland" preceded both highs in August 2017 and December 2018, likely signaling interest from new market participants at that time. A 2015 study found a strong correlation between the Google Trends data and BTC price, while a May 2017 study concluded that when the U.S. Google "bitcoin" searches increased dramatically, BTC price dropped.
Technical Analysis
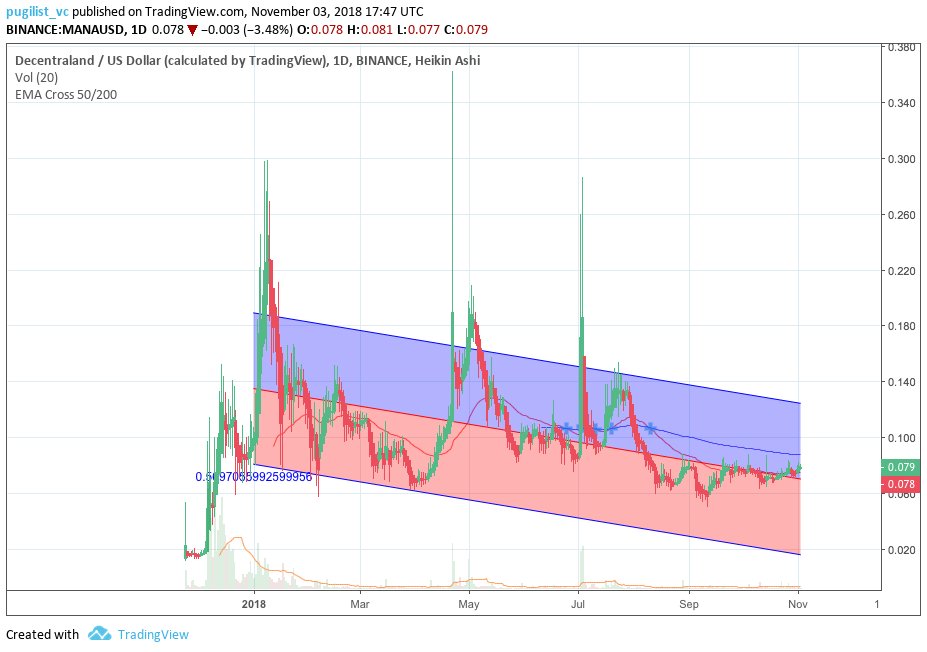
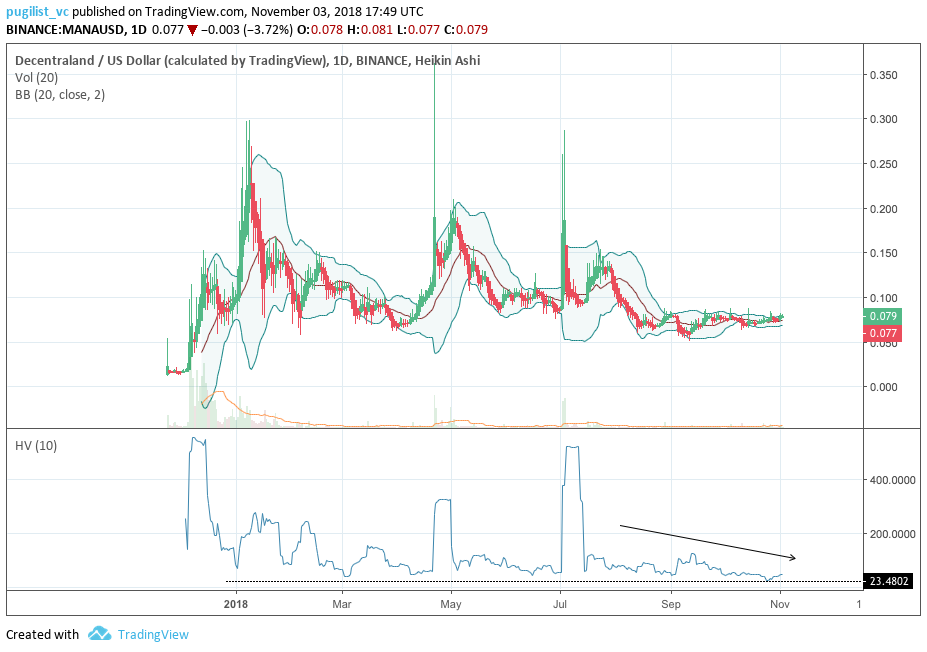
MANA has traded a little over a year on exchanges and therefore has limited price data. However, the trend has remained distinctly bearish for a majority of this time period. As speculative trading volumes increase due to news events, and the crypto market broadly has a chance for significant bullish momentum, MANA may begin to trend bullish. As price approaches key resistance levels, price roadmaps can be found on high timeframes using Ichimoku Cloud, exponential moving averages (EMAs), and the volume profile.** **Further background information on the technical analysis discussed below can be found here.
For the Cloud, four metrics are used to indicate if a trend exists; the current price in relation to the Cloud, the color of the Cloud (red for bearish, green for bullish), the Tenkan (T) and Kijun (K) cross, and the Lagging Span. The best entry always occurs when most of the signals flip from bearish to bullish, or vice versa.
On the daily chart, price has remained below the Cloud and below the 200EMA for most of the available price history. A traditional long entry will not trigger until price is above the Cloud. There are currently no active RSI or volume divergences. Additionally, there is significant overhead resistance based on the volume profile (horizontal bars). Bullish price discovery will likely occur if the token price breaches the US$0.11 level, as price will then also be above the Cloud and 200EMA.
On the daily MANA/BTC chart, price has essentially been range bound between the 1000 and 2000 sat level since being added to Binance. The current trend structure is similar to the MANA/USD pair; price is below the Cloud and below the 200EMA. Again, a traditional long entry will not trigger until price is above the Cloud, currently at 1400 sats. There is also significantly less overhead volumetric resistance above 1400 sats.
Conclusion
Fundamentals suggest an actively developed project aiming to become a Second Life 2.0 analog for a decentralized VR world. LAND purchases and development are still in the very early stages, similar to unsettled frontier land, with the added bonus of artificial scarcity. MANA token usage and LAND plot turnover are negligible, which may significantly change with the release of the HTC Exodus 1. Any organic non-speculative demand of MANA or LAND is unlikely to occur until a ‘killer dApp’ is released or the SDKs become significantly more advanced. The tokenomics of the project do not favor holders of the MANA token until LAND sales increase significantly. Further, the adjustable and unclear token emission schedule is dependent upon a Proof of Stake voting which ideally will never encourage dilution of existing tokens.
High timeframe technicals are limited due to the asset’s short lifespan currently. Two litmus tests for trend indication include price position above or below both the daily Cloud and the 200EMA. Although price is currently below both metrics on both the MANA/USD and MANA/BTC pair, price has also begun to test the resistance levels on both. Thanks to a Coinbase listing, speculative MANA demand will likely greatly benefit from the pending aforementioned ‘alt season’.

Don’t miss out – Find out more today

