Sui Price Prediction: Bullish Fractal Emerges Near $0.99—Is SUI Near a Bottom After Falling From $1.25 to $0.95?

Sui (SUI) is showing mixed technical signals after retreating from $1.25 to approximately $0.95, with the token trading near $0.99 in the latest chart analysis provided.
While a bullish fractal on the three-day Sui chart points to a possible recovery, shorter-term Elliott Wave analysis suggests that selling pressure may persist before a clearer reversal develops.
The next key levels are $0.95 support and $1.05 resistance. Market participants are watching whether SUI can maintain its support base and break above resistance, which could strengthen the case for a recovery. However, a developing bullish pattern does not confirm that the correction has ended.
SUI Price Prediction: Bullish Fractal Faces a Critical Test
A three-day Coinbase chart shared by crypto analyst @lourenco_vs highlights a potential bullish fractal, with converging trendlines and labeled Elliott-style waves suggesting that the market structure may be approaching a turning point. The chart also identifies fair value gaps (FVGs), which traders monitor as potential areas of price imbalance.
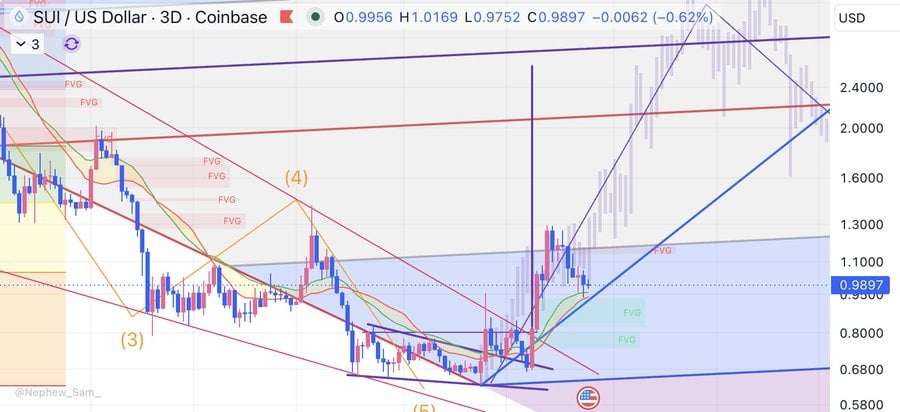
The 3-day Coinbase chart shows SUI near $0.99, with FVGs, Elliott wave patterns, and converging trendlines signaling a potential bullish fractal. Source: @lourenco_vs via X
The analysis emphasizes the importance of assessing the broader timeframe rather than interpreting every short-term pullback as evidence of renewed weakness. After an extended decline, traders may react cautiously to price fluctuations, even when higher-timeframe charts begin to show signs of stabilization.
Nevertheless, the fractal remains a technical interpretation rather than confirmation of a trend reversal. SUI would need to establish stronger price action around support and overcome nearby resistance before the bullish scenario gains further credibility.
Elliott Wave Analysis Warns of Further Downside
A separate four-hour analysis presents a more cautious outlook. According to the accompanying Elliott Wave interpretation, SUI has continued to follow a bearish scenario after declining from the top of Wave D. The developing structure now appears to be forming either a symmetrical or diametric pattern, with price moving through Wave E.
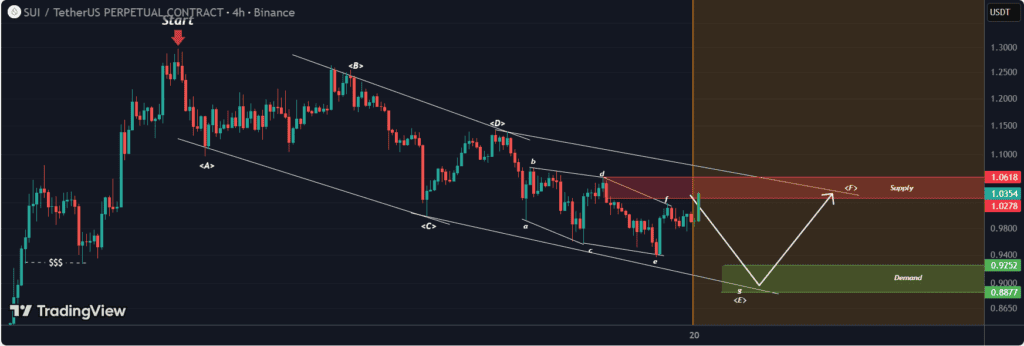
The pattern now suggests a symmetrical or diametric structure, with the SUI price currently progressing through Wave E. Source: behdark via X
Within this larger formation, Wave E may itself be developing into a diametric pattern. The analysis suggests that Wave G of E remains incomplete, leaving room for another downward move before the broader structure progresses into Wave F.
The projected green zone is identified as a potential area for Wave G to end. A move into that region could also sweep a previously identified liquidity pool, making it an area to monitor for a possible reaction. However, the source analysis does not provide a specific price level for this zone, so its exact location cannot be established from the available information.
The trading framework outlined in the analysis favors watching for potential short positions between the current price and a higher red zone, with the green zone as a downside target. If SUI reaches the green zone and subsequently produces a confirmed bullish reaction, the red zone becomes a potential recovery target.
These scenarios depend on how price behaves at the identified zones. The Elliott Wave count may also change as new candles develop, so the projected sequence should not be treated as a confirmed outcome.
SUI Support at $0.95 and the $1.05 Breakout Level
Crypto analyst @CryptoMichNL argues that SUI may have completed its correction from $1.25 to $0.95. The analysis links the decline to a broader market pullback, noting that Bitcoin fell approximately 10% from $87,000 during the period under review.
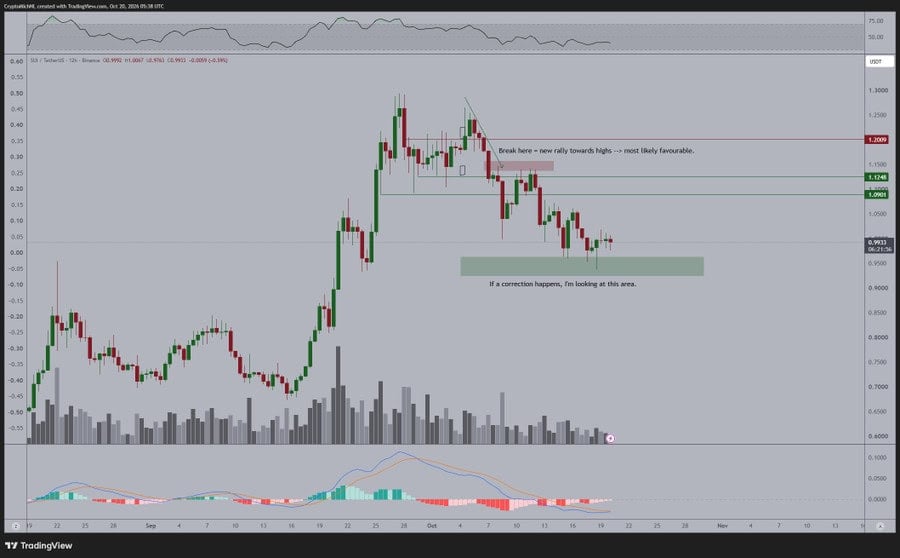
SUI may have completed its correction from $1.25 to $0.95 amid Bitcoin’s 10% decline from $87K, as altcoins typically face deeper volatility-driven selloffs. Source: @CryptoMichNL via X
Altcoins can experience sharper price swings during broad market corrections because liquidity conditions and investor risk appetite affect their performance. SUI’s decline therefore needs to be assessed alongside the wider cryptocurrency market rather than in isolation.
The $0.95 area is the key support level highlighted in the supplied analysis. Holding above it would keep the potential recovery scenario in consideration, while a decisive break below support could expose SUI to additional downside. The available sources do not establish a confirmed lower target.
On the upside, $1.05 is the principal level to watch. A sustained move above this threshold could provide stronger evidence that buyers are regaining control and potentially open the way toward higher resistance levels. Until that breakout occurs, the possibility of another rejection or a period of consolidation remains.
Macro Outlook: Bitcoin’s Pullback Adds Pressure to Altcoins
Bitcoin’s reported decline from $87,000 provides important context for SUI’s recent weakness. When the largest cryptocurrency retreats sharply, altcoins can face additional selling pressure as traders reduce exposure to riskier assets.
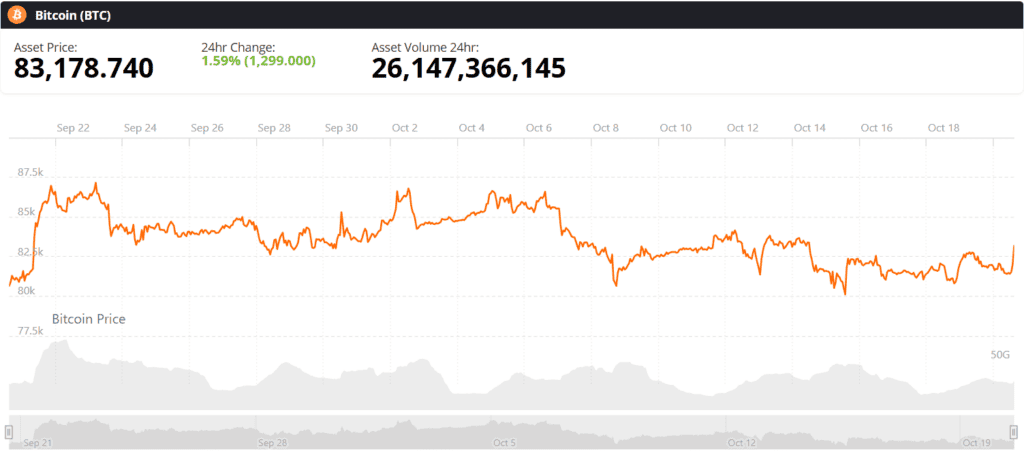
Bitcoin (BTC) price chart. Source: Brave New Coin
The relationship is not uniform, and Bitcoin’s direction alone cannot determine SUI’s next move. Still, a broader market recovery would provide a more supportive backdrop for a bullish fractal to develop, while renewed weakness across major cryptocurrencies could undermine attempts to hold support.
Traders assessing SUI’s outlook should therefore consider both its individual chart levels and the wider market trend. A recovery in Bitcoin could help improve sentiment, but SUI would still need to demonstrate its own strength by defending support and reclaiming resistance.
Looking Ahead: Can SUI Confirm a Reversal Near $0.99?
SUI’s current technical picture remains divided between a potential bullish fractal on the three-day chart and a bearish Elliott Wave structure on the four-hour timeframe. The difference highlights why signals across multiple timeframes may not align during a correction.
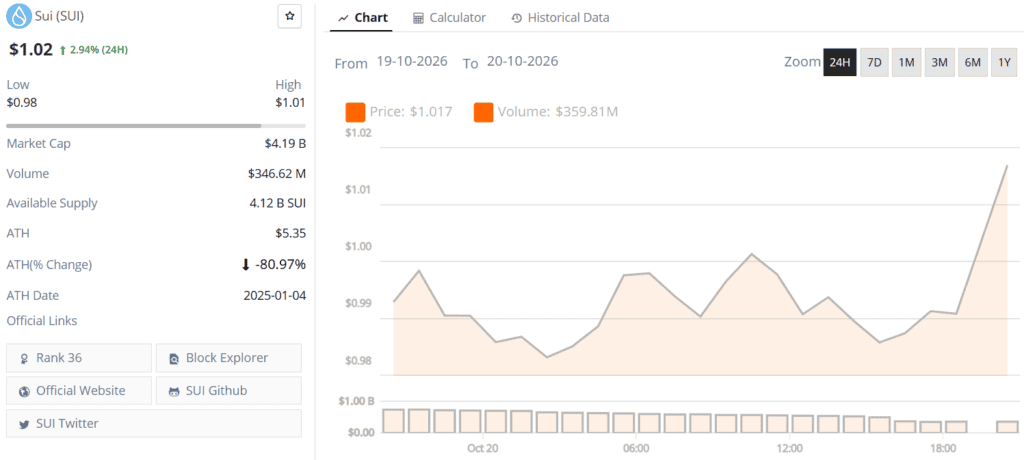
Sui price chart. Source: Brave New Coin
The immediate focus remains on the $0.95 support area and the $1.05 resistance level. Holding support and breaking above resistance would strengthen the recovery case. Conversely, continued rejection below $1.05 or a loss of $0.95 would weaken the argument that SUI has established a durable bottom.
For now, the available chart analyses point to a market at a potential decision point rather than a confirmed reversal. A sustained breakout, stronger follow-through, and improving broader market conditions would provide more convincing evidence that SUI is preparing for another advance.
 Brave New Coin reaches 1M+ engaged crypto enthusiasts a month through our website, podcast, newsletters, and YouTube. Get your brand in front of key decision-makers and early adopters in 2026. Limited slots remaining! Find out more today!