Uniswap Price Analysis – Bullish technicals for No.1 DEX

![]()
Technicals for both the UNI/USD and UNI/BTC pairs show a bullish trend with prices over the 33-day EMA and four-hour Cloud.
Uniswap is a Decentralized Exchange (DEX) protocol founded by Hayden Adams in 2018. The DEX enables the trading of ERC-20 tokens, in a non-custodial manner, through a software or hardware wallet. Uniswap released a governance token (UNI) via airdrop on September 16th, 2020. UNI currently has a market cap of US$5.1 billion, placing it 13th on BraveNewCoin’s market cap table, with US$1.5 billion in trading volume over the past 24 hours.
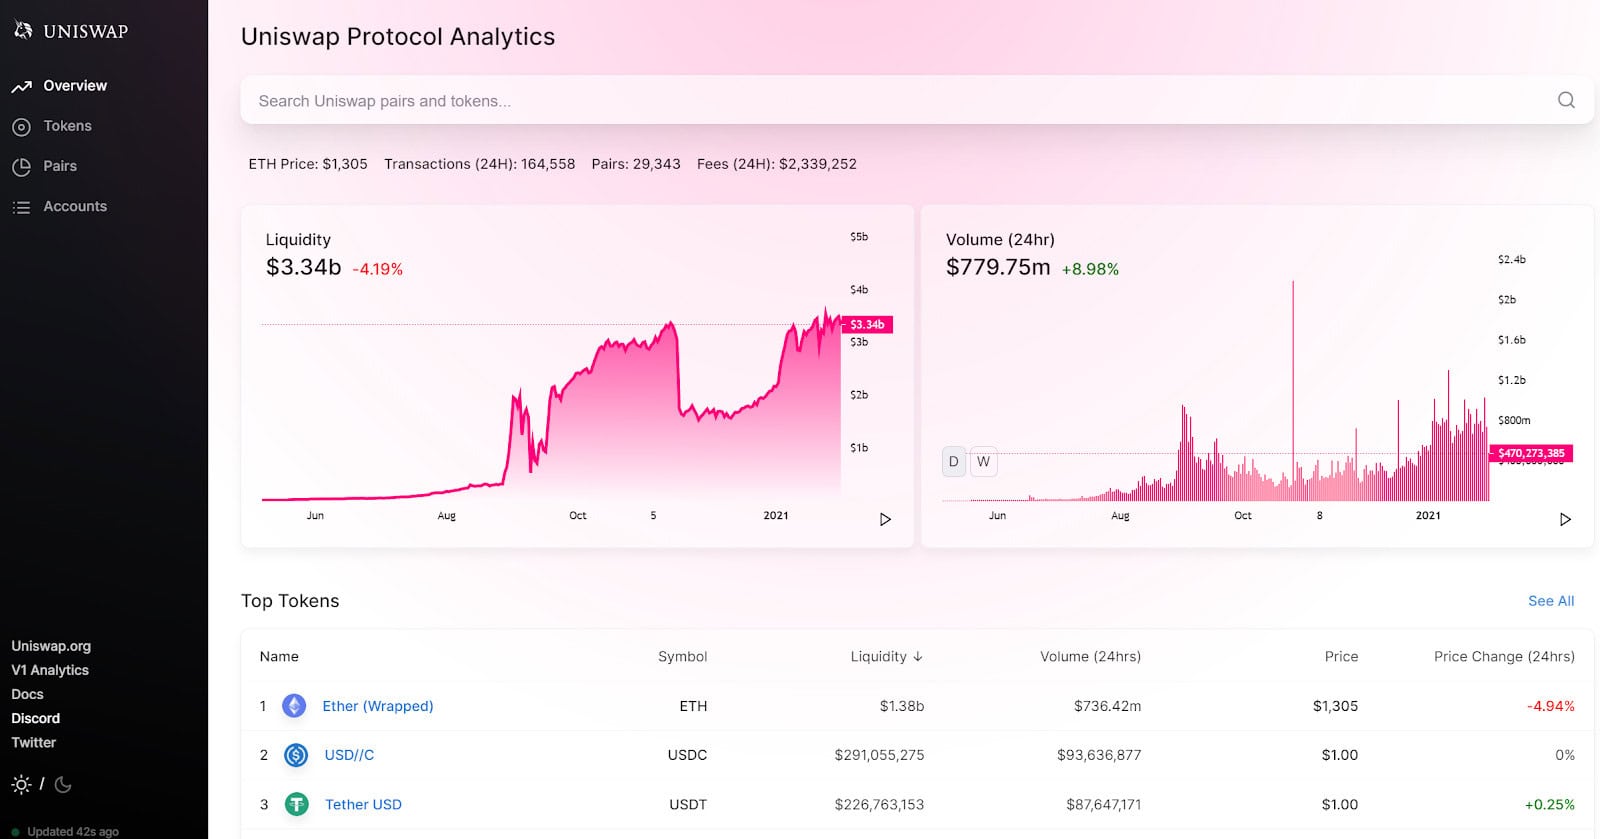
Source: info.uniswap.org/home
DEX trading volumes has increased rapidly in recent months. Uniswap (pink) has held a majority of that volume, with over US$24 billion this month alone. Despite increasing competition, Uniswap’s volume has continued to increase month-over-month. Sushiswap has also experienced rapidly growing volume, with over US$11 billion this month alone.
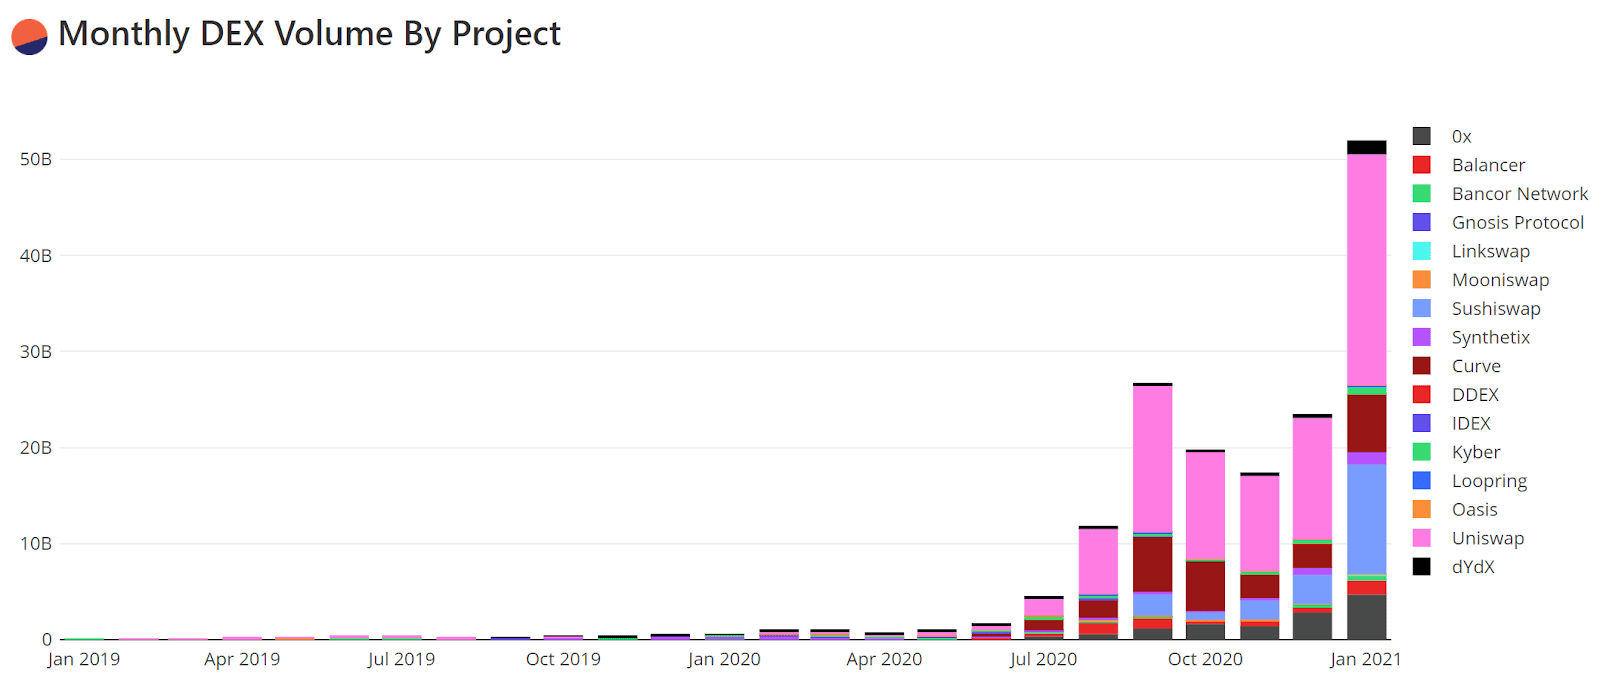
Source: Dune Analytics
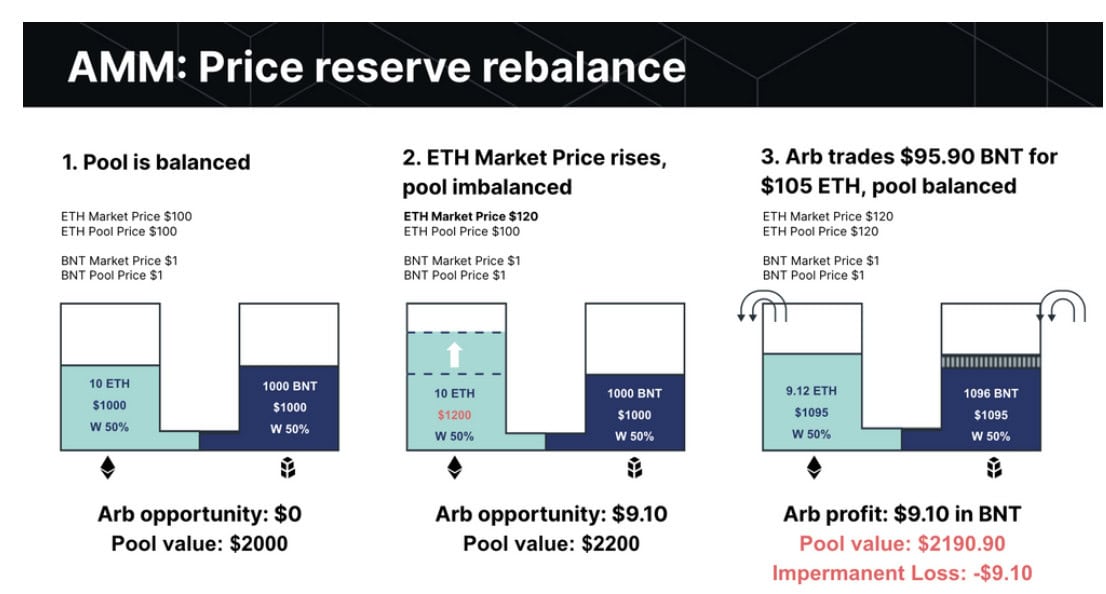
Uniswap trades function through an automated market maker (AMM) which uses an _x*y=k _formula, where x represents the amount of one token in a liquidity pool, y is the amount of another asset, and k is a fixed constant. The value of both assets within Uniswap AMMs is 50:50. Effectively, as one token within the AMM pair appreciates or depreciates, the other token will be bought or sold to make up the difference.
Liquidity providers (LPs) provide their capital for a specific liquidity pool. LPs replace the traditional order books of centralized exchanges. In exchange, LPs are rewarded 0.3% in trading fees generated by trades within the pool. Additional incentives, such as yield farming and liquidity mining, also encourage LPs to provide liquidity. Many individual tokens have also provided unique LP incentives to incentivize liquidity.
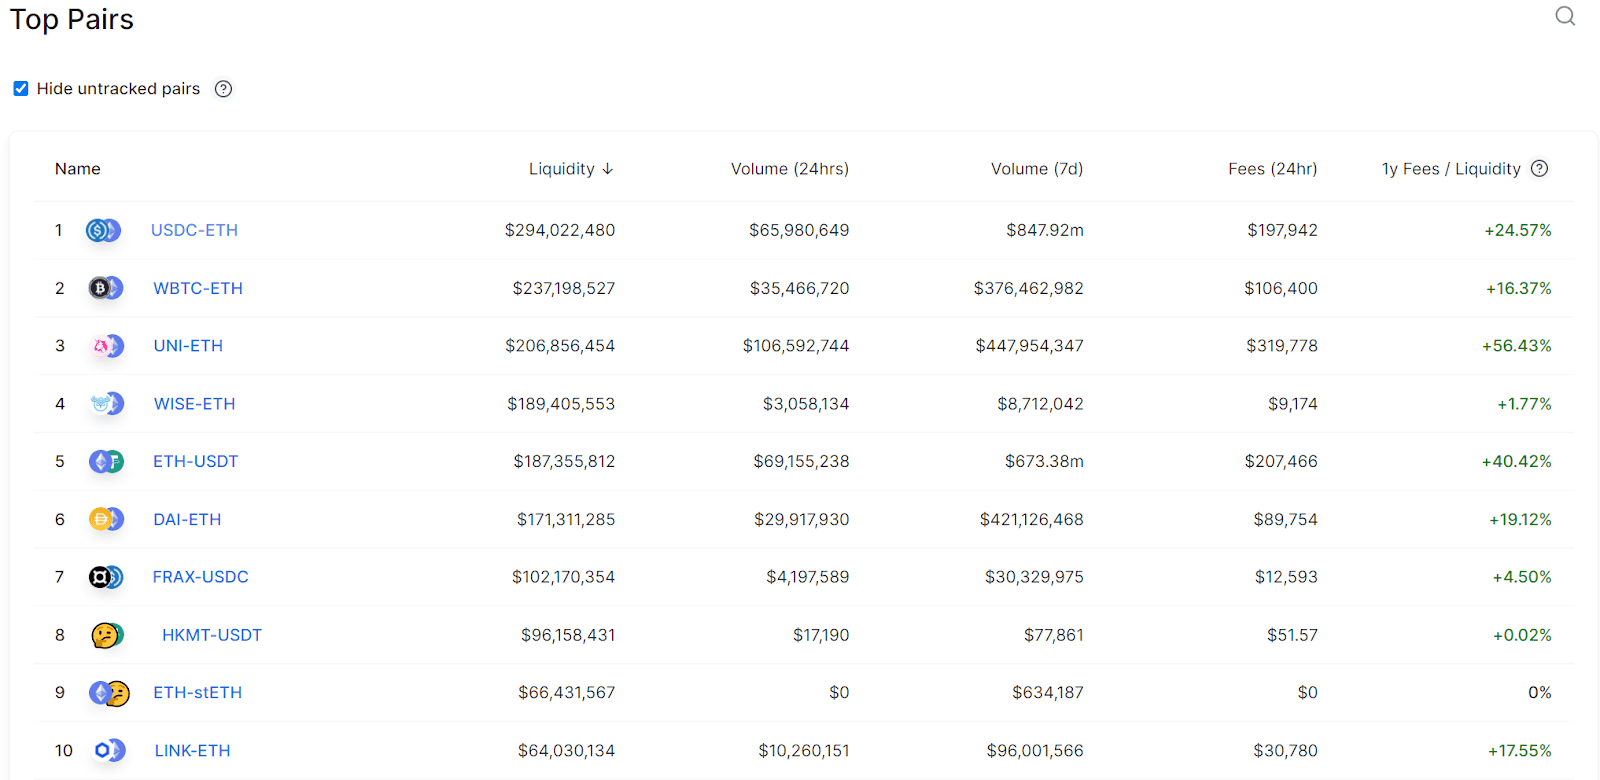
Source: info.uniswap.org/pairs

Source: uniswap.org/docs/v2/core-concepts/pools/
AMMs also introduce impermanent loss (IL), which occurs when the price of a deposited asset in a liquidity pool changes compared to when the asset was first deposited, relative to the other asset in the pair. The greater the change, the higher the potential for IL. This type of mechanism is said to be “impermanent” because as long as the relative prices of the tokens in the AMM return to when they were first deposited, the loss disappears and trading fees remain as a reward.
For example, two assets which are highly correlated within a trading pair, such as wBTC/renBTC, will have very little IL over a long period of time, compared to when initially deposited. Pairs such as ETH/USDC or UNI/ETH are highly uncorrelated and will experience significant IL over a long period of time, compared to when initially deposited. Overall, because of IL, participating in an AMM runs the risk of under-performing a basic buy-and-hold strategy.

Source: uniswap.org/docs/v2/core-concepts/pools/
Source: blog.chain.link
In mid-September 2020, a total of 150 million UNI were minted and airdropped. The 49,192 historical LPs received 49 million UNI were and any address that ever interacted with a Uniswap contract also received 400 UNI, a total of 251,534 addresses and 100 million UNI. The governance treasury retained 43% of the total UNI supply to distribute on an ongoing basis. After four years, a perpetual inflation rate of 2% UNI per year will begin.

Source: uniswap.org/blog/uni
UNI currently has a 287 million circulating token supply, with a 1 billion max supply. Over US$3.19 billion is locked within the UNI protocol in a mixture of assets, including BTC, ETH, and dai. The total value locked into contracts on UNI is 4th, behind the MakerDAO, AAVE, and Compound.
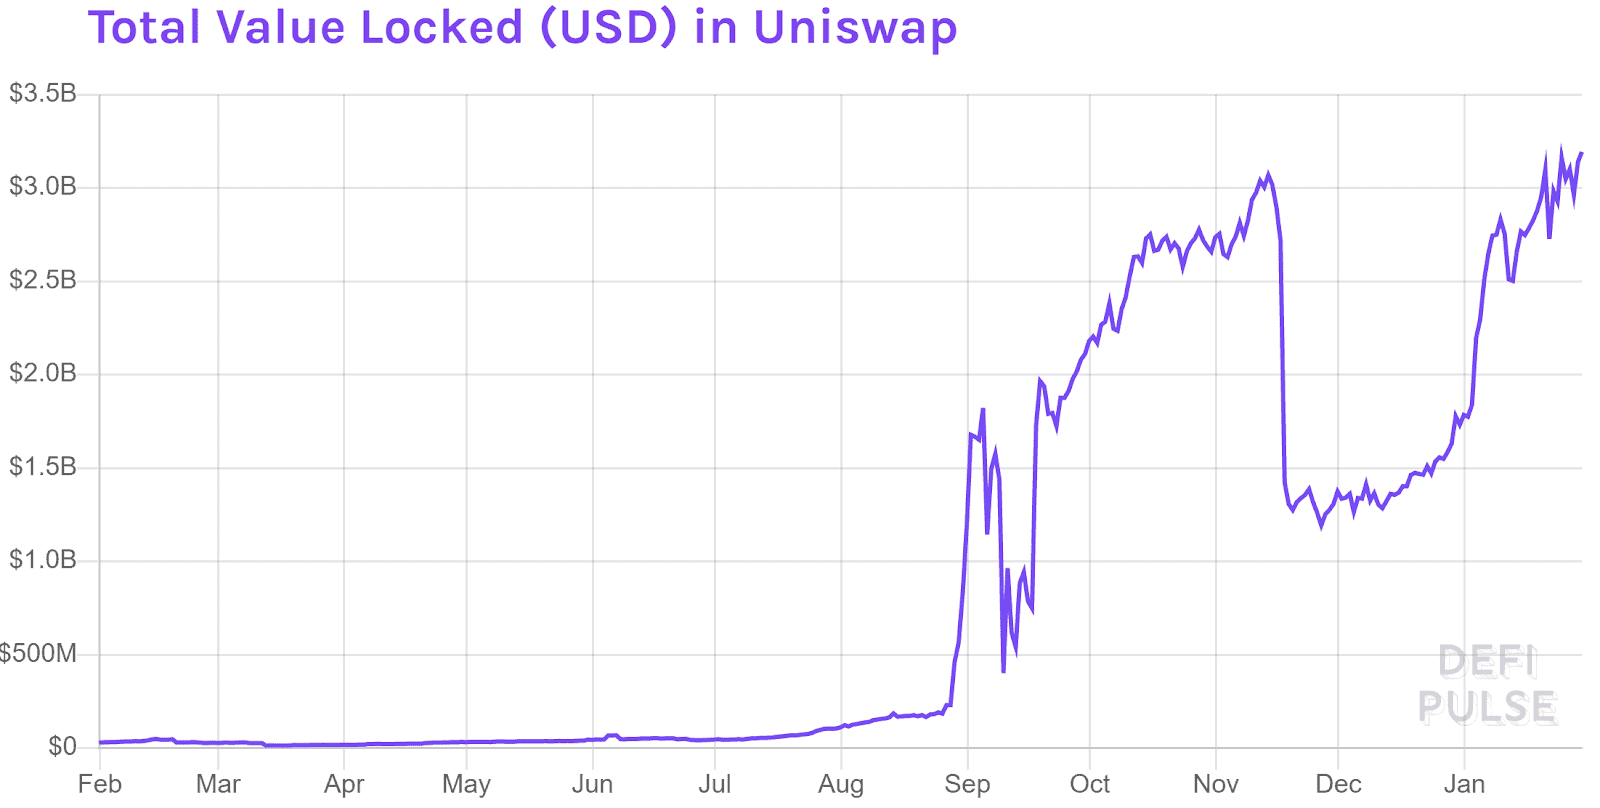
Source: DefiPulse
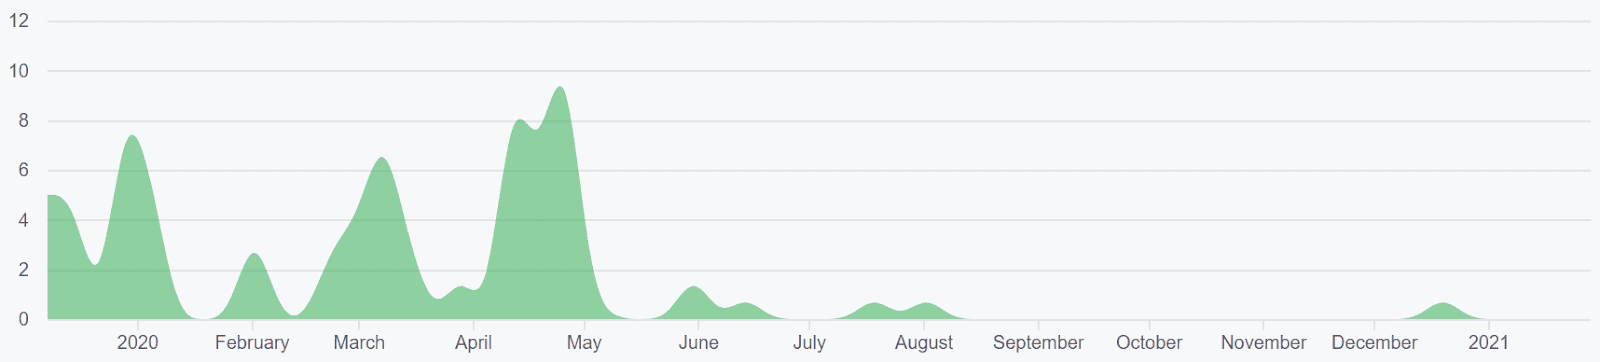
On-chain UNI token stats reveal a significant increase in both transactions per day and average transaction sizes over the past few weeks. Transactions per day hit an all-time high of 294,000 during the initial token distribution in September 2020. Since December, transactions per day increased 4x to over 12,000. Average transaction values have also increased significantly since December, along with token price.
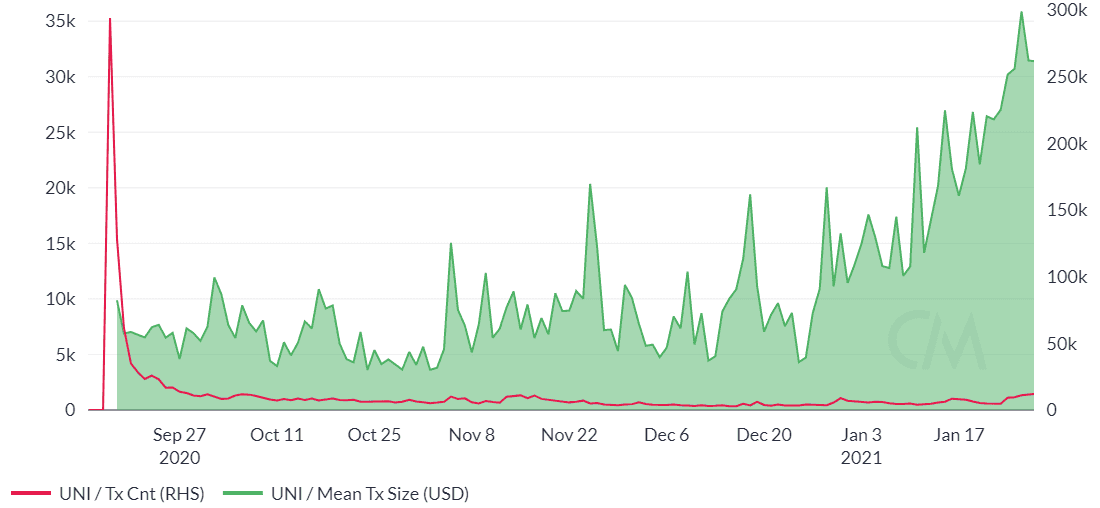
Source: CoinMetrics
The weekly Kalichkin network value to estimated on-chain daily transactions (NVT) ratio (red line) has ranged from 20 to 285 over the past few months. A clear downtrend in NVT suggests a coin is undervalued based on its economic activity and utility, which should be seen as a bullish price indicator. Daily active addresses (DAAs) hit nearly 180,000 during the initial token distribution in September 2020. There are currently over 8,000 DAAs, which have continued to increase over the past few months.
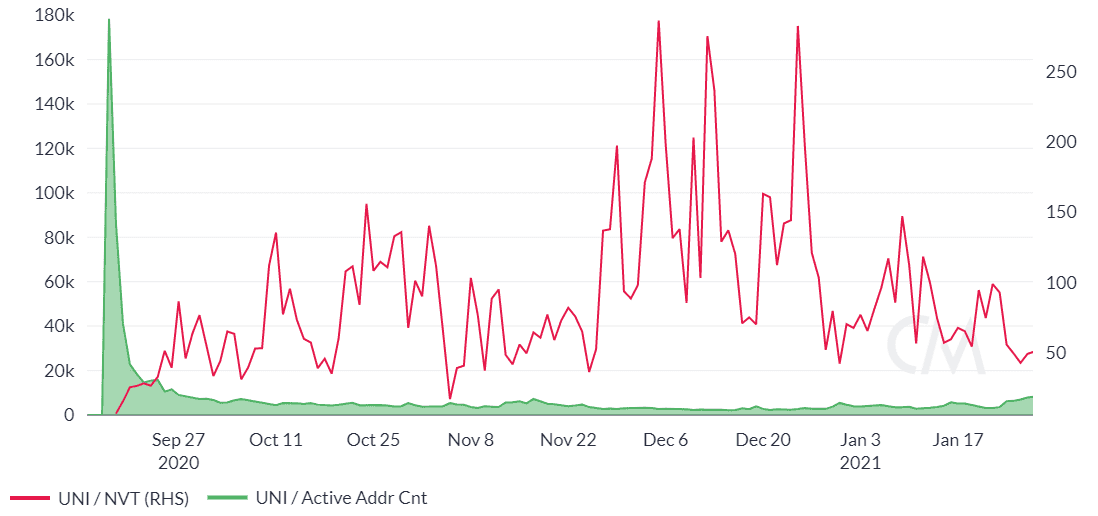
Source: CoinMetrics
On the development side, the UNI GitHub account has 35 repos with seven active developers. Most coins use the developer community of Github where files are saved in folders called "repositories," or "repos," and changes to these files are recorded with "commits," which save a record of what changes were made, when, and by who. Although commits represent quantity and not necessarily quality, a higher number of commits can signify higher dev activity and interest.
Source: GitHub – Uniswap/uniswap-v2-core
Source: GitHub – Uniswap/uniswap-v2-periphery
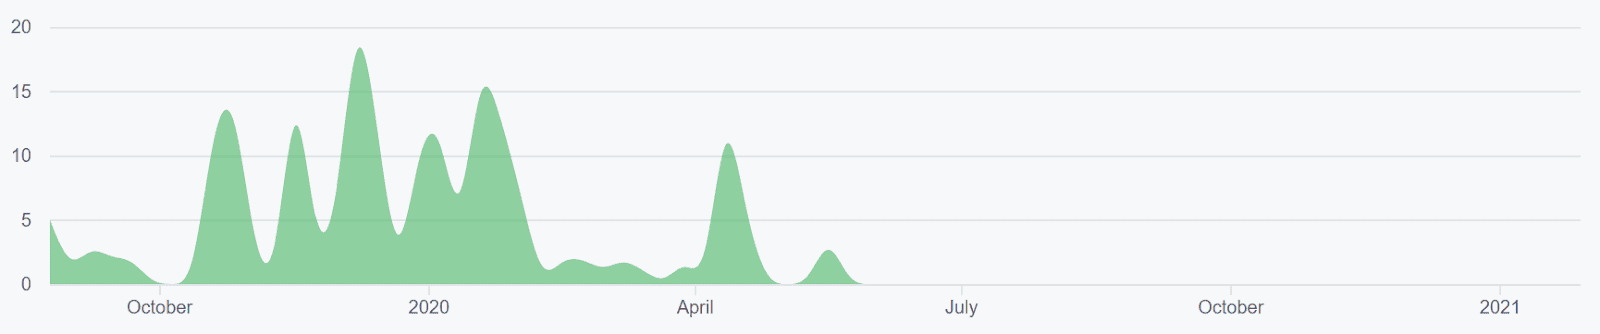
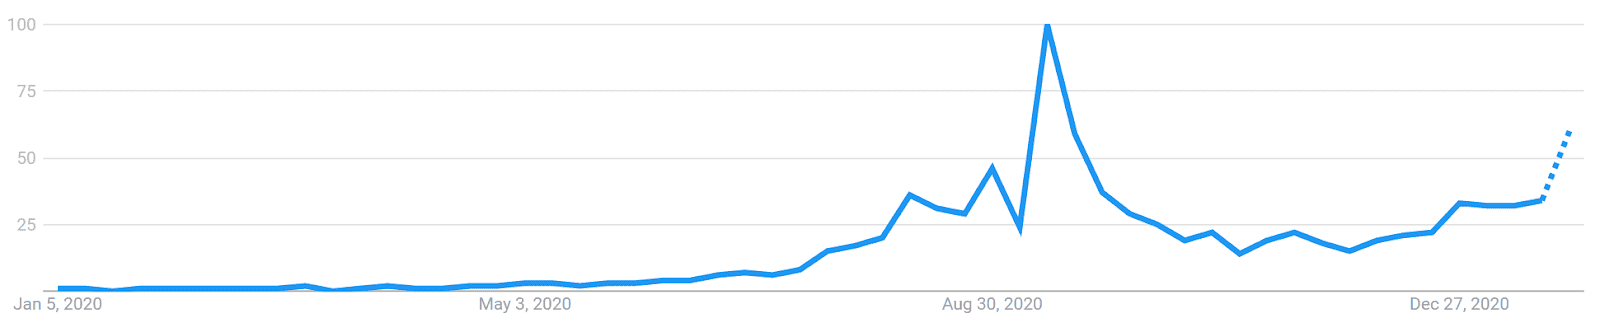
Worldwide Google Trends data for the terms “Uniswap” increased massively throughout mid-2020. Over the past few weeks, searches have been on the increase once again. A 2015 study found a strong correlation between the Google Trends data and BTC price, while a May 2017 study concluded that when the U.S. Google "Bitcoin" searches increased dramatically, BTC price dropped.
Technical Analysis
Roadmaps for future market movements can be found on high timeframes using Exponential Moving Averages, Volume Profile Visible Range, Pivot Points, Ichimoku Cloud, and divergences. Further background information on the technical analysis discussed below can be found here.
UNI has a limited trading history and needs to be analyzed on lower timeframes, as opposed to the daily chart. On the four-hour timeframe, the 50-period Exponential Moving Average (EMA) and 200-period EMA crossed bullish on December 17th, which has resulted in a 390% increase. Upside resistance while in price discovery, based on yearly pivots, sits at US$22.50 and US$27.00.
Price is currently nearly 2x from the 200-period EMA and has not touched the 200-period EMA since January 11th. If the horizontal support fails, the next significant support sits at US$13.30 to US$14.30 based on yearly pivots and the 50-period EMA. Additionally, there are no current bearish divergences on volume or RSI to suggest weakening bullish momentum.
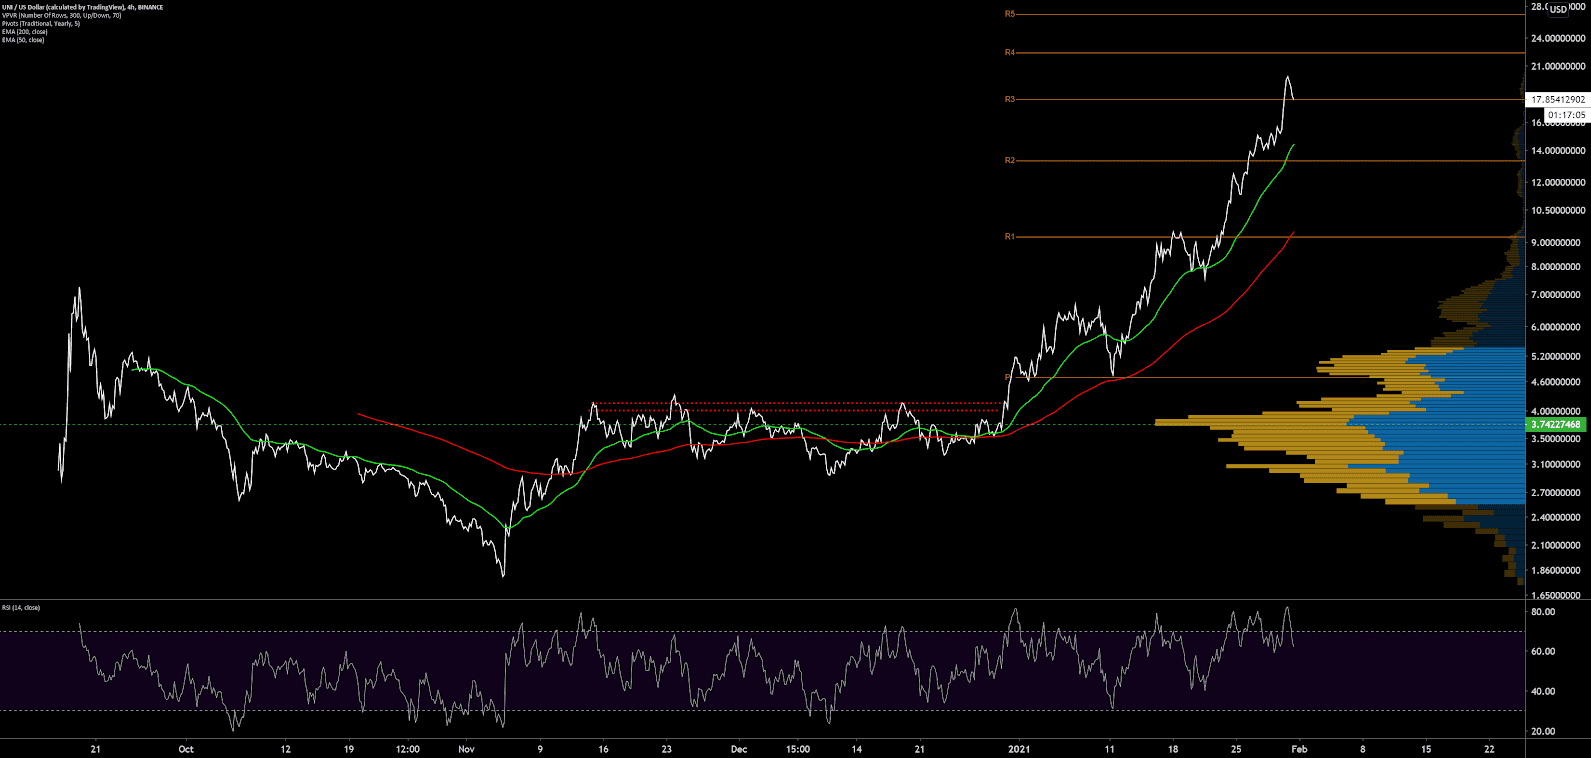
Turning to the Ichimoku Cloud, four metrics are used to indicate if a trend exists; the current price in relation to the Cloud, the color of the Cloud (red for bearish, green for bullish), the Tenkan (T) and Kijun (K) cross, and the Lagging Span. The best entry always occurs when most of the signals flip from bearish to bullish, or vice versa.
Cloud metrics on the four-hour timeframe, with doubled settings (20/60/120/30) for more accurate signals, are bullish; the spot price is above the Cloud, the Cloud is bullish, the TK cross is bullish, and the Lagging Span is above the Cloud and above the current spot price. The trend will remain bullish so long as the spot price remains above the Cloud, currently at US$11. Kijun support also sits at US$13.88.

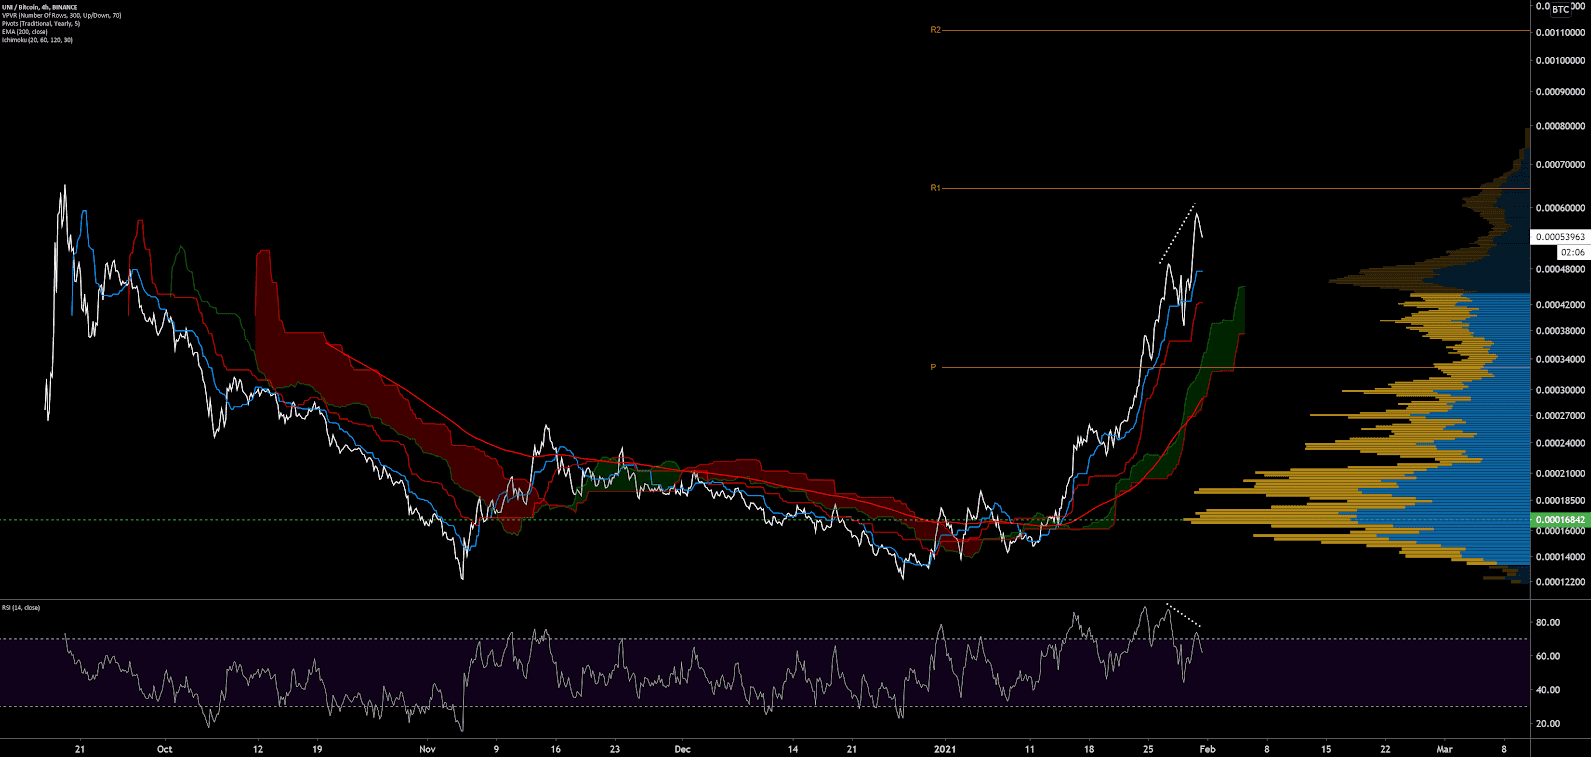
The UNI/BTC pair is very near all-time highs. Daily trend metrics are also bullish as price sits above both the 200-period EMA and Cloud, on the four hour timeframe. Up resistance, based on yearly pivots, sits at 64,000 sats and 110,000 sats. Kijun and VPVR support sits at 43,000 sats, with additional yearly pivot support at 33,000 sats. Additionally, a growing bearish divergence has formed on RSI to suggest waning bullish momentum.
Conclusion
Non-custodial decentralized exchanges (DEX) have quickly risen to prominence since mid-2020, along with the rise of various other DeFi mechanisms.
The UNI token airdrop in mid-2020 has been so successful it has inspired many other DEXs to do the same. Volume, total value locked, and on-chain token stats suggested a significant continued uptick in Uniswap DEX use and and UNI token use over the past few months.
Technicals for both the UNI/USD and UNI/BTC pairs show a bullish trend with prices over the 33-day EMA and four-hour Cloud. Upside resistance sits at US$22.50 and US$27.00 and 64,000 sats and 110,000 sats for the UNI/USD and UNI/BTC pairs, respectively. Both pairs show strong support, based on the daily Cloud, at US$13.50 and 43,000 sats, respectively.
 Brave New Coin reaches 1M+ engaged crypto enthusiasts a month through our website, podcast, newsletters, and YouTube. Get your brand in front of key decision-makers and early adopters in 2026. Limited slots remaining! Find out more today!


