WAVES Price Analysis: Movement appears imminent

![]()
2018 has been a challenging year for WAVES, with its price down 82% since January 1st. Network fundamentals contradict current price, however, with both onchain transaction volume and connection growth signalling a potential price pop
The WAVES project and its native token have built a loyal supporter base due in part to the accessibility, ease-of-use, and uniqueness of its blockchain.
The technology that underscores the Waves platform empowers users to build and create custom tokens with seemingly limitless possibilities. The WAVES token itself, is awarded to block producers for their services, and can be staked for greater access to the two tiered WAVES consensus mechanism.
The WAVES ICO was run by former member of the NXT project, and was completed in June 2016, earning ~US$16 million. WAVES has also made metaphorical industry ‘waves’ thanks to its publicized partnership with global accounting and consulting giant Deloitte.
WAVES has earned a reputation for complexity because of its extensive suite of network features. According to the official Waves website, there have been 18,889 unique tokens built on top of the WAVES platform, using the unique custom token creation mechanism built into the blockchain.
It is built with a unique ‘liquid block’ blockchain which distinguishes between ‘key’ & ‘micro’ blocks. And has a ‘leased’ proof-of-stake mechanism that allows users to assign their token to a large miner, who mines on their behalf, giving them access to passive rewards, without the need to sacrifice a large amount of processing power.
Another selling point of WAVES, is the internally built WAVES software client. Within a single software platform a user can trade tokens on the WAVES dex, create and issue new tokens to sell to others within the platform, and set up their node. This make the blockchain comparatively easy to use versus competitors, and highly accessible.
WAVES, despite the diverse range of value propositions baked into its blockchain, has suffered like many other digital assets under the 2018 bear market.
It currently trades at ~$2.3, down ~88% from an all time high of ~$16.2, while over the last 90 days it is down ~20%.
Given the current waning enthusiasm for ‘utility token’ ICOs, and the WAVES project’s primary use case as a platform to build and issue tokens on, its price may have suffered worse than others because of this bearishness.
For reference, Decred (DCR), a token with a similar market cap to WAVES, and which focused on building blockchain payment solutions, is currently down ~65% from its ATH
Trading pairs and exchanges
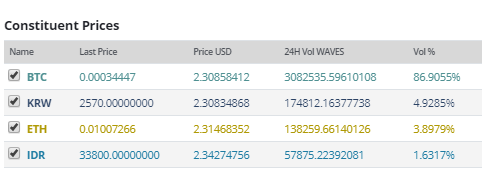
The most popular onramp in the WAVES marketplace is BTC, with the BTC/WAVES pair making up over 85% of the market — over 3 million tokens daily, and worth over 6.9 million USD. The next most popular pair is Korean Won/WAVES, which makes up less than 5% of the daily trading volume.of WAVES, rounding out the top four are Ethereum/WAVES and Indonesian Rupiah/WAVES.
There is also a USDT stablecoin (generally a popular crypto on-ramp) trading option available but it does not seem to be popular, likely because it is only offered by the obscure Liqui exchange.
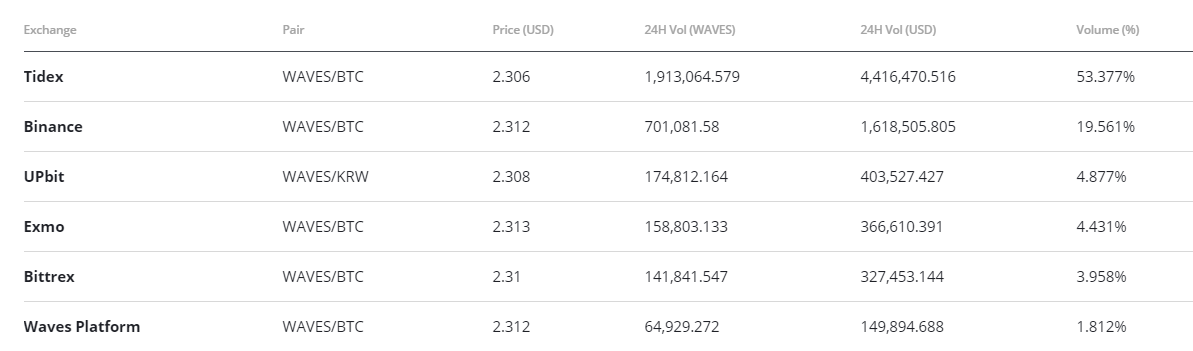
The most popular platforms for trading WAVES are Tidex and Binance, and the BTC/WAVES pair dominates these volumes. The WAVES internal DEX platform emerges with the 6th most popular WAVES onramp option with its WAVES/BTC offering, the pair makes up over 33% of the trading platform. The DEX solution also offers a number of digitized fiat options which are popular within the exchange.
Studying the nature of WAVES consensus
The WAVES platform uses the idiosyncratic WAVES-ng protocol. The core mechanism of the consensus is to allow multiple blocks on the WAVES transaction chain to be verified at the same time, theoretically resulting in increased transaction speeds.
With WAVES-ng, sequences of blocks are broken up into sections called Epochs, each epoch has a leader block from which other blocks are derived, in parallel. For example, a leader can have have two unique batches of two blocks attached to it, each having the unique reference of the original leader block public key.
The key block is generated by a proof-of-stake miner and does not contain transactions, but a public key. That is used to reference subsequent microblocks that do contain transactions.
The Waves-ng protocol extends the concept of the Bitcoin-ng model by letting miners extend the size of blocks by allowing them to be ‘liquid’ and keep growing until the key next block appears.
The proof-of-stake miner who creates the key block issues microblocks, and does so relatively easily. The key blocks contain no transaction data and are therefore very small, meaning they can keep being produced at a relatively low processing power cost to the proof-of-stake miner, who then issues microblocks, easily issued by signing them with a private key which references the public key of the original keyblock.
The microblock is then sent to the network upon which miners on the network compete to solve its problem, block production assignment of the microblocks is dependent on stake, with miners owning a higher stake of WAVES more likely to be assigned a block to be published, 60% of the reward goes to the refererer, while 40% goes to the actual block producer.
The advantage of the WAVES-ng protocol is its fluidity and the ability of key block miners to facilitate multiple blocks being published by multiple producers. The Waves-NG blockchain launched in December 2017. Based on testnet data, it was proposed that the WAVES network was capable of handling a volume of 100 txps.
It appears, however, that the network has not had to manage this sort of transaction volume in recent times. In 2018, based on historical blockchain data curated by Coinmetrics, the network’s busiest day was the 28th of March, when it handled 167714 transaction in 24 hours or ~1.94 transactions per second. Thus we are yet to see how the network performs at scale, and if nodes will be capable of handling a potential network bottleneck.
There also appears to be the possibility of a feudal-style mining system materializing on WAVES-ng, given the nature of proof-of-stake, which favours resource heavy miners within the network, who can purchase a sizable stake and weight mining rewards in their favour.
Currently, the top 6 miners on the WAVES blockchain, control over 75% of the network mining activity. This is heavily skewed, given that there are ~168 nodes operating in the network.
A smaller distributed network of nodes leads to a blockchain that is less decentralized, and therefore less censorship resistant and immutable. This could lead to political issues and cause potential miners to opt out of the network, given the reward odds are skewed against them and towards the richest in the network.
Onchain Valuation metrics: fundamentals sends bullish signals
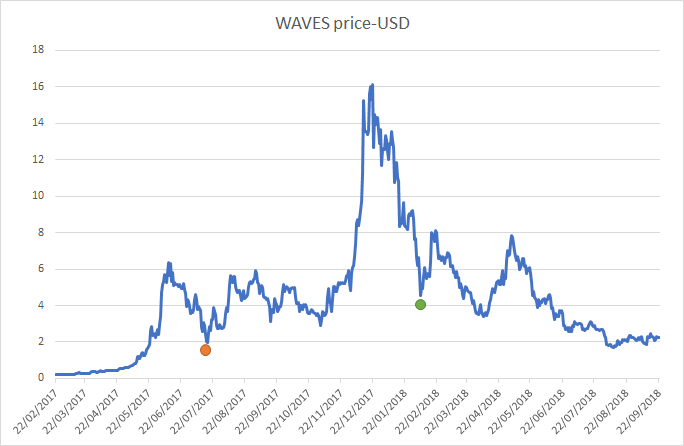
Figure 1: WAVES historical price data
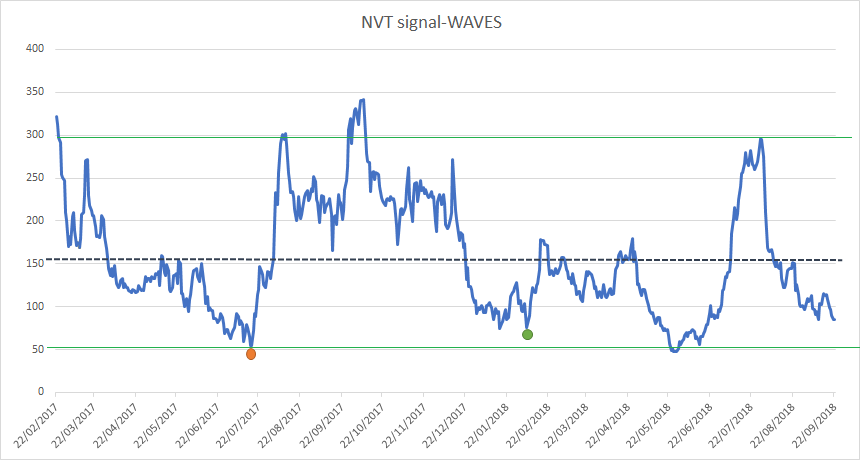
Figure 2: WAVES historical NVT signal data. (NVT signal = Market Cap/onchain transaction volume, smoothed with 30 day MA, Oversold range >300, Undersold range <50)
Onchain data sourced from Coinmetrics
The NVT signal, a responsive blockchain valuation metric, was developed & tested by Willy Woo and Dmitriy Kalichkin derived from NVT ratio. The simple idea is that crypto markets are prone to bubbles of speculative purchasing, not backed up by underlying network performance and activity.
A high NVT is indicative of a network that is going through one of these bubble periods, and is overbought/overvalued because of speculative assessment, and vice versa for a low NVT, which is indicative of an undervalued/oversold blockchain asset based on bearish speculation.
Figure 2, displays the WAVES tokens historical NVT starting from 22/02/2017, the black line represents the average NVT for WAVES over this period, ~156.22. For reference BTC, often used as a crypto benchmark, currently has an NVT signal of ~30, while this figure has never crossed 40 for the network.
WAVES towards the end of September has an NVT signal of ~85, and appears to be heading rapidly towards a bounce-off level that I perceive to be around 50.
A disclaimer is that it is assumed that the WAVES token has some speculation/unobservables built into its price, and this is natural.
Factors such as the newly updated consensus mechanism, and the current dilapidated state of the ICO ecosystem, are likely influence the token’s pricing for the conceivable future, meaning a comparatively high NVT is not necessarily a negative in the short run, but over time the mean value should diminish as the token matures.
Figure 2, shows that WAVES currently has an NVT signal well below its historical average. This is a strong signal that the token is currently undervalued, and its price is at present being pushed down by speculative, not fundamental factors.
Additionally, previous temporary floors for the WAVES NVT signals, generally well below the historical average, have come immediately before sharp upward price jumps.
On two separate occasions represented by the green and orange ovals on figures 1 & 2, 17/07/2017 and 06/02/2018, the correlation between a price rise, and an adjusting NVT signal, towards the mean level is striking. The current NVT signal well below the historical mean, and because of these previous relationships with price, this appears to be a bullish signal.
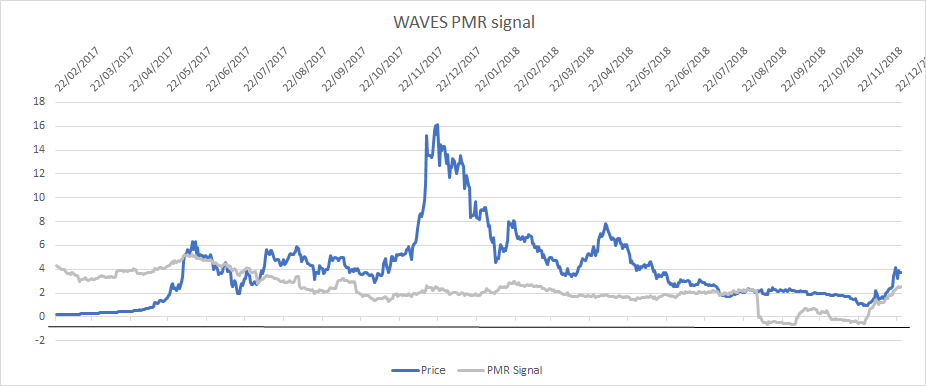
**(Fig 3. PMR or Price to Metcalfe, Natural log of Token value/Metcalfe Ratio. Meltcalfe Ratio = Active Addresses Squared) **
Metcalfe’s law is a measure of connections in a network, as established by Robert Metcalfe the founder of Ethernet. It has subsequently been used to analyze the true value of network-based financial products like Facebook and Bitcoin, and by comparing it to price, can provide a useful tool to assess whether a token is over or undervalued.
It is also a more straightforward metric to implement versus onchain transaction volume, which can be challenging to measure accurately in USD terms. Coinmetrics.io measures active addresses as ”the number of unique sending and receiving addresses participating in transactions on the given day.”
This makes it a relatively transparent metric as compared to onchain volume. However, there may be a question of who is in control of these addresses, and whether this growth in connections is organic.
Similar to NVT signal, currently the PMR for WAVES (I use thhe update Kalichkin methodology) is significantly below its historical average. The current negative PMR (a natural log) implies that for the first time in WAVES history, the denominator (Active Addresses^2) overpowers the numerator. This is a strong indicator that the network is undervalued, and is another strong buy signal for traders.
For reference, in the Clearblocks analysis of Bitcoin’s PMR, BTC has also had a PMR that dipped below 0 historically, indicating that a low PMR is possible in the current ecosystem of blockchains.
However, there appears to be sharp, suspicious one day active address growth, when between 21/08/2018 and 22/08/2018, active addresses on WAVES platform grew from from 830 to 8581, or 933% daily active address growth in a single day.
The likelihood that the growth was organic, is low. Google trends data for ‘WAVES’ related search terms for that time period is also flat.
This points to the possibility of manipulation and artificially created users/bots. That said, the WAVES platform did release a number of updates to its network and software client in August 2018, that may have been a factor in the sudden growth of active users.
WAVES is also a very popular platform for airdrops, and in order to participate in these free token drops, users are generally required to create new wallet addresses on the network. Users on twitter have speculated that this may have been a factor in the active address jump in August.
Technical Analysis
Long Term Trends
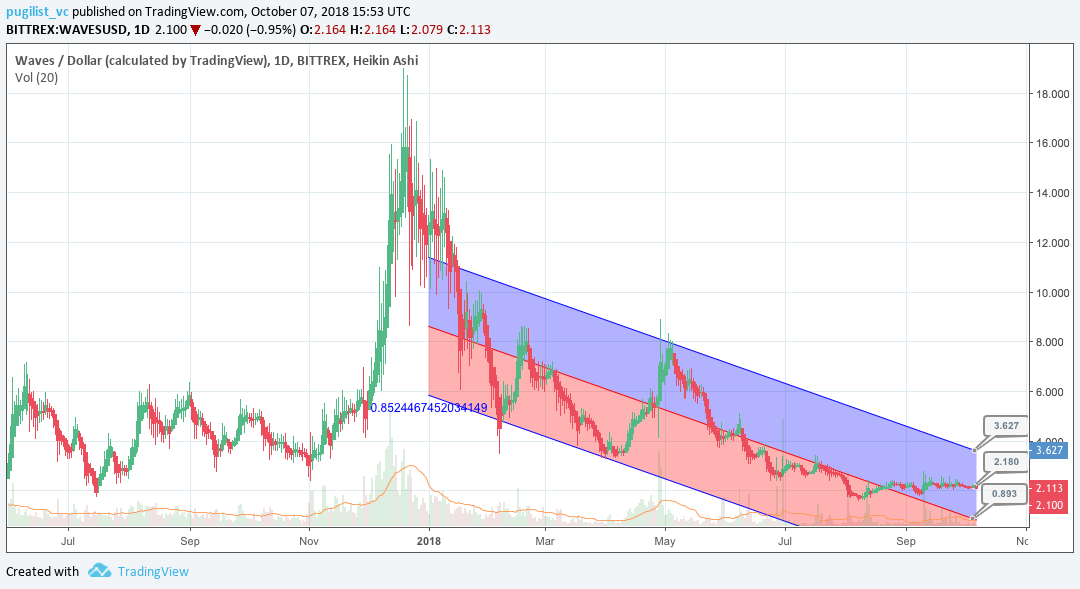
In 2018, the price of WAVES has been demonstrably bearish visualized by a negative linear price trend with a Pearson R correlation coefficient between time and price of 0.85, on the 1 day chart. Price is currently sitting at $2.10 and appears to be basing out well above the average trend path of $0.90.
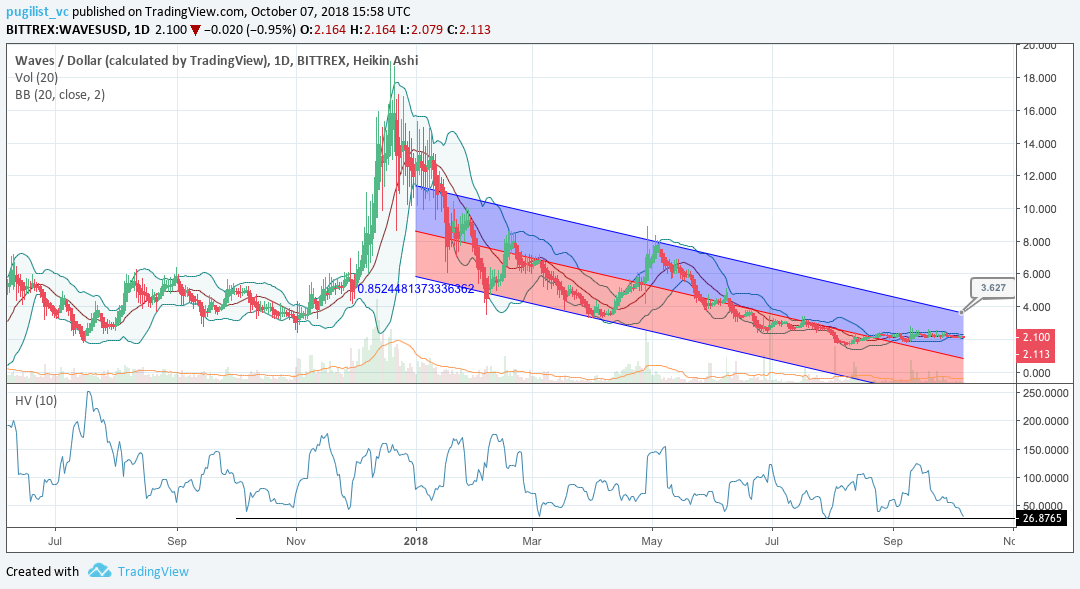
Additionally, price volatility for WAVES has been diminishing since September, visualized by the compressed bollinger bands and historical volatility nearing historical lows (black line). This compression typically precedes a price breakout in some direction. This notion may prove fruitful for a price increase towards the upper end of the regression trend ($3.63) if the breakout proves positive. Given the high market dependence on bitcoin (BTC), coupled with the 0.51 correlation between BTC and WAVES, the success of the aforementioned positive breakout, largely hinges on the price moves of BTC over the coming days and weeks, probabilistically speaking.
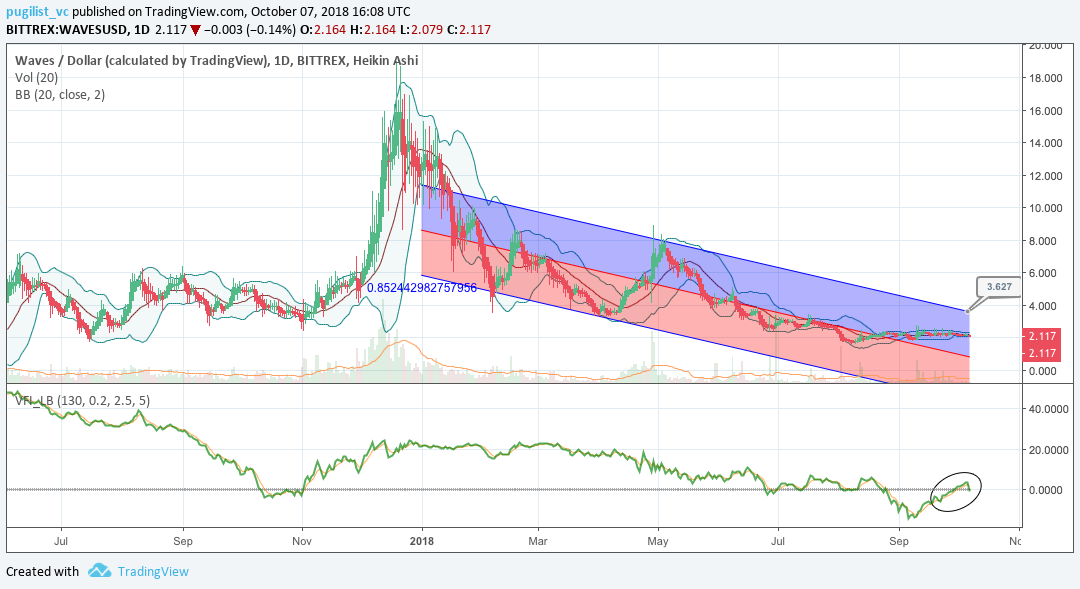
Lastly, further confirmation of the above premise is shown by the volume flow indicator (VFI), which has recently breached 0, and is currently holding above it (black circle). Whether price holds 0 or not will likely be determined by the breakout direction of WAVES. The VFI interpretation is: a value above 0 is bullish and below 0 is bearish, with divergences between price and oscillator being high probability signals.
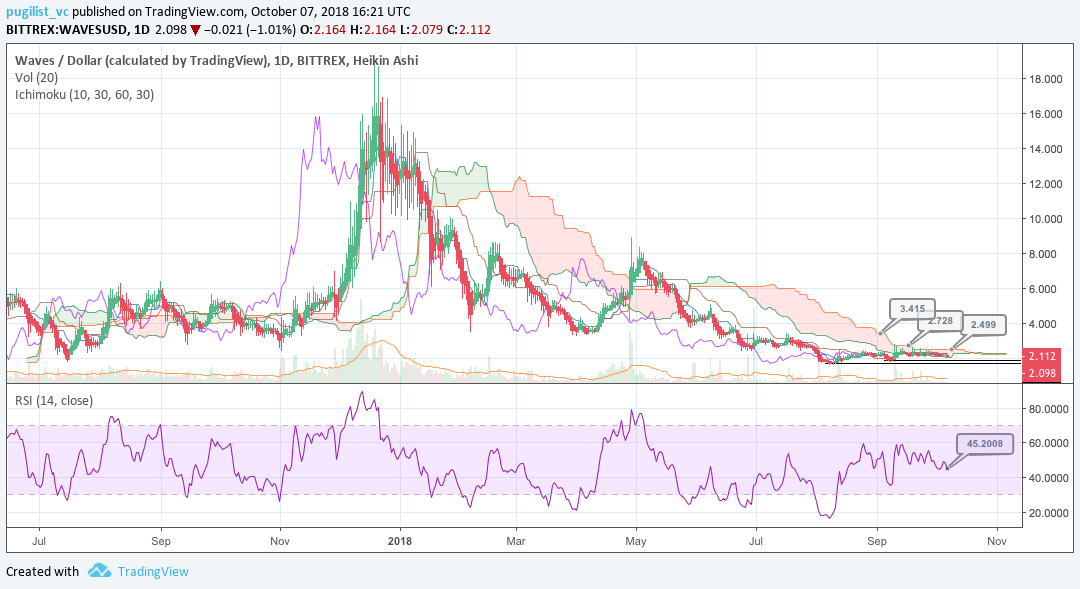
Ichimoku Clouds with Relative Strength Index (RSI)
The Ichimoku Cloud uses four metrics to determine if a trend exists; the current price in relation to the Cloud, the color of the Cloud (red for bearish, green for bullish), the Tenkan (T) and Kijun (K) cross, Lagging Span (Chikou), and Senkou Span (A & B).
The status of the current Cloud metrics on the 1 day time frame with singled settings (10/30/60/30) for quicker signals is mixed; price is in the Cloud, Cloud is bearish, the TK cross is bearish, and the Lagging Span is below the Cloud and above price.
A traditional long entry would occur with a price break above the Cloud, known as a Kumo breakout, with price holding above the Cloud. From there, the trader would use either the Tenkan, Kijun, or Senkou A as their trailing stop.
WAVES is currently sitting at $2.10 and attempting a Kumo breakout, but currently stuck in the Cloud. The RSI has recently dipped downward and currently sits at 45. If a positive catalyst can occur, price has the ability to complete a Kumo breakout; especially given RSI is not near overbought territory of 70 and volatility compression (awaiting a breakout direction). The support levels for price are $2, $1.85, and $1.70, while price targets for a successful Kumo breakout (breaking above $2.50) are $2.72 and $3.41.
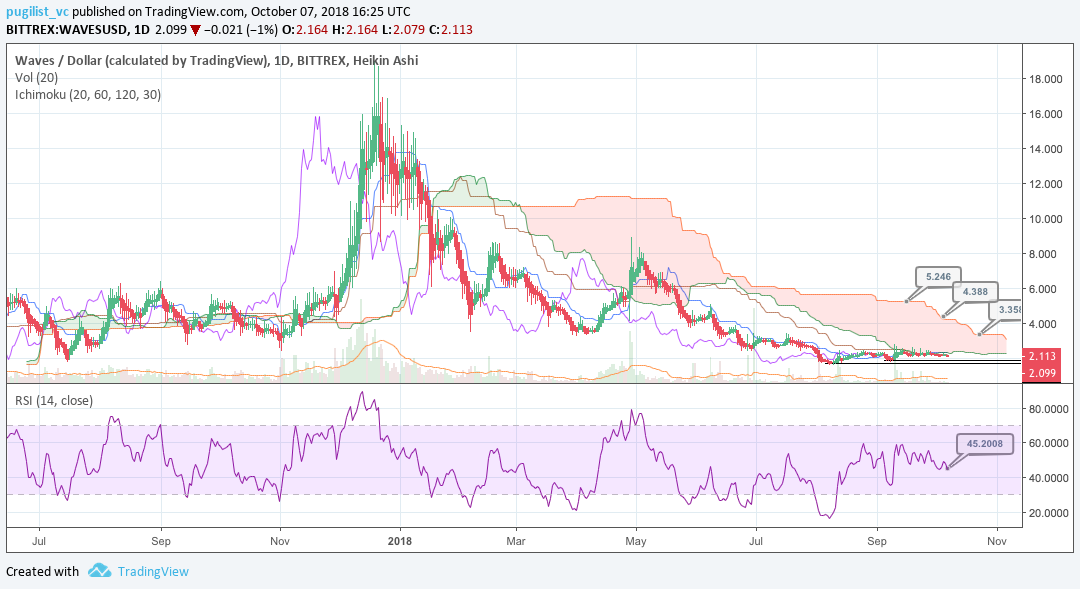
The status of the current Cloud metrics on the 1 day time frame with doubled settings (20/60/120/30) for more accurate signals is mixed; price is below the Cloud, Cloud is bearish, the TK cross is bullish, and the Lagging Span is below the Cloud and above price.
As mentioned, WAVES is currently sitting at $2.10 and attempting a Kumo breakout. Using the slower Ichimoku settings, the probability for Kumo breakout success are much lower than the faster settings. In the unlikely event of a successful Kumo breakout, price will need to breach $3.36 with price targets of $4, $4.39, and $5.24.
Conclusion
As mentioned in the introduction, the WAVES platform and its token are a part of a complex blockchain with a number value propositions.
Fundamental network activity points to the network being undervalued or oversold, and this has provided a useful signal on potential price runs in the past. But there remains a question surrounding the validity of some of this data, given the scale of address fluctuations.
The network also retains the theoretical appeal of its unique consensus method, while the user friendliness of the one-stop-shop WAVES client makes the network highly accessible.
The long term technicals for WAVES are bearish and show few signs of abating when looking at the slow Ichimoku Cloud and linear trend. However, short term volatility compression, coupled with a ‘hopeful’ positive market catalyst may allow for a price reprieve, with price targets between $3.41 and $3.63. However, both, the prudent short term trader (10/30/60/30) and longer term trader (20/60/120/30), on the one day chart, will await a positive TK cross and Kumo breakout above $2.50 and $3.36, respectively, before entering a long position. Both trader’s support levels are $2, $1.85, and $1.70. Additionally, the (10/30/60/30) trader’s price targets are $2.72 and $3.41, and the (20/60/120/30) price targets are $4, $4.39, and $5.24.
 Brave New Coin reaches 1M+ engaged crypto enthusiasts a month through our website, podcast, newsletters, and YouTube. Get your brand in front of key decision-makers and early adopters in 2026. Limited slots remaining! Find out more today!


