BAT price analysis – aftermath of the Coinbase effect

![]()
The Basic Attention Token (BAT) has seen a sharp reversal in fortunes after strong trading on the back of its Coinbase listing. With the furor over, attention should now turn to the token’s value and use-cases as the in-app currency of the recently upgraded Brave web browser.
The Basic Attention Token (BAT) is an ERC-20 utility token that acts the in-app, native payment medium of the Brave web browser.
As the name suggests, it is awarded to users for providing attention – primarily by viewing advertising. Advertisers can also use BAT to purchase targeted ad space, while publishers earn based on how well their ads capturing user attention. The model is based on the simple idea that inefficiencies decrease as stakeholders earn more revenue, thereby incentives in the ecosystem will naturally align.
The Coinbase effect
BAT re-emerged in the collective crypto consciousness recently primarily thanks to speculative assessments surrounding its upcoming launch on crypto blue chip ‘king maker’ Coinbase, with issuance on the platform meaning access to a wider net of retail and institutional liquidity.
Additionally, the exhaustive and selective nature of the Coinbase token listing process, means it acts as something of a golden ticket for any asset able to join this exclusive club. Thus, in the month leading up its listing the BAT price rose by approximately 133%, from ~$0.16 to trading at over $0.37 pre-launch on November 8th.
This price momentum was short lived, however, as once BAT was listed markets were quick to make the assessment that its short term event-based speculative momentum had ended (with the given event occurring) and dumping ensued.
What followed was a reversal in BAT prices back towards pre-pump levels, with price falling close to 33% in the four days following the Coinbase listing.
Another factor for the selling pressure was the news on November 8th that Etherdelta founder Zachary Coburn had been charged by the SEC for operating an ‘unregistered securities exchange’, because it was trading security-like ERC20 tokens. The Etherdelta action once again highlighted that the SEC sees the following three factors as significant in determining whether an asset is a ‘security’ or not.
- Limited real-world ‘utility’ for a token
- A lack of true decentralization and/or the existence of an overarching organization directing the future value of the ecosystem
- Initial funds being raised via an ICO
Given these characteristics all apply to BAT it is likely to be viewed by the SEC as a security.
This added regulatory risk almost certainly contributed to the initial post Coinbase listing selling pressure, and exaggerated the price dip.
This downward momentum intensified with recent market wide sell-offs, potentially driven by factors such as ecosystem uncertainty created by the upcoming Bitcoin Cash hardfork and the deleveraging of crypto positions by institutional funds.
Whatever the reason, selling contagion has spread to BAT trading markets with pricing fall an additional ~27% from November 14th. The token currently trades at ~$0.18.
Brave browser updates
On the 25th of September Brave launched the Beta version of Brave browser — significantly upgrading the UI/UX, adding a raft of new developer features, and building layers on top of the browser’s privacy features that now include a TOR enabled privacy mode plus new ads/extension blocking capabilities.
The new browser also features a straightforward rewards interface, which almost instantly creates a digital wallet for users and allows for transactions to be made using BAT tokens without a 3rd party.
However, indicative of the project’s infant nature users cannot yet earn tokens through viewing ads, the project’s primary value proposition, on this version of Brave 1.0. Tokens at this stage can only be accumulated on exchanges or through giveaways.
Machine learning algorithms for this aspect of the platform are currently being developed.
Based on a recent AMAs, data from beta users is being collected and the final incentive reward model is being tweaked. Nonetheless, there remains no set date for when rewards for users viewing ads will be launched across the platform.
At this stage, the Brave browse can support BAT transactions to be used for allocating contributions to websites and content creators. There is both an automatic option, which allocates BAT based on a users most frequently visited pages, and an individual tipping option where users pick websites to contribute BAT towards.

A blog post in July from the team behind Brave indicated that the Brave Browser application had reached a top 10 position for Free communication Apps on the Google Play store (USA). It is currently ranked 71st in the same category. Despite 10 million+ downloads of the browser on Google Play, this number is still dwarfed by Google Chrome, Mozilla Firefox, and UC privacy browser downloads, which have +1 Billion, +100 million and +100 million downloads respectively.
Exchanges and trading pairs

The most popular trading pair option for BAT is BTC — making up close to 60% of daily trading volumes, worth over $8 million. Next are the BAT/XRP and BAT/ETH pairs which together make up over 20% of BAT trading market. The most popular fiat pair is the BAT/KRW option with volume mainly driven by the Upbit exchange.
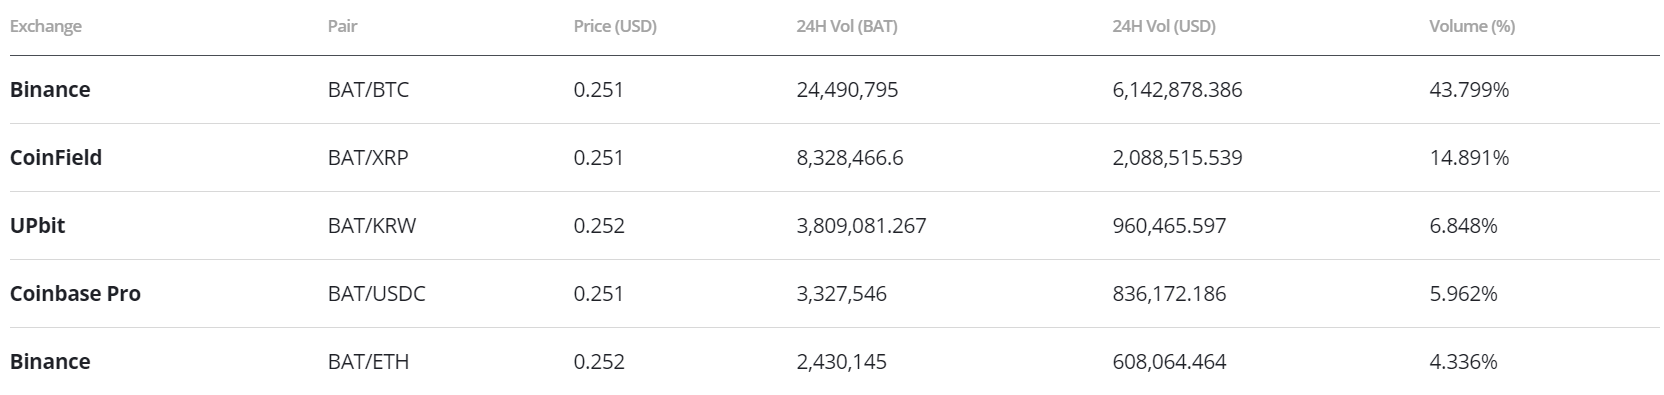
The most popular exchange by trading pair is Binance, offering the market a liquid, accessible on-ramp for BAT. The Coinbase Pro BAT/USDC pair has been immediately popular following its launch on November 3rd. It is by some distance the market’s most favoured stablecoin option for BAT, despite DAI and USDT options also being available. Apart from the USDC option, Coinbase Pro does not offer any other crypto pairs for BAT, and is likely trying to build popularity for its newly launched stablecoin.
Onchain assessments
**Exchange vs Onchain volume **

Figure 1: Historical daily exchange volume vs onchain volume, US dollar terms
For perceived utility tokens, the differences between exchange and onchain volume can be telling. High volume on exchanges vs Onchain for tokens like BAT is generally indicative of speculative traders looking to make bets on price movements, with no real interest in participating in the token’s utility.
While most exchange-using BAT buyers are more likely to swap in-and-out between crypto pairs, in some cases they will use exchanges as a BAT onramp and then move their tokens onto a within ecosystem wallet, converting from speculator to network participant.
As evidenced by Figure 1, there is a close correlation between exchange volume and onchain volume, and this is likely driven by large exchanges moving tokens (over the Ethereum blockchain, recorded as onchain volume) between wallets to meet customer demand for trading.

__Figure 2: Address of the second largest BAT Ethereum wallet (largest is the BAT treasury). Owned by mega exchange Binance, it shows a large number of inflows over the last month, likely to satisfy user demand for BAT trading liquidity. __
Unsurprisingly, recent erratic price movements of BAT have coincided with an uptick in exchange volume that far exceeds onchain volume. It appears that many recent buyers of BAT were not interested in actually using the token for within ecosystem transactions, and were happy to move their tokens around off-chain over centralized exchanges.
It is hoped that some of the recent purchasing of BAT from mainstream exchanges like Coinbase Pro, will eventually be converted into genuine utility based on onchain activity as buyers decide to experiment with their newly acquired tokens and contribute to websites and content creators. The recently upgraded payment features of the Brave browser should support this sort of conversion effect.
Network momentum
Network momentum is a Blockchain indicator metric conceived by analyst Positivecrypto. Indicated by the red line on figure 3, It assesses onchain volume as an indicator for future price movements. Where it differentiates from NVT signal is that the daily volume of token transactions, rather USD value of onchain transaction volume, is used for assessments.
The simple intuitive idea is that rising rate of onchain volume (in token terms not USD terms) is signal for growing ‘momentum’ within the network, vice versa for falling on chain volume in token terms.

Figure 3: BAT (daily) network momentum and price
BAT network momentum has trended upwards over the last month but at the same time has fluctuated wildly. The rising momentum may be something of a false flag, however, and whether this upward trend will be sustained in the weeks following the Coinbase listing is uncertain.
With price sliding quickly and Coinbase speculation over, the BAT token will have to find a new external factor to build buzz and network momentum.
NVT signal
The NVT signal, a responsive blockchain valuation metric, developed & tested by Willy Woo and Dmitriy Kalichkin was derived from the NVT ratio. With NVT signal, the simplified framework that crypto markets are prone to bubbles of speculative purchasing, not backed up by underlying network performance and activity, and the NVT signal gives off a signal for what stage of the price cycle a token may be in.
A high NVT signal is indicative of a network that is going through one of these bubble periods, and may move towards a position of becoming overbought/overvalued, because of the market’s speculative assessments running out of steam.

Figure 4: BAT historical NVT signal data. (NVT signal = Market Cap/onchain transaction volume, smoothed with 30 day MA, Overbought range >~200, Oversold range <~43, Mean : 57)
Currently, based on NVT signal indications BAT is likely oversold, sitting at ~30 and well below the historically assessed level of ~43.
In the recent past sharp reversals in BAT NVT signal as it has hit an oversold inflection, have not had much of an effect in driving price upwards, and have simply slowed downward price momentum (indicated by blue circle on figure 4).
This may mean that the positive fundamental pressure indicated by BAT’s low NVT signal may only dampen the recent selling pressure of BAT, rather than lead to any significant price reversal.
Price to Metcalfe Ratio
Metcalfe’s law is a measure of connections in a network, as established by Robert Metcalfe the founder of Ethernet. It has subsequently been used to analyze the true value of network-based financial products like Facebook and Bitcoin, and by comparing it to price, can provide a useful tool to assess whether a token is over or undervalued.
It is also a more straightforward metric to implement versus onchain transaction volume, which can be challenging to measure accurately in USD terms. Addresses are measured as the number of unique sending and receiving addresses participating in transactions daily.
This makes it a relatively transparent metric as compared to onchain volume. However, there may be a question of the granularity of the data, and who controls these addresses.

Figure 5. BAT Kalichkin’s PMR or Price to Metcalfe, natural log of token value/Metcalfe Ratio. Meltcalfe Ratio = active addresses squared, Overbought >~7.6, Oversold<~5.7, Mean: ~6.4
Similar to NVT signal, the PMR for BAT is approaching/crossing into oversold level. This may be signal that the current downward price momentum will not last for very long, and upward price momentum generated by fundamental support from active address will soon kick in.
Recent active address growth has likely been driven by new users buying and selling BAT in anticipation of the Coinbase listing, although some of it may have been triggered by increased usage of the BAT token following the recent Brave release. Backers of the token would hope that recently generated active addresses continue to make transactions despite the selling pressure of the listing event occurring.
Technical analysis
Exponential Moving Averages (EMA) with Long Term Trends
On the 1D chart, the bullish EMA cross, or Golden Cross, has not occurred in 2018, but has narrowed in recent weeks after a momentary price boost from the Coinbase listing. In 2018, despite periodic help from Coinbase affiliated sentiment increases, price has remained confined within a negative linear price trend with a Pearson’s R Correlation between time and price of 0.62. At time of writing, price is mean reverting after the price increase following the Coinbase listing, with a potential fall back towards $0.16 on the table.

The volume flow indicator (VFI) momentarily breached 0 after the Coinbase listing, but has since retrenched, and currently sits at 0. BAT will need to hold above 0 if it wants to maintain its positive price momentum. The VFI interpretation is: a value above 0 is bullish and below 0 is bearish, with divergences between price and oscillator being high probability signals.

Ichimoku Clouds with RSI
The Ichimoku Cloud uses four metrics to determine if a trend exists; the current price in relation to the Cloud, the color of the Cloud (red for bearish, green for bullish), the Tenkan (T) and Kijun (K) cross, Lagging Span (Chikou), and Senkou Span (A & B).
The status of the current Cloud metrics on the 1D frame with singled settings (10/30/60/30) for quicker signals is mixed; price is above the Cloud, Cloud is bullish, the TK cross is bearish, and the Lagging Span is above the Cloud and touching price.
A traditional long entry would occur with a price break above the Cloud, known as a Kumo breakout, with price holding above the Cloud. From there, the trader would use either the Tenkan, Kijun, or Senkou A as their trailing stop.
BAT is currently sitting at ~$0.22 after successfully completing a Kumo breakout, post-Coinbase listing announcement. Post-Kumo breakout, price has capitulated from a peak of $0.38 to $0.22, but still remains above the Cloud. Despite the dramatic decline, price remains above the Cloud support level between $0.18 – $0.21. Additionally, RSI is approaching oversold territory, which may help the fledgling Kumo breakout hold. The support levels are $0.21, $0.18, $0.14, while price targets for a continued Kumo breakout are $0.27, $0.30, and $0.34.

The status of the current Cloud metrics on the daily time frame with doubled settings (20/60/120/30) for more accurate signals is bearish; price is in the Cloud, Cloud is bearish, TK cross is bullish, and the Lagging Span is beneath the Cloud and touching price.
On the slower settings, BAT briefly completed a Kumo breakout, but has since fallen back inside the Cloud and currently sits at Cloud support of $0.22. Also, price is approaching an oversold RSI level, which may enable price to persist within the Cloud for the near term. Price will need to re-break above $0.28 to re-ignite a new Kumo breakout with price targets of $0.34, $0.38, and $0.40.

Conclusion
Following the up and down price activity and heavy trading volumes driven by speculative trading activity surrounding a Coinbase listing event, BAT token markets are likely to level off both in price and volume terms.
Conversation around the token’s value is likely to return to discussions of its utility and capabilities as a fluid in-app currency within the Brave web browser.
The new Coinbase pro markets for BAT/USDC appear to be popular and well used, and seem to have had the intended effect of creating a new driver of liquidity and users to the BAT ecosystem.
What matters now is the conversion of those initial speculators into active users of BAT within the Brave browser. While utility of the token is limited, signs are encouraging with wallet creation and attention contribution being seamless. BAT retains its strong Venture Capital style value proposition.
The technicals for BAT are mixed with price currently mean reverting lower and Ichimoku settings showing a glimmer of hope for a continued price breakout. The prudent short term trader (10/30/60/30) will await price to hold the Cloud support levels between $0.18 to $0.21, preferably coinciding with the RSI being overbought. The longer term trader (20/60/120/30) will await a positive TK cross and Kumo breakout above $0.28 before entering a long position. The support levels for both traders are $0.21, $0.18, $0.14, while short term price targets are $0.27, $0.30, and $0.34, and long term price targets are $0.34, $0.38, and $0.40.
 Brave New Coin reaches 1M+ engaged crypto enthusiasts a month through our website, podcast, newsletters, and YouTube. Get your brand in front of key decision-makers and early adopters in 2026. Limited slots remaining! Find out more today!


