Is Bitcoin Under or Overvalued? What Fundamental Analysis Tells Us

![]()
Bitcoin investors face an uncertain future following the announcement of a Bitcoin strategic reserve and other pro-crypto events driven by the new Trump administration. While sentiment is a major driver of short term Bitcoin pricing, fundamental analysis can offer insights into longer term outlooks. Here we profile the best tools to determine if Bitcoin is under or overvalued.
Bitcoin (BTC) is a revolution within modern investing, with a set of characteristics distinct from traditional assets. As we venture into valuing Bitcoin we find ourselves in a landscape where the conventional tools of financial analysis encounter uncharted territory. This article delves into the heart of this new frontier, exploring the fundamental analysis of Bitcoin price, a digital asset that defies traditional valuation methodologies.
We aim to determine whether Bitcoin is over or undervalued, using fundamental analysis valuation techniques. It is a particularly pertinent question today, as Bitcoin investors face an uncertain future in a heavily sentiment driven market.
Fundamentally Analyzing Bitcoin
The goal of fundamental analysis (FA) investment research is to ascertain an asset’s true or inherent value. Intrinsic value is calculated without taking into account an asset’s market value or speculative considerations. Instead, analysts employ different types of modeling tools that focus on factors other than market pricing to arrive at an intrinsic value. Fundamental analysis tries to answer the simple question of “what is an asset really worth?”
Fundamental analysis looks at both internal and external factors that may impact a company or product’s value. New changes to a company’s flagship product or the health of the global economy, for example, can have an impact on an investment’s value. Importantly, these elements may have an impact on an asset’s intrinsic worth before they have an impact on its market value.
Using fundamental research, investors can be alerted to purchase assets when they are undervalued and similarly, sell them when their intrinsic value exceeds their market price (overvalued).
The investment philosophy at play is that assets will inevitably move towards a fair market value. This means that there may be a trading opportunity if the fundamental analysis shows that an asset’s intrinsic worth differs from its market value. In this report we explore 5 key fundamental indicators and whether they suggest Bitcoin is currently over or undervalued.
Fundamental analysis of Bitcoin is not straightforward
Fundamental analysis has been used for decades in the traditional share market, but the challenges of using fundamental analysis for cryptographic assets are distinct. Due to the cryptographic asset class’s numerous distinctive qualities, it cannot be evaluated using the same framework as conventional enterprises or commodities. As detailed in this article, tools do exist, but given the nascent nature of the sector, each of them has its proponents and detractors. For potential investors, this offers both an opportunity and a challenge.
The various crypto assets have a wide range of uses and a useful reference overview is provided by Brave New Coin’s General Taxonomy Of Cryptographic Assets. Since Bitcoin (BTC) assets don’t produce cash flows, it is difficult to evaluate them using typical stock investment indicators, such as future cash flow.
Some protocol tokens may be evaluated using a modified version of a conventional fundamental analysis model such as Discounted Cash Flow (DCF), which provides holders and token stakers a percentage of platform revenue. A DCF model might be used to evaluate a token like the LOOKS token, for example, which gives token holders 100 percent of the trading fees on the LooksRare trading platform.
Bitcoin is not unique in that its intrinsic value cannot be determined based on its cash flows. Hard assets, such as Gold and Silver, are comparable, and this class of assets needs to be evaluated depending on where the asset’s price may be headed in the future. The availability of the asset – and the demand for it – will determine this.
Although none are perfect, several rational and straightforward models have been developed to predict changes in Bitcoin’s intrinsic value. They have all been used to give helpful signals to traders who lean towards a fundamental approach to investing.
Bitcoin’s Supply-based value indicators
The circulating supply of BTC can be determined quite easily. The predetermined, finite, and fixed monetary policy of the network means future supply is also clearly defined. This means assessing the intrinsic value of the Bitcoin network though its supply is an appealing option.
1. Stock-to-flow
One of Bitcoin’s most popular valuation models, stock-to-flow (S2F), is focused almost exclusively on supply metrics. Stock-to-flow is a measure of how much new supply of an asset is being created over time (flow), relative to the existing supply (stock).
It measures how many years, at the current production rate, for production to achieve the current stock of an asset. The higher this number is, the higher the expected price. For instance, a commodity where the current stock takes 100 years to produce, S2F suggests, is more valuable than a commodity where the current stock only takes 20 years to produce.
The more difficult it is to produce a commodity and the less of it there is, the more inherently scarce it becomes and the more its assumed value rises. Stock-to-flow was around before Bitcoin. It was a model used to determine the intrinsic value of mined hard assets like gold and silver.
The stock-to-flow model only works for Bitcoin because of its scarcity. Bitcoin’s scarcity means it has value as money. Computer scientist Nick Szabo says scarcity creates “unforgeable costliness” and this in itself, creates intrinsic value for an asset. It should mean that as the supply of Bitcoin tightens and becomes more scarce, then it becomes more valuable.
Bitcoin cannot be copied, duplicated, pirated, or forged. Bitcoin comes packaged in blocks of ~500 transactions that contain all the necessary information required to secure the network.
Blocks are 1MB and are generated roughly every 10 minutes. The Bitcoin network has been generating blocks uninterrupted since its inception. When the network was first launched on the 3rd of January 2009, as a reward for validating transactions and publishing blocks to the Bitcoin ledger, miners earned 50 Bitcoins (BTC). This 50 BTC is freshly minted supply. New Bitcoin will continue to be minted until a pre-determined final supply of 21 million is reached.
Bitcoin was built with a pre-planned deflationary monetary policy. Every 210,000 blocks a halving occurs. The halving cuts the miner’s Bitcoin reward in half, reducing the rate at which new BTC supply is issued.
The halving events will keep occurring until no new BTC is issued to miners. Bitcoin can be fractioned to a maximum of 8 decimals, so miner rewards can reduce to 0 BTC. This should be around the 33rd halving in the year 2140 when the 21 millionth BTC will come into existence and the final total supply will be reached.
Bitcoin’s position as a verifiable scarce asset, with some demand, means that as it becomes more difficult to acquire with each new halving, its value increases. This deflationary mechanism has significant implications for BTC’s stock-to-flow model, given the ‘flow’ or production rate of the asset halves every 4 years.
The conceptualizer of the Bitcoin for stock-to-flow model, a pseudonymous analyst who goes by PlanB, has stated in the past that his model may not work for other proof-of-work altcoins like Litecoin because they do not have the same ‘unforgeable costliness’ that Bitcoin does.
How To Calculate Bitcoin Stock-to-flow
S/F=Stock/Flow
The stock-to-flow of an asset is equal to the total current available stock of an asset divided by the yearly production. As of March 8th 2025 there are presently around ~19,830,000 BTC in existence as circulating supply, and about 164,250 new bitcoins are created each year. There may be some debate about the exact value of circulating supply given factors such as lost Bitcoin, or coins that have never moved from Satoshi’s wallet, but because of the uncertainty surrounding these factors, we internalize their impact on circulating supply.
19,600,000 \ 164,250= 119.3
This means that it would take around 119 years of current BTC production to produce the current stock of Bitcoin. What is important to remember with BTC, is that up until the last halving, 900 new BTC was produced each day and 328500 per year. It had a significantly lower stock-to-flow number before the last halving in March 2024 and was theoretically less valuable than it is now based on stock-to-flow logic.
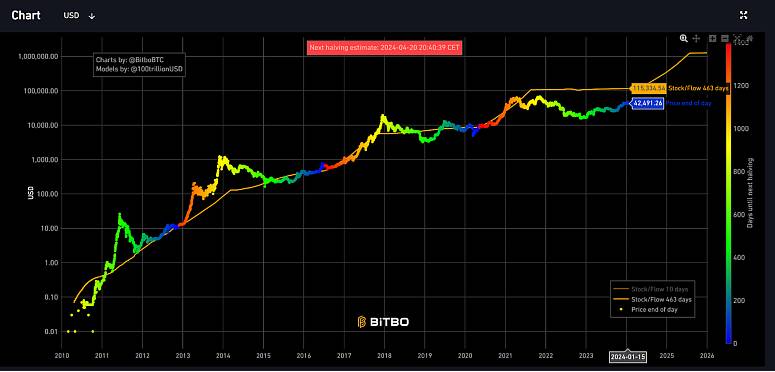
The above chart displays how Bitcoin’s dynamic S2F drives up the intrinsic value of Bitcoin over time. Every four years as indicated by the vertical dotted red line, the emission rate of Bitcoin halves. The total stock of Bitcoin is fixed but because the production of BTC slows every 4 years, its scarcity, potential purchasing power, and intrinsic value grows. Based on a 463 day variation, the stock-to-flow model has the current intrinsic value of BTC at ~US$117,219. This is well above the current US$ value of BTC — ~US$80,606.
This suggests that BTC is undervalued and offers a possible buy proposition at its current price. Interestingly, the S2F model of Bitcoin predicts that after the next two halvings, by which Bitcoin’s production rate would have quartered, the intrinsic value of BTC will be above ~US$508,000.
Valuing Bitcoin Based on Demand
Supply-based valuation models are imperfect because they don’t consider the demand. This is perhaps a larger determinant of price and value.
What drives the demand for Bitcoin?
Bitcoin was originally designed to be a digital cash alternative that acted as a decentralized alternative to central bank-controlled fiat money. It can and has been used as a fiat money alternative.
Bitcoin does not need the backing of a government or a banking system to function. It is operated by a decentralized network of independent nodes that coordinate, but do not collude, to manage the network. The network is trustless, it does not need a monetary authority like a central bank to act as a counterparty to risk and be a lender of last resort if its ecosystem fails.
It is also borderless and almost impossible to counterfeit. Bitcoin may be counterfeited through a double-spend attack but the likelihood of an attack like this being successful is extremely low.
2. Network Value to Transactions Ratio (NVT)
A key indicator for evaluating the correlation between market cap and transfer volume is the Network Value to Transactions (NVT) ratio. Numerous commentators, including Willy Woo, the model’s developer, compare NVT to the price-to-earnings (PE) model, which is used to determine the worth of company stocks in conventional markets.
NVT is one of the earliest developed on-chain valuation models and brings together the utility of Bitcoin and its value. Bitcoin was primarily built to be a network that enables payment and settlements. This is its characteristic that should drive intrinsic value outside of speculation. On-chain transaction volume (value of transactions and not the number of transactions) measures how much Bitcoin is being used as a settlement layer for payments by whales or everyday users in developing countries.
When combined with market cap, it offers a useful tool to determine whether there may be an active divergence between the intrinsic value and market value of BTC.
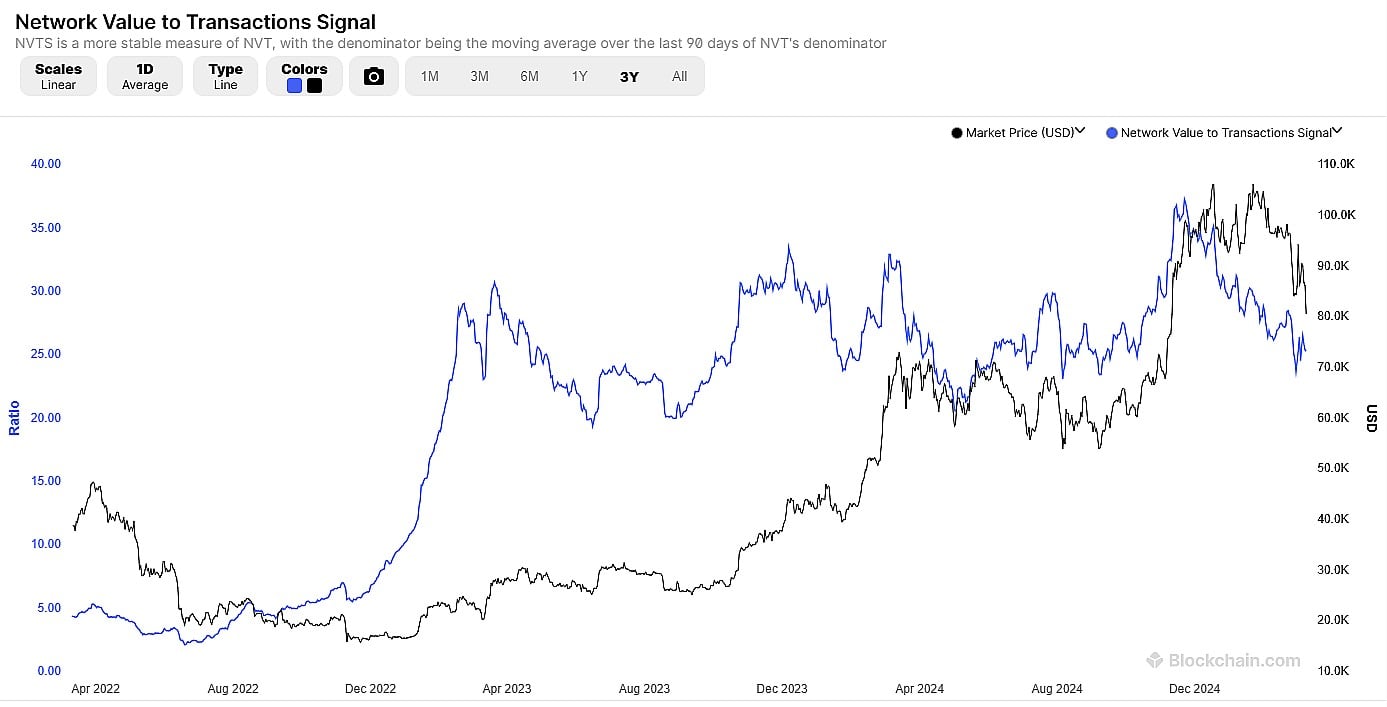
The above chart compares the Bitcoin NVT signal, a modified version of NVT, with its price. The NVT signal is calculated as:
NVTS = Network Value/90 day MA of daily transaction
Where market cap is used as a proxy for market value and MA means moving average. The usage of moving averages helps to create a smooth line that adjusts for very short-term jumps in transaction activity.
There is a basic assumption when reading NVTS is that If the market cap rises faster than transaction volume, the network might be overvalued, signaling a potential price correction. If transaction volume increases while market cap remains stable or lags, the asset may be undervalued, suggesting a potential price increase.
Historically BTC’s NVTS has between 40-20 points. When the price is closer to this upper bounds it is generally a sign that the market cap is rising too quickly in comparison to network activity and that a price reversal is incoming. When it is at the lower end of this range it suggests that the opposite is true, Bitcoin is undervalued in comparison to its network activity and an upward reversal may be incoming.
The price of BTC has slid in recent months but currently, the NVTS signal is not currently near its lower value suggesting that Bitcoin is ‘fairly’ valued and may not be set for a price reversal soon.
3. Thermocap Multiple
Thermocap is an indirect metric that measures the intrinsic value of Bitcoin based on how much miners are being paid. The model has been developed by an anonymous analyst named GeertJanCap.
The metric measures the implied value paid to Bitcoin miners who are in charge of validating transactions and securing the network. Miners are the workhorses of the network and the thermocap measures how much they earn for their services, they are the entrepreneurs of Bitcoin. Price and market cap measure the investor side of Bitcoin—the investors, savers, and speculators. Thermocap may be considered equivalent to a fundamental metric used in traditional finance valuations— Enterprise value-to-earnings Before Interest, Taxes, Depreciation, and Amortization, or EV-to-EBITDA.
The thermocap of Bitcoin is calculated by taking the miner reward and transaction for each block and multiplying it by the BTC price at the time the new Bitcoin was minted.
The thermocap multiple used in the chart below is a slight variation of this calculation that takes the Bitcoin price on a given day and divides it by the total historical block subsidy.
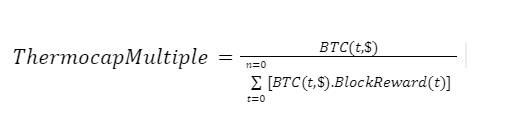
The total historical block subsidy is calculated by taking the number of Bitcoins mined each day and multiplying them by the end-of-day price on that day. The final value is then calculated by adding together the daily subsidies for every previous day before the present day.
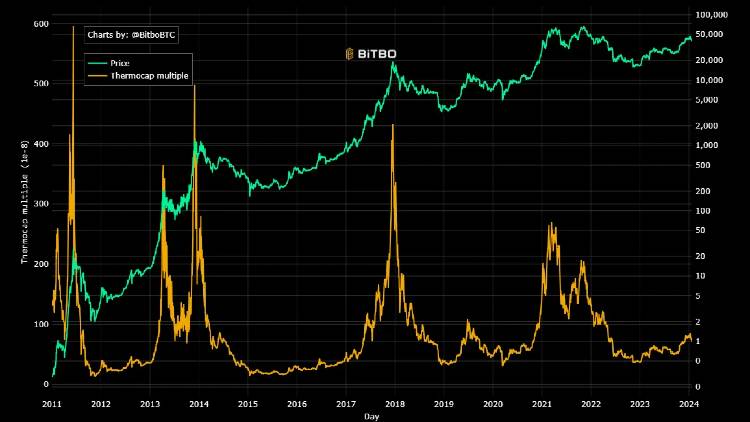
There are some interesting things the thermocap multiple can tell us about the price. When it is high and blowing off it likely means that miners are being paid too much, users are perhaps overvaluing their services, and a pullback of both intrinsic and market value is intuitively set to occur. A low thermocap suggests that miners are being paid too little and a mean reversion is set to occur.
Currently, the Thermocap appears to be middling sitting around the 120 level, near its lower end, and well below the heights between 200-and-500 it has hit in the past. This suggests that there is more room to pay miners in the form of more expensive BTC.
4. Market Cap/Realized Cap (MVRV)
We can also measure a fair value for Bitcoin based on investor behavior using metrics like Market Cap/Realized Cap (MVRV). These metrics view Bitcoin as an asset that is likely to be sold cyclicly and that size of profit, more than utility, determines whether BTC is bought or sold.
The MVRV was developed by analysts Murad Mahmudov and David Puell, and soon after Realized Cap was developed by Nic Carter and Antoine Le Calvez of the Coinmetrics team. Market Cap in the context of the cryptocurrency space is the total number of coins that have been mined or are in circulation multiplied by the price of a single coin.
Realized Cap is a variation of Market Cap, instead of multiplying every coin by the current market price of BTC, it multiplies each coin based on the price it last moved. Accurately knowing the price of a coin when it last moved is possible because of Bitcoin’s UTXO technology.
The realized cap is a more accurate reflection of the network’s value than market cap because it reduces the impact of lost or dormant coins. If coins are moved more recently at a price higher or lower than when it was last moved then this change in the value of the realized cap.
Given that realized cap is the price of coins when they last moved, it is often considered a useful proxy for value stored on the network. When Realized Cap is combined with other metrics like Market Cap it can be an indicator to determine whether BTC is over or underpriced. If the market value is higher than the value stored on the network then this may signal a selling opportunity. Vice Versa if the stored value of the network is higher than the market value.
MVRV is a tool to indicate the aggregate Bitcoin investor behavior and can be a leading indicator to determine whether investors will sell or buy based on the difference in the current market price from the cost that investors paid for their Bitcoin.
When the MVRV value is very high, this means that the market price of BTC is much higher than what the aggregate investor has paid for it. This suggests that in the near future, a sell-off may be coming as investors look to realize profits. Vice versa when MVRV is low, investors are likely hoping to hold and wait for profits.
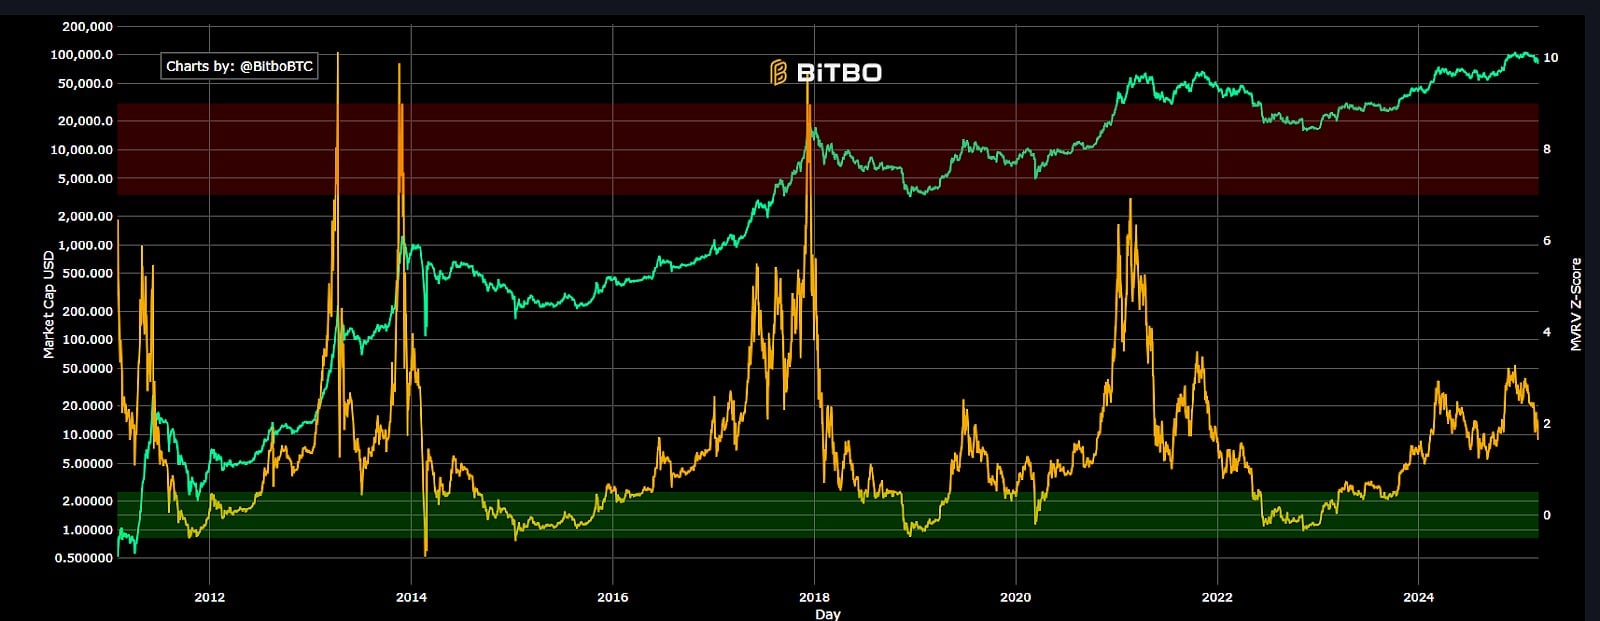
In the past, blow-off tops for the MVRV have preceded price drops of BTC and have been useful tools for identifying selling opportunities. Likewise, MVRV hitting floors and the trough of downtrends has often worked as a buy signal. It should be noted that the tops of MVRV tend to be much more extreme than the bottoms.
Like many other indicators mentioned in the article, the signal being sent by the MVRV is neither bullish nor bearish. It is middling, in between the ‘buy’ and ‘sell’ zones indicated in green and red. This suggests that there is room for the price of Bitcoin to drop or fall.
5. Mayer Multiple
Bitcoin pioneer Trace Mayer, developed the straightforward Mayer Multiple indicator for which the 200-day moving average is used to compare the current Bitcoin price to a long-term historical price range for BTC. The Mayer Multiple, like many other indicators, reveals Bitcoin as being potentially under or oversold in the context of longer time frames.
An indicator called a moving average (MA) averages out the value of any quantity over a predetermined amount of time. The “moving” aspect of the average refers to how frequently it is updated depending on fresh pricing information received. Any time period can be used to calculate a moving average. Historically, the 200-day MA has been a well-liked time frame in crypto for identifying the bull and bear cycles in the market.
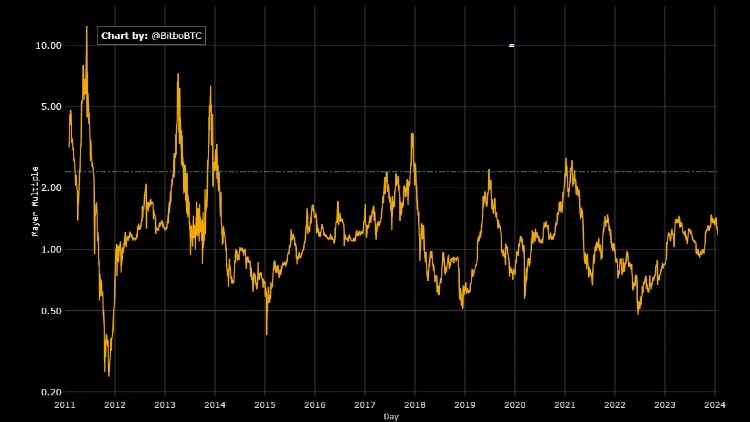
The Mayer multiple is calculated by dividing the current price of BTC by the average price of BTC over the last 200 days. Historically, a cycle bottom is strongly indicated by the Mayer multiple dipping below or very near 0.5. A cycle top is indicated by a Mayer Multiple value of 2.3. Currently, the Mayer Multiple sits at 0.99 and is trending downwards. This is another middling value suggesting that the price of BTC has more room to go down in the short term.
Conclusion
As we conclude our exploration into the fundamental analysis of Bitcoin, it becomes evident that this digital asset demands a nuanced approach, one that accommodates its unique characteristics and the evolving landscape of the cryptocurrency market. The models and indicators we’ve discussed – Stock-to-Flow, Network Value to Transactions Ratio, Thermocap, Market Cap/Realized Cap, and Mayer Multiple – each provide a lens through which we can discern facets of Bitcoin’s intrinsic value. However, they also underscore the complexities and uncertainties inherent in this space.
Investors venturing into this domain must navigate with caution, armed with research, a robust investment strategy, and a keen awareness of the market’s volatility. Ultimately, the fundamental analysis of Bitcoin is not just a quest to ascertain its intrinsic value but also a testament to the innovative spirit that characterizes the ever-evolving landscape of digital assets.
Resources developed such as market analysis tools, trading forums, or crypto media platforms play a crucial role in this journey, providing up-to-date information and in-depth analyses to empower investors to make informed decisions in a rapidly changing environment. However, the selection and synthesis of information are also crucial, offering a comprehensive view which is an important step in the analysis of BTC exchange rates specifically, as well as the cryptocurrency market in general.
Most fundamental indicators send a broadly middling signal, neither bullish nor bearish. The stock-to-flow indicator, however, sends a strong bullish, buy signal suggesting Bitcoin is undervalued. The NVTS, however, sends a bearish signal indicating that Bitcoin is overvalued. The mixed signals make it difficult to develop a bitcoin strategy based on fundamentals. Bitcoin traders may be better off using Technical Analysis (TA) or taking a swing trading approach based on news events. Or, they can choose to invest based on signals from their preferred fundamental indicator.
 Brave New Coin reaches 1M+ engaged crypto enthusiasts a month through our website, podcast, newsletters, and YouTube. Get your brand in front of key decision-makers and early adopters in 2026. Limited slots remaining! Find out more today!


