Bitcoin Price Analysis – Healthy pullback


Bitcoin (BTC) continues to be highly volatile. Having ranged over 30% in the past week, the cryptocurrency was, at one point, down 56% from all time highs. The BTC market cap now stands at US$190 Billion, with just over US$5 Billion traded in the past 24 hours.
Bitcoin (BTC) continues to be highly volatile. Having ranged over 30% in the past week, the cryptocurrency was, at one point, down 56% from all time highs. The BTC market cap now stands at US$190 Billion, with just over US$5 Billion traded in the past 24 hours.
Hash rate and difficulty have increased at a steady pace, almost unabated over the past 12 months, growing more than 6x. The two significant declines of hash rate in August and November 2017 occurred when Bitcoin Cash (BCH) first forked from BTC, and miners began subsequently switching blockchains to profit from the BCH Emergency Difficulty Adjustment (EDA).
While the EDA was included in BCH to soften the abrupt drop in hash rate that the blockchain inevitably experienced after the fork, at least one Bitcoin Cash/Unlimited developer, Peter Rizun, has said that the EDA was designed specifically to disrupt the BTC network. The BTC hash rate has doubled since the BCH EDA was removed in November.
 Both of the BTC hash rate declines caused significant increases in block time, to more than 16 minutes, and fees increased proportionally. This is to be expected as block times increase; more transactions remain unconfirmed (if transactions per day remain static or increase), and prioritizing transactions so that they’re included in the next block becomes more expensive. Over time, the hash rate returned or the BTC difficulty automatically adjusted to the change.
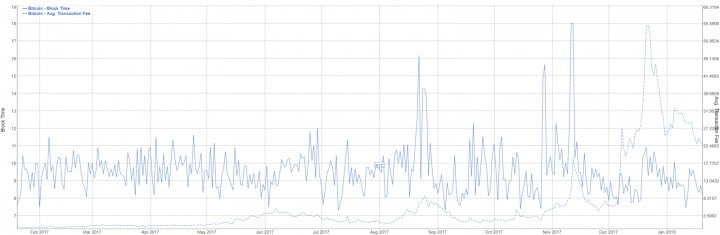 Despite block times holding at or below 10 minutes in December, USD fees increased to levels never seen before on the network. A few different factors led to the astronomical fee increase.
The large amount of no/low fee transactions in August were eventually mined, expired, or were removed from the network. These “spam transactions” recurred in November and were not able to be cleared. This became a compounding problem in December.
As the price of BTC increased quickly, more transactions hit the network. A new record was posted on December 14th, when 490,000 transactions were broadcast across the network. Price then reached record levels on December 17th. Unconfirmed transactions decreased proportionally through the Christmas and New Year’s holidays, but then increased rapidly along with BTC volatility in mid-January.
 Unconfirmed transactions now stand at around 80,000, down from well above 250,000 in late December. The low sat fee/byte transactions remained unconfirmed until they are mined or time out in the network. Most of the high sat fee/byte and high priority transactions are being mined quicker than they are being replaced, so the backlog is decreasing. The current appropriate fee for a guaranteed confirmation within the next 5-10 blocks is around US$5 or less for a typical 250 byte BTC transaction.
 Solutions to the fee problem are directly related to BTC scalability. One solution currently available is Segwit, which alters the transaction slightly and reduces its effective size, making it less expensive than a similar non-SegWit transaction.
Most of the on and off ramping for BTC occurred through Coinbase in November and December, a company which has been criticized for not interacting with the network as efficiently as it could. A test transaction of 0.1BTC from GDAX, an exchange wholly owned by Coinbase, was sent today with a fee of US$7.77 at 277sat/byte, paid by GDAX.
Coinbase does not batch transactions, which would decrease the number of transactions broadcast across the network; nor does it give its users the option of selecting a fee when sending a transaction; and it has yet to enable SegWit, which would effectively reduce the size of each transaction.
Since SegWit was activated in August, the average BTC block size has consistently been just above the previous 1MB ceiling. Block size will continue to increase proportionally with SegWit adoption. Over the past week, several blocks over 2MB were mined for the first time. These block size increases are critical for clearing the current unconfirmed transaction backlog and increasing network capacity long term.
 Another critical protocol development, enabled by SegWit activation, is the Lightning Network (LN). This off-chain scaling solution is a second layer solution that promises low-fee, hub-and-spoke, bidirectional, time-locked payment channels.
The LN will allow for many near-instant off-chain microtransactions which are then settled on-chain at a later date in one large transaction, once development is complete and adoption is widespread. There are just under 100 nodes currently in the nascent network. A major proponent of LN and one of the teams working on development is Blockstream. The company released Lightning Charge this week, a set of developer tools to interact with the network.
 Bitcoin exchange traded volume this week has been led by the US Dollar Tether (USDT), Japanese Yen (JPY), and US Dollar (USD) markets. USDT, which is pegged to the USD, has seen an increase in volume recently as traders seek safe haven from BTC volatility.
The Korean Won (KRW) market volume share has almost tripled since last week, and the large price premium remains. This is likely because stricter KYC/AML policies have yet to be implemented on all of South Korea’s exchanges, which may be handling spillover volume from the now all but defunct Chinese Yen (CNY) market. Currently, the South Korean cryptocurrency exchanges process more trades than the country’s stock market.
 Global Over The Counter (OTC) volume is down from record highs set in December. The only currency to set a new all time high this week, according to the available data, was the Mexican Peso.
 Technical Analysis

After a significant price decline during a bull market, it is important to decide whether or not the trend will continue or has reversed. Trend following indicators like Ichimoku Cloud, Pitchfork, and EMAs can help determine the status of a trend while Candlestick Patterns, Divergences, and Chart Patterns can illuminate near-term bullish reversals.
The current trend began in 2015, signaled by a bullish TK cross and Cloud Edge entry using the Ichimoku Cloud, as well as breaking previous horizontal support turned resistance.
The candle on the weekly chart recently recovered significantly after reaching below the Kijun. Price recently touched the weekly 20 period simple moving average (not shown). These support tests are expected, and occur frequently throughout any given trend. Should the Kijun support level continue to hold, there is a high probability of trend continuation and further all time highs, as has occurred on six occasions since 2016.
 The Relative Strength Index (RSI) is an oscillator measures momentum over time. RSI has held above 50 and continues to do so since the trend began. A break below 50 on the RSI would signify significant weakness in the long standing bull trend. There is also no active bearish divergence on this timeframe, suggesting a continued bearish pullback in the short term.
A candle on the three day chart has printed an inverted hammer, which would confirm a bullish reversal should the next three day candle close green as well. The long upper wick on the candle indicates significant bullish pressure, which was unable to be maintained throughout the session, hence the need for confirmation on the next candle. Reversal candle types also include the Dragonfly, Spinning Top, Shooting Star, and Hanging Man to name a few.
 A Pitchfork on the daily chart, with anchor points in February, May, and July, shows price consolidating below the lowest quartile of the trend (yellow). Extensions of 1.272 and 1.618 added to the Pitchfork, borrowed from Fibonacci extensions, show potential confluence with support zones at these levels.
Buying in the current zone comes with the risk of a bearish invalidation of the Pitchfork, with the upside potential being a return to the median line, followed by a test of the upper limit. A significant break below the lowest diagonal support (red) will invalidate the Pitchfork.
 The Ichimoku Cloud on the daily chart shows price within the Cloud. The Cloud zone itself is referred to as a no trade zone due to the typical trendless nature of the price action that occurs within its boundaries.
A short entry would trigger if the Cloud twists bearish and price closes below the Cloud. The TK cross is currently bearish. A long entry would trigger when the TK recrosses bullish with price above Cloud. This is not likely to occur any time soon. Price will likely continue to range within the boundaries of the Cloud until significant volume pushes price through support or resistance, above or below the Cloud.
A hidden bullish divergence suggests waning bearish momentum as price has not reached a lower low despite increase bearish pressure compared to a previous low. This pattern has occurred three times within the current trend, all leading to bullish continuation.
 It is not unlikely that price also forms a double bottom with a higher low, either an Adam (V) & Eve (U) or Adam (V) & Adam (V). Although double bottom patterns have a near exact second low at a horizontal level, and a declining volume profile, this is not always the case. This inexactness makes the measured move and fib extensions slightly more difficult to predict, but these estimations yield a range of resistance between US$12,800 and US$16,880. The upper limit of the range is within the resistance zone of the previously held range.
 The previous two Cloud support tests in July and September were immediately reversed over the course of a few days (not shown). A Cloud support test in March was also immediately reversed but reversed again after reaching Kijun resistance, reaching for a lower low. This lower low also formed a bullish divergence pattern based on volume, RSI, and Bollinger Bands. The second low occurred on less momentum than the first. This type of bullish reversal confirmation is something to look for should price potentially make a lower low at the current level.
 Signals from the Ichimoku Cloud on the four hour chart are all bearish, except the bullish TK cross. If price closes above Cloud with a bullish Cloud, a long entry signal would occur. Long entry signals such as this have occurred eight times in 2017 and once in 2018. They have resulted in winning trades all but twice. A bearish TK recross with price below Cloud would strongly suggest bearish continuation on this time frame.
 Lastly, during the large decline price once again bounced on the four hour 850EMA. This has occurred on all of the most extreme support tests since the trend began in 2015. A long entry signal would trigger when the 50EMA and 200EMA cross.
 Conclusion

The prevailing narrative and criticism surrounding the Bitcoin network over the past year have been based on elevated transaction fees. Due to the lack of widely available scalability options at the time, along with market events, fees have been at record highs. With most of those issues resolving, and scalability options available, fees have declined significantly, but remain higher than average.
Technicals suggest a high likelihood that price has bottomed at current levels, based on strongly held previous support. There is still the possibility of a double bottom with either higher or lower lows. Trend indicators have not indicated a long re-entry, and will likely not do so on higher time frames until the range of US$11,000-US$13,000 is broken with significant volume.
Further background information on the technical analysis discussed above can be found here.
 Brave New Coin reaches 1M+ engaged crypto enthusiasts a month through our website, podcast, newsletters, and YouTube. Get your brand in front of key decision-makers and early adopters in 2026. Limited slots remaining! Find out more today!


