Bitcoin (BTC) Price Prediction: $74K Liquidity Gap Puts $80K Support to the Test

Bitcoin is facing renewed downside risks as bearish technical signals, a potential liquidity gap near $74,000, and shifting trading activity raise questions about the strength of its recovery.
Meanwhile, data from Glassnode and Fasanara Digital show that traditional financial assets are capturing a growing share of derivatives activity on crypto trading platforms.
The combination puts the Bitcoin price forecast at a critical juncture. With BTC trading near $80,504 in the supplied TradingView snapshot, traders are monitoring nearby support levels while assessing whether capital flows and macroeconomic conditions will support a sustained recovery.
Hyperliquid Data Reveals Capital Rotation Toward Traditional Assets
Bitcoin’s weakness coincides with growing activity in traditional-asset derivatives on crypto platforms. Glassnode and Fasanara Digital’s Q4 2026 report highlights how perpetual futures linked to equities, indices, and commodities have gained ground as crypto trading volumes weakened.
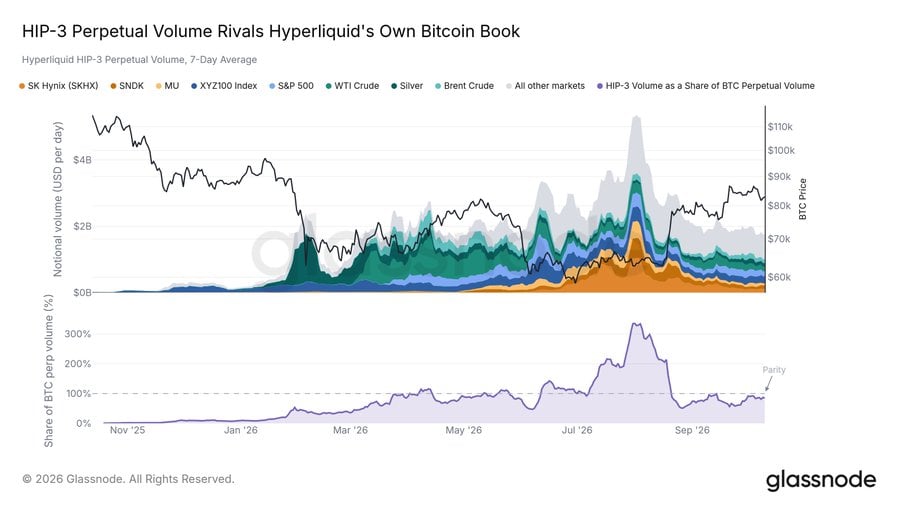
During Bitcoin’s 2026 bear market, Hyperliquid’s TradFi perpetual volume surpassed Bitcoin-native perps by over 3x in August, signaling a shift toward equities. Source: @glassnode via X
Glassnode reported that Hyperliquid’s traditional-finance perpetual volumes exceeded Bitcoin-native perpetual volume by more than three times in August before returning closer to parity by September. The shift suggests traders are increasingly using crypto venues to access traditional markets.
However, derivatives volume measures trading activity, not direct capital transfers. The data therefore points to changing trading preferences but does not independently confirm that investors are selling BTC to buy stocks or commodities.
Brent Crude Above $100 Adds to Bitcoin’s Macro Risks
CryptoQuant has warned that Brent crude prices above $100 per barrel could weigh on Bitcoin by reinforcing inflation concerns and limiting liquidity available for risk assets. Its historical comparison of BTC and oil prices suggests Bitcoin has often struggled when crude sustains an upward trend above its 365-day moving average.
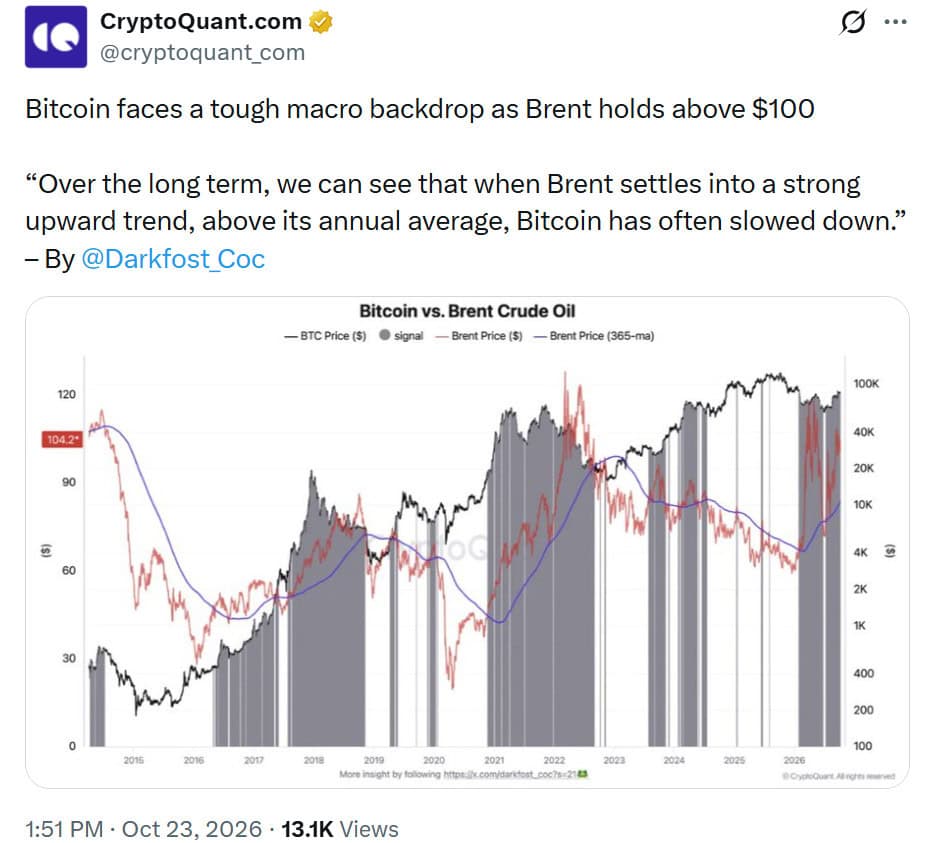
Bitcoin may face further headwinds as Brent crude stays above $100, with historical data linking rising oil prices above their annual average to slower BTC performance. Source: @cryptoquant_com via X
Geopolitical tensions and energy-supply concerns have contributed to elevated oil prices. If these pressures persist, markets may reassess interest-rate expectations and risk exposure. However, the historical relationship does not prove that higher oil prices will necessarily cause BTC to fall.
BTC Price Prediction: Technical Indicators Signal Near-Term Caution
The TradingView snapshot places Bitcoin near $80,504, with an overall Sell rating based on 12 sell signals, nine neutral readings, and five buy signals.
BTC trades below several short- and medium-term moving averages, including the 20-day EMA near $82,087 and the 50-day SMA around $81,813. The RSI at 43 indicates subdued momentum, while negative MACD and Momentum readings reinforce the cautious outlook. The CCI at -128 offers a counter-signal, suggesting a potential short-term recovery.
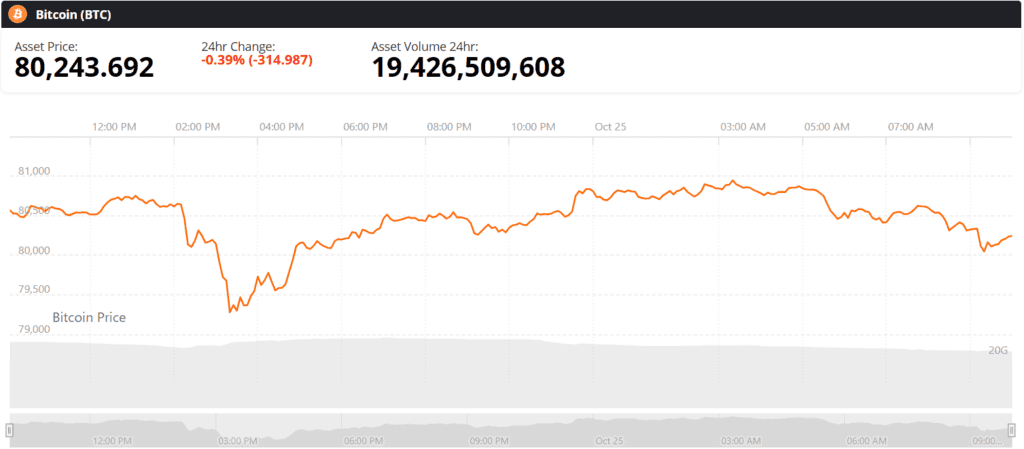
Bitcoin (BTC) price chart. Source: Brave New Coin
The central pivot near $81,950 is the immediate level to watch. A sustained move above it could improve short-term momentum, with Fibonacci resistance near $86,710 and classic resistance around $88,986. On the downside, support between $77,190 and $76,526 could come under pressure before the $74,249 pivot becomes relevant.
Bitcoin Price Forecast: Key Levels to Watch
Bitcoin’s near-term outlook hinges on whether buyers can defend support and reclaim the $82,000 area. Weak momentum, elevated oil prices, and changing derivatives activity add uncertainty, but none independently confirms a deeper correction.
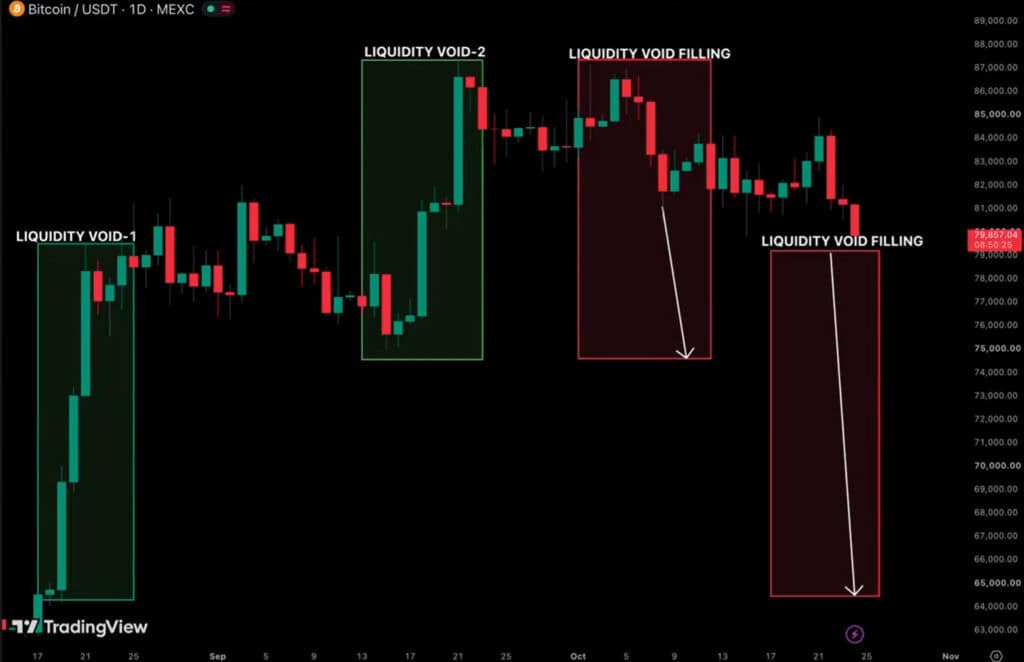
The daily BTC/USDT chart highlights prior liquidity voids in green and a current filling zone targeting $74K in red. Source: @MstrTranquility via X
A decline toward $74,000 remains a possibility rather than a certainty. A sustained recovery above nearby resistance would weaken the bearish case, while a breakdown through successive support levels would strengthen the case for a lower liquidity test. Traders should assess these scenarios against updated price action and confirmed market-flow data.
 Brave New Coin reaches 1M+ engaged crypto enthusiasts a month through our website, podcast, newsletters, and YouTube. Get your brand in front of key decision-makers and early adopters in 2026. Limited slots remaining! Find out more today!