Bitcoin Price Prediction: Can BTC Reclaim $80K as US Midterm Election 2026 Fears Fade?

Bitcoin recovered above $78,000 on November 4 after an election-night decline below $76,000, leaving traders focused on whether renewed spot demand can sustain the rebound.
The US midterm election results initially triggered another wave of selling, but BTC quickly recovered as political uncertainty eased. Spot buying pressure, moving-average support, and liquidation levels are now shaping the short-term Bitcoin price prediction, with $80,000 remaining an important upside threshold.
Bitcoin Price Today Rebounds as Election Uncertainty Fades
Bitcoin experienced sharp volatility as the 2026 US midterm election results emerged. BTC traded near $78,000 before losing ground as early results indicated a Democratic victory in both chambers of Congress. The selling accelerated overnight on November 3 and pushed the Bitcoin price to approximately $75,618 on Bitstamp, its lowest level in almost seven weeks.
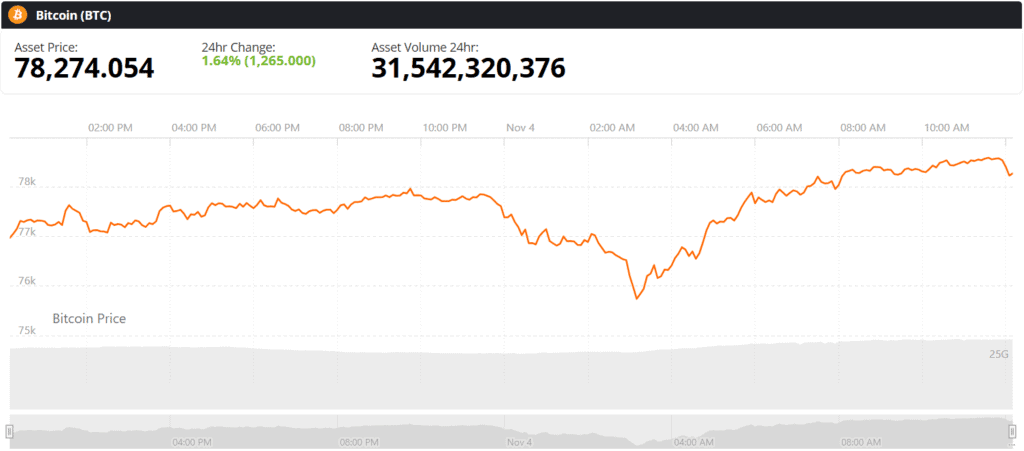
Bitcoin (BTC) price chart. Source: Brave New Coin
However, buyers quickly entered the market near the $76,000 region. Bitcoin subsequently recovered toward $78,000, reversing much of its election-related decline. Reuters reported that BTC reached approximately $78,354 on Wednesday, November 4, while Ethereum also recovered alongside other digital assets.
The initial reaction reflected concerns about potential changes to US cryptocurrency policy under a Democratic-controlled Congress. However, market participants had already anticipated much of the election outcome, limiting the possibility of prolonged selling once the results became clearer.
Kelly Ye, head of research at Talos, highlighted this positioning in comments to Cointelegraph. She noted that Bitcoin’s post-election movement was close to what options markets had anticipated, adding that “the election was the main event, but markets had largely prepared for it.”
The recovery suggests that traders are beginning to shift their attention from election-related uncertainty toward technical levels and underlying demand. Nevertheless, reclaiming $80,000 would require additional buying pressure rather than simply reversing the latest decline.
Bitcoin Spot Buying Pressure Contrasts With Futures Selling
Trading activity across spot and derivatives markets is offering another indication of Bitcoin’s short-term direction. Crypto trader Ted Pillows shared a 15-minute BTC chart on November 4 showing positive spot cumulative volume delta (CVD) of approximately $218 million against negative futures CVD of around $482 million.
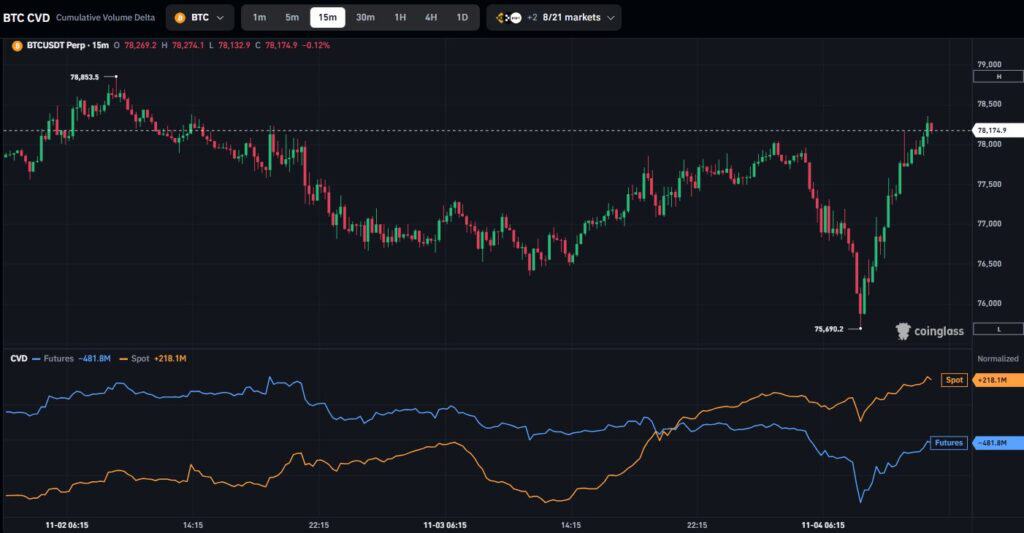
The analysis indicates limited further downside from the election outcome, with the chart showing a recovery following a sharp intraday decline. Source: Ted via X
CVD measures the difference between aggressive buying and selling activity over a selected period. Positive spot CVD indicates that market participants are placing more aggressive buy orders than sell orders in the spot market. Meanwhile, negative futures CVD reflects greater selling pressure across derivatives trading.
The divergence suggests that spot buyers are absorbing some of the selling activity generated in futures markets. This distinction is important because a recovery supported by actual spot purchases can have a different market structure from one driven primarily by leveraged positions.
Ted Pillows described the spot buying pressure as encouraging and argued that the Democratic election victory had largely been priced into the market. The accompanying chart showed Bitcoin recovering after an intraday decline, indicating that buyers were willing to enter at lower prices.
However, positive spot CVD does not guarantee a sustained reversal. The indicator reflects activity during a specific period and may change as market conditions evolve. Continued spot accumulation, accompanied by improving derivatives positioning, would provide stronger evidence that the recovery is gaining traction.
BTC Reclaims 100-Day Moving Average After Election Dip
Bitcoin’s daily chart is showing an important technical development following the election-related volatility. According to TradingShot’s TradingView analysis, BTC briefly dropped below its 100-day moving average before recovering rapidly after the election results.
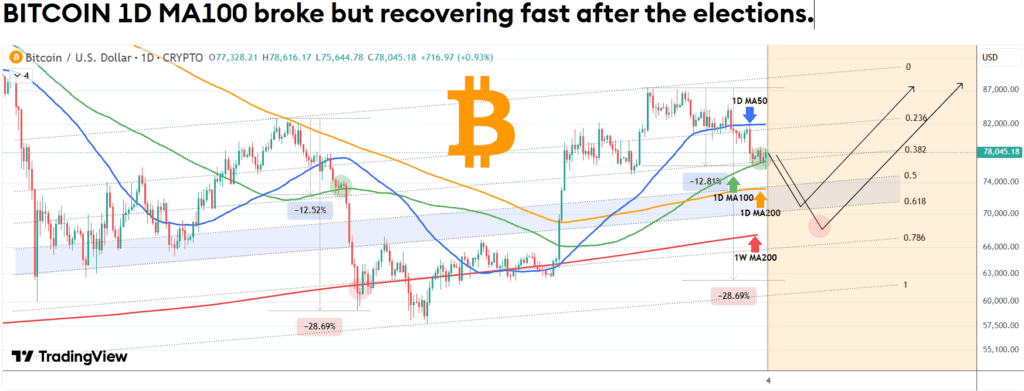
BTC briefly fell below its daily MA100 but rebounded sharply, recovering all losses following the U.S. midterm election results. Source: TradingShot on TradingView
This marked the first break below the daily 100-day moving average since August 19, when Bitcoin began a strong recovery from its previous bear-market bottom. The subsequent rebound has brought the technical indicator back into focus as traders assess whether the latest decline was a temporary breakdown or the beginning of a deeper correction.
The distinction between these scenarios will depend on Bitcoin’s ability to maintain its position above the moving average. A sustained hold could support further recovery and improve the medium-term price structure. Conversely, another decisive daily close below the indicator would weaken the bullish interpretation.
TradingShot also compared the latest price structure with a previous May decline. The analysis identified a similar 12.81% retracement toward the 100-day moving average, raising the possibility of another corrective phase if support fails.
If selling pressure returns, the 200-day moving average becomes an additional technical reference. TradingShot also highlighted the weekly 100-day moving average and the 0.618 Fibonacci retracement level as potential areas for buyers to defend.
These levels should be treated as technical reference points rather than guaranteed reversal zones. Bitcoin’s reaction around the daily 100-day moving average will provide further information about the strength of the current recovery.
Trader Realized Price Offers Another BTC Support Test
On-chain metrics are providing additional context for Bitcoin’s recent price movements. CryptoQuant highlights analyst TraderGemini’s report that BTC was trading close to its Trader On-chain Realized Price, an indicator measuring the average acquisition cost of coins that last moved between one and three months ago.
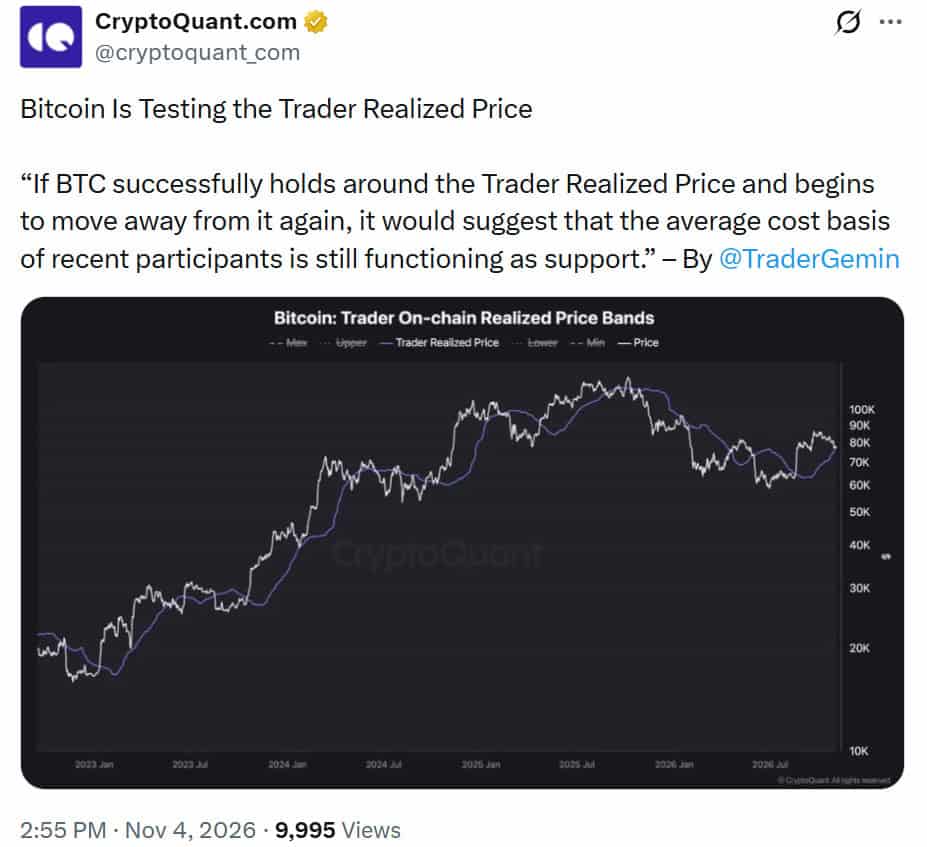
Bitcoin is testing its Trader Realized Price, which represents the average cost basis of coins last moved on-chain 1–3 months ago. Source: CryptoQuant via X
The metric provides an estimate of the cost basis for relatively recent market participants. When Bitcoin trades above this level, recent buyers generally remain in profit. This can encourage them to maintain their positions and potentially provide support during market corrections.
However, a sustained move below the Trader Realized Price could change investor behavior. Recent buyers may begin facing unrealized losses, increasing the possibility of selling pressure if the price fails to recover.
CryptoQuant’s historical chart shows that this cost-basis indicator has previously acted as support and resistance during different Bitcoin market cycles. Its current proximity to the BTC price therefore makes the level particularly relevant to the short-term outlook.
TraderGemini emphasized that holding this level and moving higher would indicate that the average cost basis of recent participants continues to support the market. A breakdown, followed by an unsuccessful recovery, could instead weaken the current bullish structure.
The indicator does not establish whether Bitcoin has reached a market bottom. Its value lies in showing how recent investors are positioned and whether their average acquisition price continues to attract buying interest.
$82K Liquidity Cluster Puts $80K Resistance in Focus
Bitcoin’s liquidation heatmap is highlighting another potential development for the coming sessions. Ted Pillows noted that BTC recently swept downside liquidity during its decline, leaving a concentrated cluster of leveraged positions around $82,000.
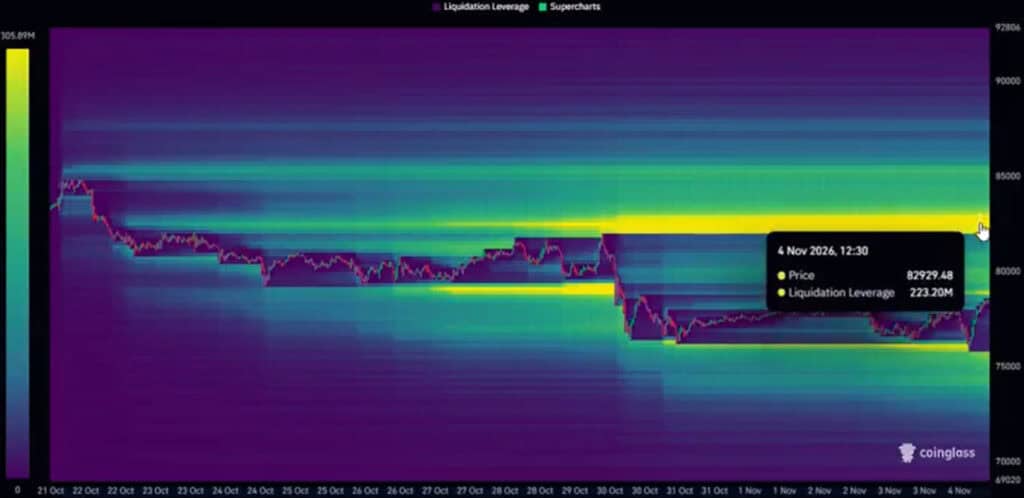
Bitcoin’s recent downside liquidity sweep has formed a large liquidity cluster near $82K, potentially attracting price higher and setting up a breakout attempt above $80K. Source: Ted via X
The CoinGlass heatmap covering October 21 to November 4 shows concentrations of leveraged liquidation levels across the $80,000–$85,000 region. These areas can attract the market’s attention because rapid price movements toward concentrated positions may trigger liquidations and increase trading activity.
With Bitcoin recovering from below $76,000, the $80,000 threshold represents the first important psychological and technical obstacle. A sustained move above this level could bring the higher liquidity concentration closer into focus, including the area around $82,000.
CoinDesk also highlighted the $80,000–$82,000 range as overhead resistance in its November 4 market analysis. Markus Thielen, founder of 10x Research, pointed to Bitcoin’s daily stochastic indicator, which suggested that the cryptocurrency had become oversold during the decline.
Thielen identified $82,000 as a potential recovery target based on the momentum reading. However, this remains an analyst’s technical assessment rather than confirmation that Bitcoin will reach that level.
Liquidation heatmaps also require careful interpretation. They estimate where leveraged positions may be concentrated, but these clusters can shift as traders open, close, or adjust their positions. They should not be treated as fixed price targets.
Bitcoin Price Prediction: Can BTC Reclaim $80K?
Bitcoin’s immediate outlook depends on whether buyers can maintain the recovery and overcome resistance around $80,000. The latest spot CVD reading, the rebound above the daily 100-day moving average, and the recovery from the election-night low provide several encouraging technical signals.
A sustained move above $78,000 would help strengthen the short-term recovery structure. If buying pressure continues, BTC could challenge $80,000 before testing the $81,900–$82,000 region. The latter area also aligns with the 50-day moving average near $81,911 in a contemporaneous November 4 technical assessment.
Nevertheless, the broader market structure remains vulnerable. Bitcoin’s recent decline showed that election-related headlines can quickly influence leveraged trading, while the presence of overhead selling pressure could restrict further gains.
On the downside, the $76,000 region remains an important area to monitor. Bitcoin’s election-night low near $75,618 and the 50-week moving average around $75,733 provide additional support references. A decisive breakdown below these levels could expose the longer-term 200-day moving average near $73,163.
Spot demand will also remain important. While Ted Pillows’ chart indicates that buyers have been active in the spot market, sustained recovery would benefit from continued accumulation and improving institutional investment flows.
CoinDesk reported that US-listed spot Bitcoin ETFs experienced approximately $515 million in outflows during October, followed by substantial withdrawals during the first two trading days of November. These figures suggest that institutional demand remains an important factor to watch as BTC attempts to regain higher price levels.
For now, Bitcoin’s recovery has reduced immediate election-related selling pressure, but it has not established a confirmed medium-term bullish reversal. Reclaiming $80,000 and maintaining support around the moving averages would provide stronger evidence of improving market conditions. Until then, the $76,000–$82,000 range remains an important area for monitoring the next phase of Bitcoin price action.
 Brave New Coin reaches 1M+ engaged crypto enthusiasts a month through our website, podcast, newsletters, and YouTube. Get your brand in front of key decision-makers and early adopters in 2026. Limited slots remaining! Find out more today!