Brave New Coin Weekly Bitcoin halving countdown update: 23rd April

![]()
Brave New Coin has launched a countdown to predict the date and timing of the Bitcoin Halving. This weekly report summarizes the data provided by BNC's halving prediction models and analyzes the macro factors influencing the halving countdown.
What is the Halving?
Bitcoin is a decentralized digital currency that enables instant payments to anyone, with no central authority. The Bitcoin network is secured by miners which are specialized computers that use a consensus mechanism called “proof of work” to verify each block of bitcoin transactions.
The miner that verifies each block is rewarded for their work with newly-created bitcoins. This ‘block reward’ is how new bitcoins are released into the system. A new block of transactions is added to the Bitcoin blockchain approximately every 10 minutes. The current reward is 12.5 bitcoins per block.
An average of 144 blocks are mined every day which means approximately 1,800 new bitcoins are generated every 24 hours.
The number of new bitcoins that are created via the block reward is reduced by half every four years. This is known as the Bitcoin Halving. The next halving will be the third halving, and the current block reward of 12.5 bitcoins will reduce to 6.25 bitcoins.
This week in the halving countdown
The Bitcoin network’s hash rate continues to recover following a mid-March collapse. A number of predictors are now converging on the 12th of May for the next halving date.
This week’s consolidated, across all 8 of Brave New Coin prediction models, Bitcoin (BTC) block reward having prediction date is 11/05/2020 17:26. Each model is recalculated every day.
Block halving prediction times are based on average daily block times. As hashrate increases more blocks are produced each day, pushing forward this week’s predicted halving dates.
The consolidated prediction date from a week earlier was 12/05/2020 18:24. This predicted date is 24 hours and 58 minutes earlier than last week.
The Bitcoin network hash rate has enjoyed a sustained pickup following a price and hash rate crash in Mid-March and has grown by over 60% in this period.
Bitcoin spot prices have performed well along with a number of key fundamental metrics, including hash rate and Average Daily block times.
The price of BTC has jumped from US$4931.30 to US$7,1296.29 since March 13th, rising a significant ~45%. Improving market prices are generally positively correlated with the hashrate as they improve mining profitability and encourage miners to deploy more hardware.
All 4 core BNC halving date predictors are now converging to dates between the 10th & 13th of May as hashrate has begun to pick up gradually and steadied out. Even Average Daily Block Time (scenario 1), the most volatile model of the group that is only based on block times in the last 24 hours, has predicted an average predicted halving date of 10/05/2020 12:09 in the last week.
Brave New Coin Crypto Analyst Josh Olszewicz observed that weekly active addresses on the Bitcoin network had hit a 9-month high on April 20th. Another metric, “Hodler net position change,” has grown significantly since the start of March and is now touching yearly highs. This metric is a measure of the monthly position change of “Hodlers” or long term investors, and is a bullish flag, implying long term investors in the Bitcoin network are increasing their positions.
With only a few weeks until its 3rd halving event, Bitcoin appears to be in strong health. Market prices and sentiment have improved since the COVID-19 created investor panic. Fundamentals continue to look strong with the demand to both mine and invest in the network healthy.
https://bravenewcoin.com/data-and-charts/bitcoin-halving
Halving prediction dates (average across the week)
Average predicted block halving date 19/04/2020 across the 8 different models= 11/05/2020 22:57
Average predicted block halving date the week before across the 8 different models= 12/05/2020 14:16
Difference= 59 minutes earlier
Date Convergence charts
Scenario 1: Average Daily Block Time
This is the average execution time of all Bitcoin blocks mined the day before. This model estimates the number of days left until the next halving, by multiplying the average daily block time by the number of blocks left to be mined before the next halving. Using this measure we calculate the timestamp for next halving.
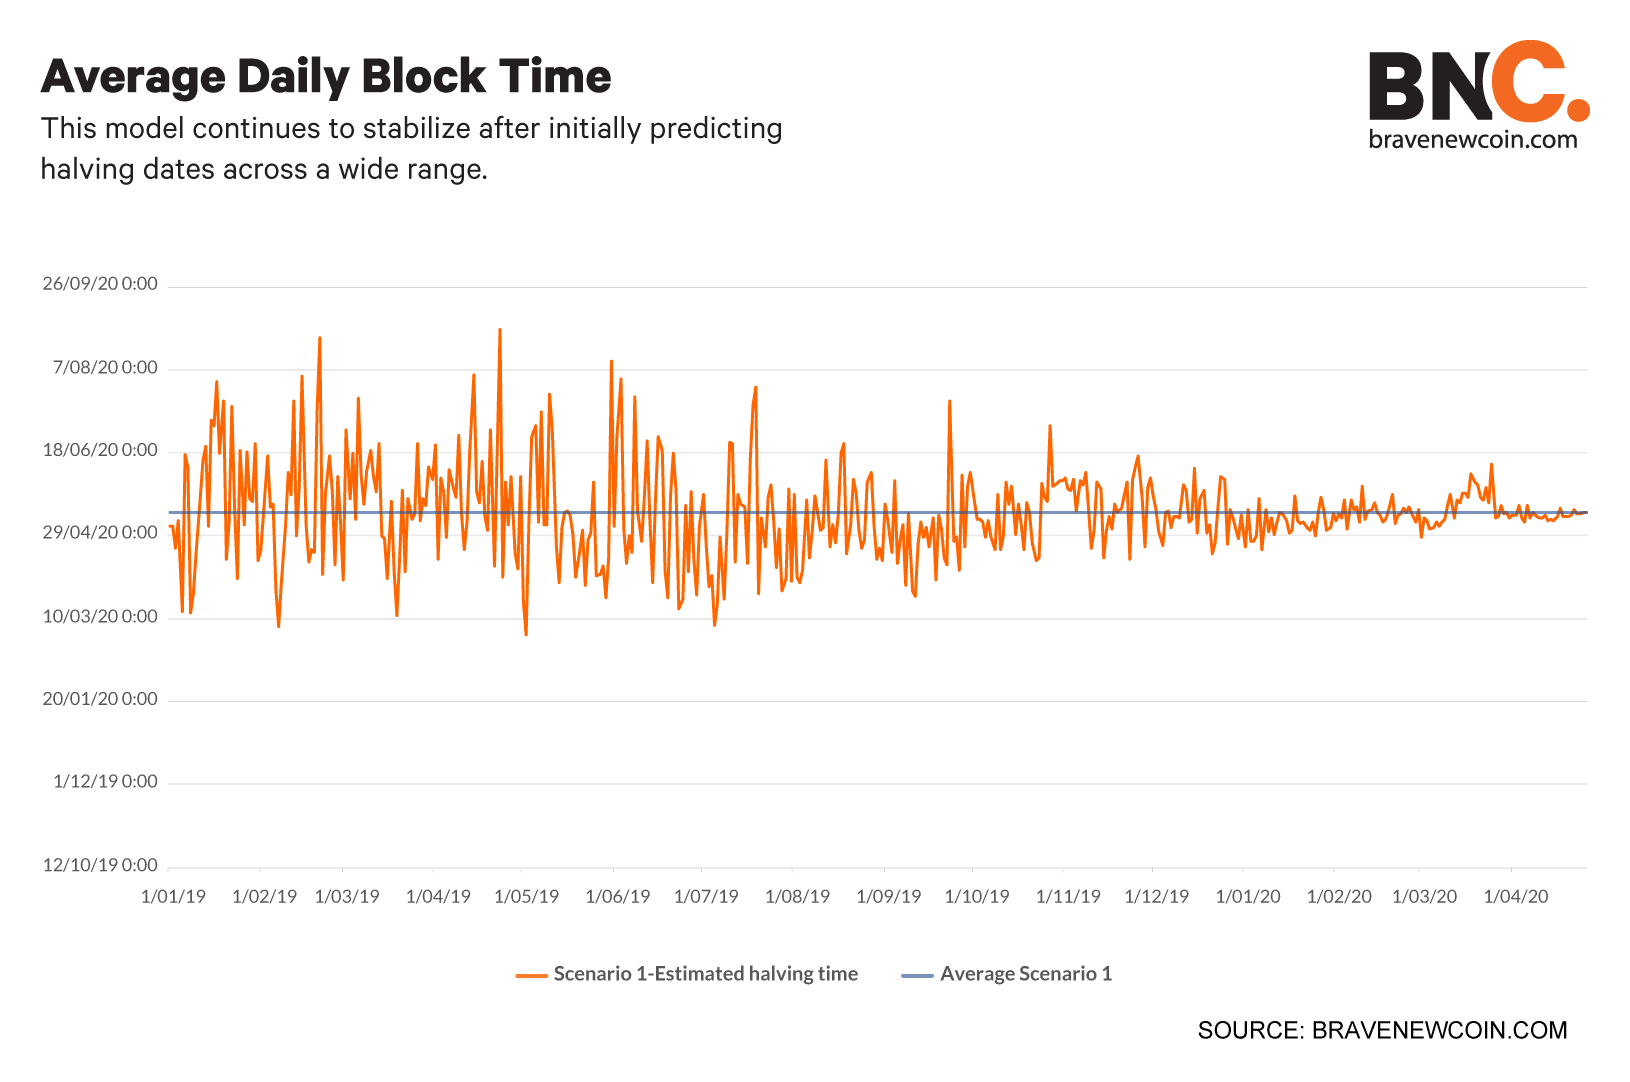
Average predicted halving date (first observation 01/01/2019)= 13/05/2020 21:37
Predicted halving date 26/04/2020= 10/05/2020 07:51
Scenario 2: Cumulative Average Block Time
This is the cumulative numerical average of execution time of all Bitcoin blocks mined till the present day. In order to remove the long gap between the initial block execution, the average block time between those blocks is taken as 600 seconds. We estimate the number of days left until the next halving, by multiplying the cumulative average block time with the number of blocks left to be mined before the next halving. By using this measure we calculate the timestamp for next halving.
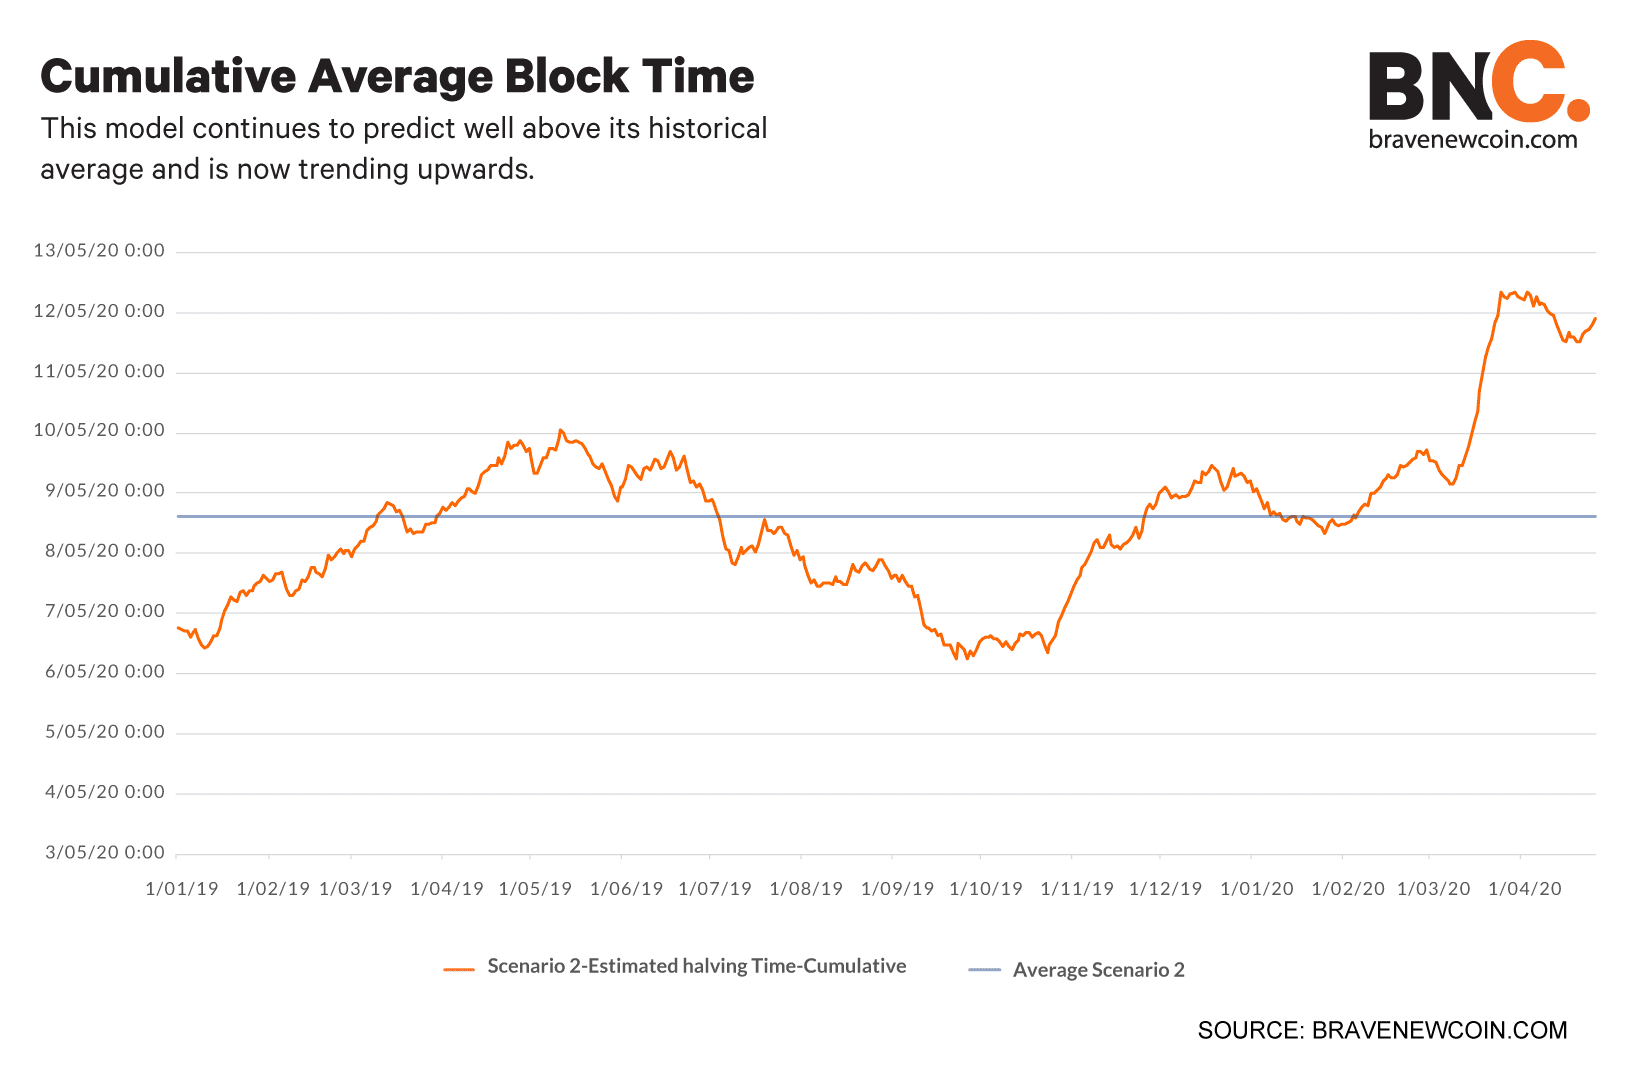
Average predicted halving date (first observation 01/01/2019)= 08/05/2020 13:48
Predicted halving date on 19/04/2020= 11/05/2020 14:11
Scenario 3: Simple Moving Average Block Time 50 day
This is an arithmetic moving average of all block times calculated by adding the average block time of blocks executed each day for the last 50 days of the period. This is a lagging technical indicator which applies an equal weight to all observations over the period for determining if the block time will continue to have the same trend or reverse it. If the simple moving average points up, this will explain the increase in the number of blocks executed which means the halving date will arrive faster than expected. If it is pointing down it means that the blocks executed will decrease on a daily basis and the halving date can move further away.

Average predicted halving date (first observation 01/01/2019)= 13/05/2020 17:47
Predicted halving date on 01/04/2020= 12/05/2020 16:52
Scenario 4: Exponential Moving Average block time 200 day
This is a type of moving average where a greater significance is given to the most recent average block times. This provides good signals on crossovers and divergences from the historical average block time. This is a lagging technical indicator. When the average block time crosses the moving average block time, the large changes are expected in the average block time, where the trend changes direction. As EMA provides higher weight to the recent daily average block time than on older data, it is more reactive to the latest block time changes.
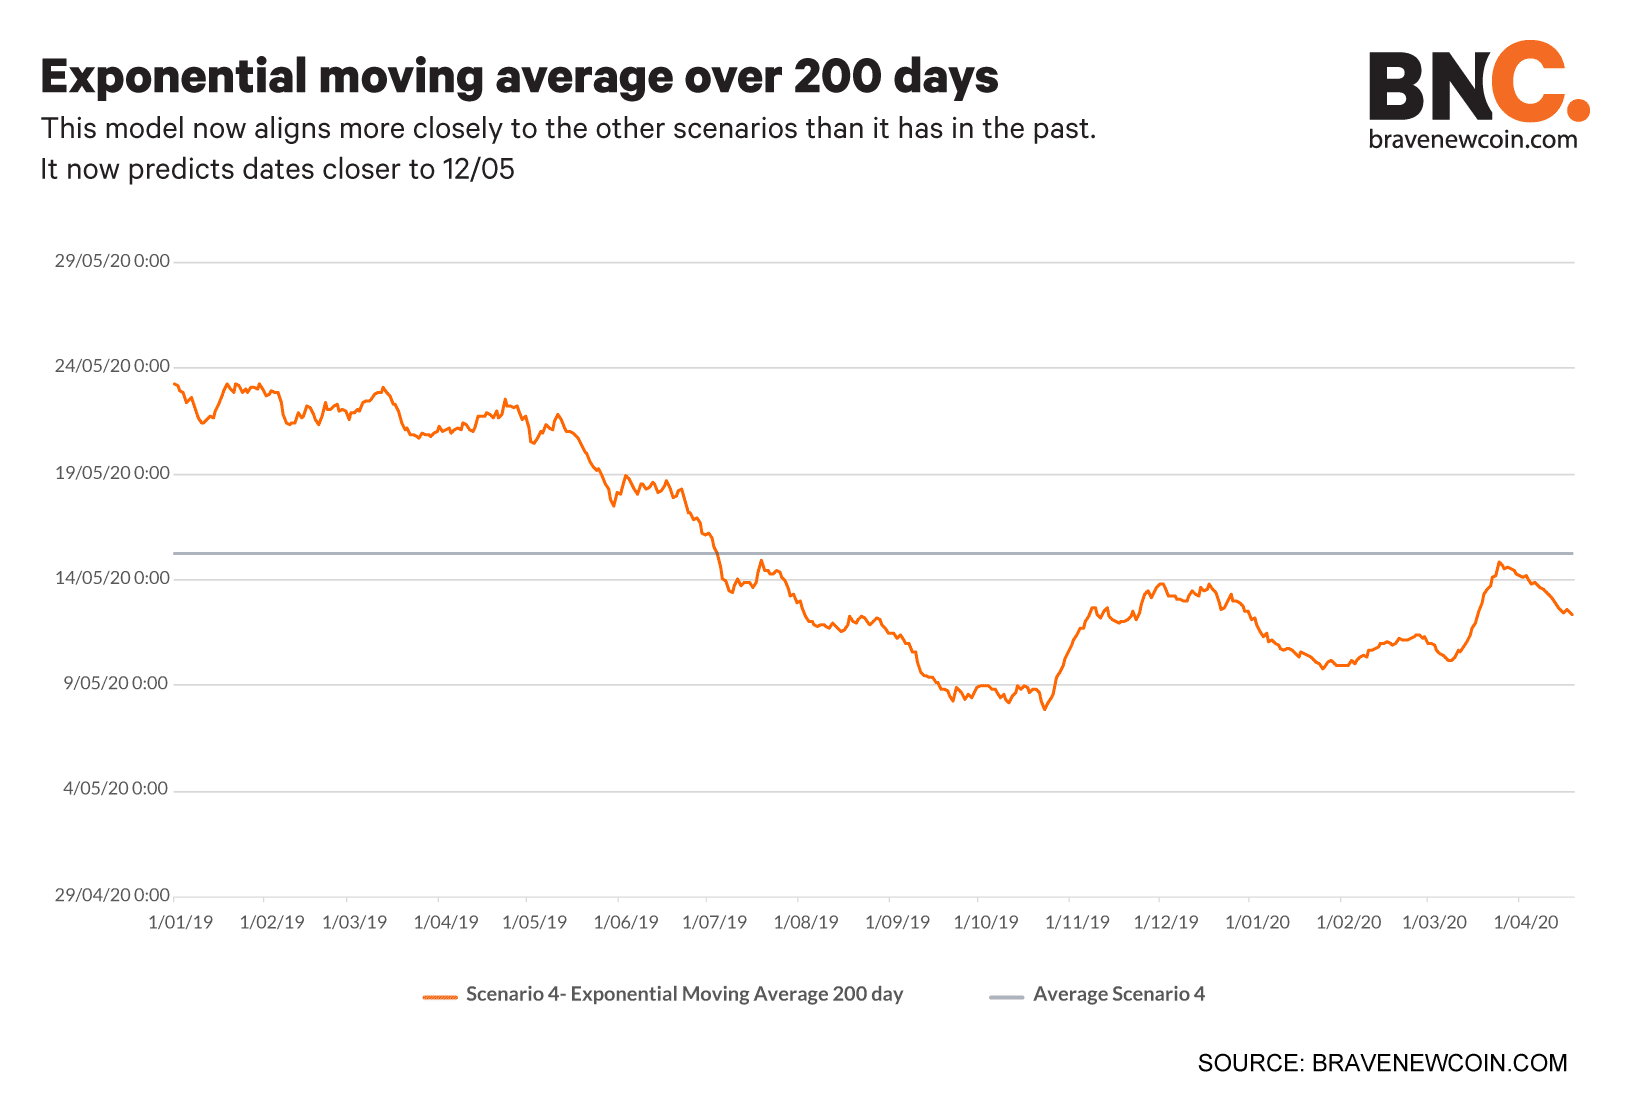
Average predicted halving date (first observation 01/01/2019)= 15/05/2020 05:38
Predicted halving date on 01/03/2020= 12/05/2020 08:58
https://bravenewcoin.com/data-and-charts/bitcoin-halving
Network fundamentals
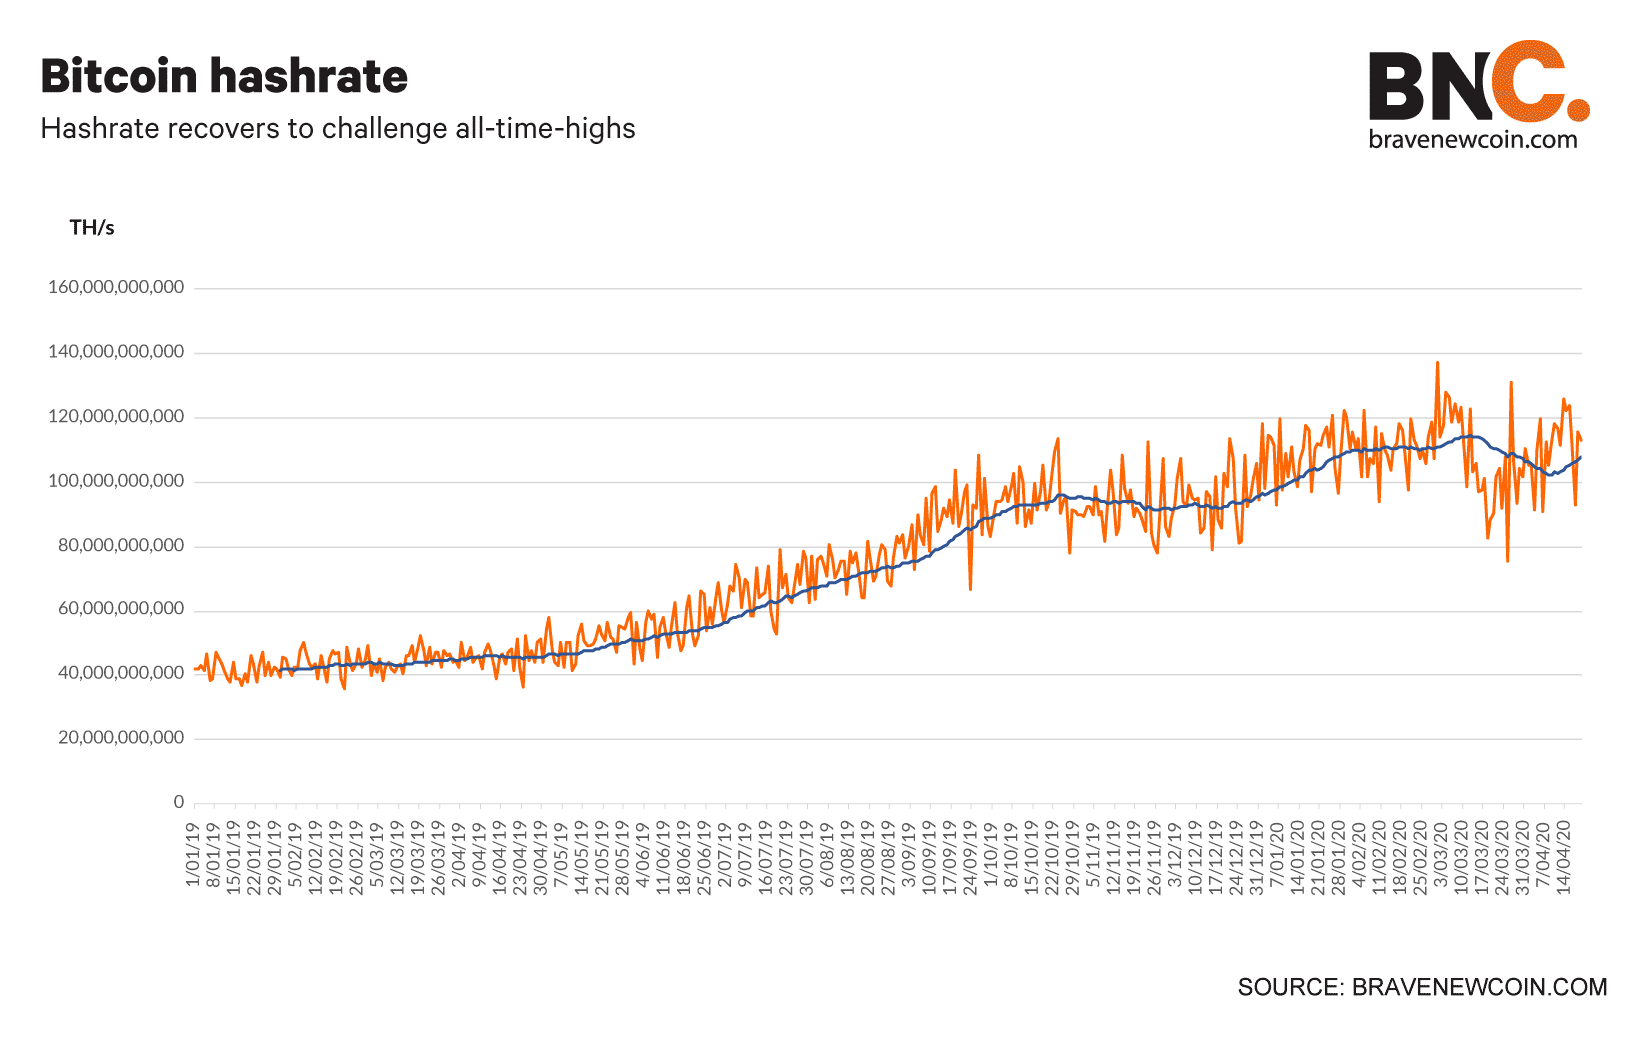
Average Daily Hashrate 19/04/2020-12/4/2020= 115,052,368,189
Average Daily Hashrate the week before= 109,802,926,261 Th/s
Percentage change= 4.78%
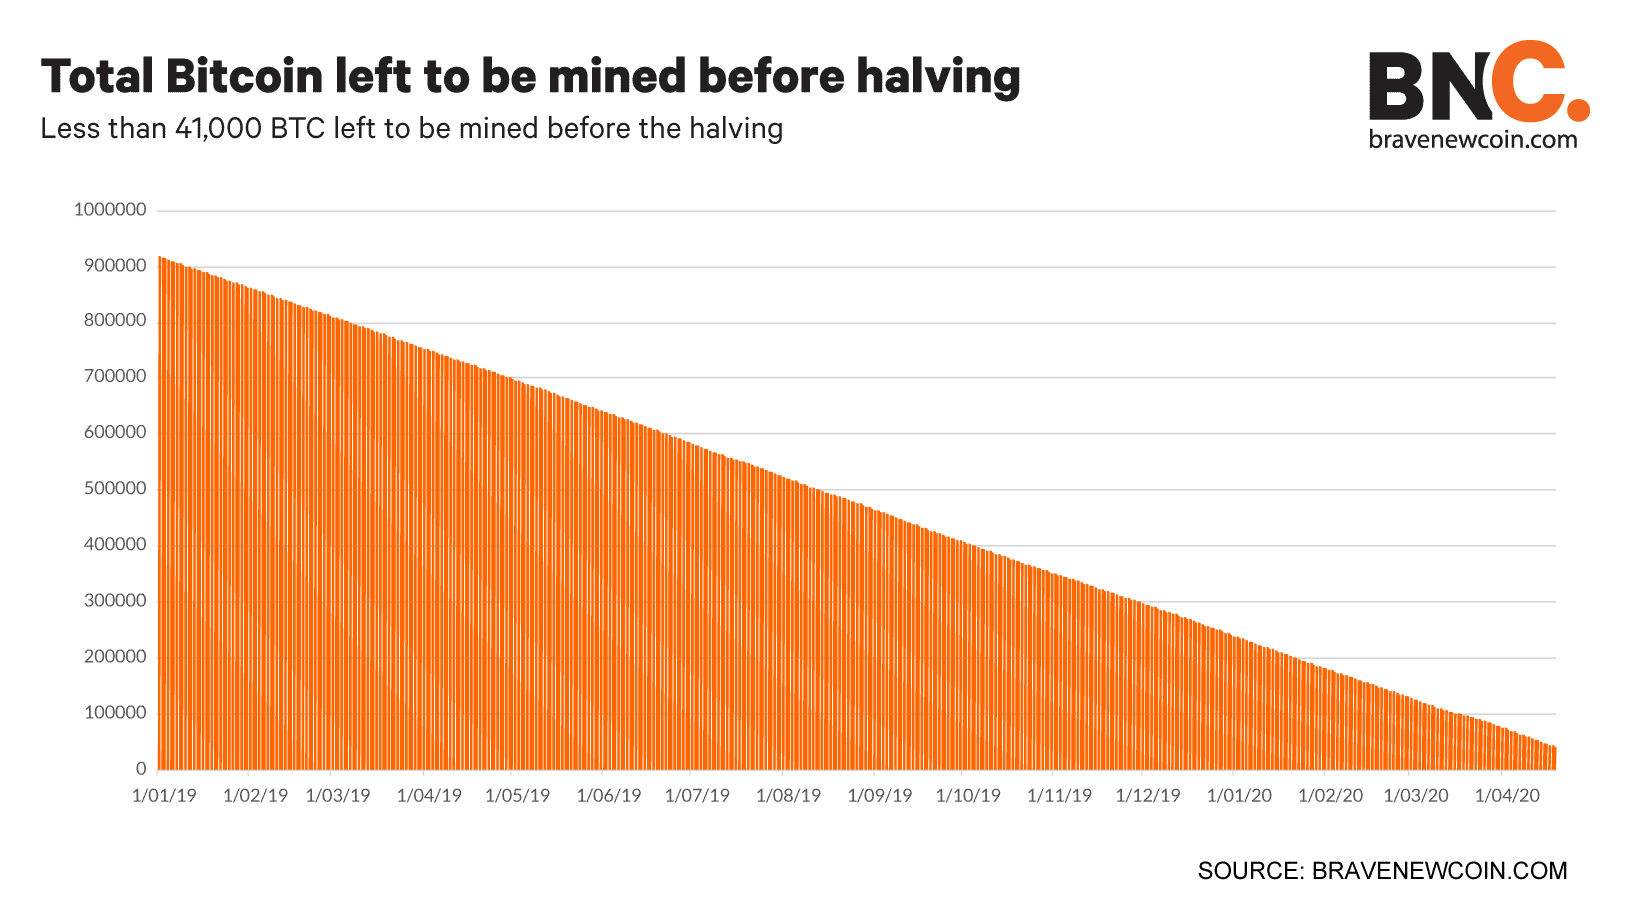
Bitcoin left to be mined before the halving as of 23/03/2020= 40312.5 btc btc
 Brave New Coin reaches 1M+ engaged crypto enthusiasts a month through our website, podcast, newsletters, and YouTube. Get your brand in front of key decision-makers and early adopters in 2026. Limited slots remaining! Find out more today!


