Dogecoin Price Analysis – Down but not out


Despite Doge sitting at historic price lows, indicators like the Volume Profile, Visible Range and Ichimoku Cloud suggest a near-term reversal is likely.
Dogecoin (DOGE) was released on December 6th, 2013, emerging out of an effort to increase cryptocurrency adoption, understanding, and awareness. Originally inspired by the Shiba Inu meme, the cryptocurrency was created by Billy Markus, with the help of Jackson Palmer, who left the project in 2015.

Watch a summary of this analysis on YouTube
DOGE has an available coin supply of 123 billion, among the highest circulating supplies among all coins, and ranks 31st on the Brave New Coin market cap table, with a market cap of US$314 million and nearly US$20 million in trade volume over the past 24 hours.
Based on the Scrypt Proof-of-Work coins Luckycoin and Litecoin, DOGE has a fixed block reward of 10,000 DOGE, and a one minute block time with no limit on the total number of coins created. The DOGE block height is currently above 3,082,333 and inflation is currently 4.08%.
After security concerns revolving around a potential 51% attack in 2014, the creator of Litecoin (LTC), Charlie Lee, proposed a merged mining solution for DOGE and LTC. Merged mining allows for cryptocurrencies with the same consensus algorithm to be mined simultaneously. After the LTC block reward halving in August, DOGE hash rate also declined.
Source: BitInfoCharts
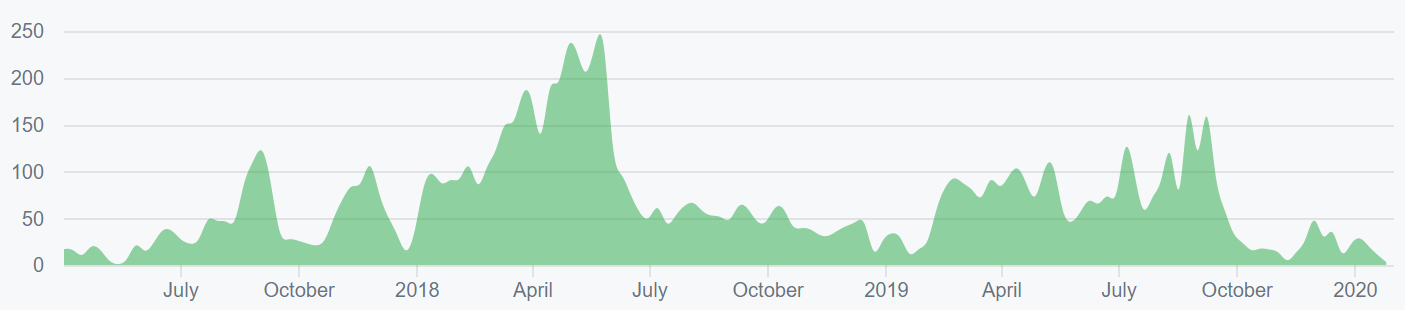
DOGE transactions per day (line, chart below) have largely ranged from 20,000-50,000 since December 2017. Over the past year, DOGE has had more transactions per day than Monero (XMR), Dash (DASH), and Zcash (ZEC). The average transaction value (fill, chart below) have declined since January 2019, but remains above historical levels.
On January 10, 2019, DOGE reached a record high US$3.27 billion in on-chain daily transaction volume, surpassing all other coins that day, with the exception of Bitcoin (BTC). Average transaction fees are currently US$0.00289 and have been consistently been lower than BTC, LTC, BCH, XMR, DASH, ZEC, and Ethereum (ETH) (not shown).
Source: CoinMetrics
The 30-day Kalichkin network value to estimated on-chain daily transactions (NVT) ratio (line, chart below) is currently 100 and rising. An NVT below 30 would likely indicate organic and sustained bull market conditions. Inflection points in NVT can be leading indicators of a reversal in asset value. An uptrend in NVT often suggests a coin is overvalued based on its economic activity and utility, which should be seen as a bearish price indicator, whereas a downtrend in NVT suggests the opposite.
Active and unique addresses are important to consider when determining the fundamental value of the network based on Metcalfe’s law. Monthly active addresses (MAAs) are currently 50,000 (fill, chart below), well above the historic norm but down from a May high of 93,000. A growing number of MAAs would suggest bullish price action. DOGE has more MAAs than Zcash (ZEC), Ripple (XRP), Bitcoin-Cash (BCH), and Stellar (XLM).
The market cap divided by the realized cap (MVRV) is another crypto-native fundamental metric used to asses overbought or oversold conditions. Realized cap approximates the value paid for all coins in existence, by summing the market value of those coins at the time they last moved on the blockchain.
Historically, periods of an MVRV less than one have represented buying opportunities, whereas periods of an MVRV greater than three have represented selling opportunities. All three MVRV levels above three have represented local highs in price. Currently, MVRV sits just below one, suggesting the potential for additional upside, as well as a buying opportunity.

Turning to developer activity, DOGE has had very little dev activity over the past few years, with seven repos and just nine commits on the main Github repo in the past year. Most coins use the developer community of GitHub, where files are saved in folders called “repositories” or "repos," and changes to these files are recorded with “commits.” Although commits represent quantity and not necessarily quality, a higher number of commits can signify higher dev activity.
However, Dogecoin Core v1.14 was released through a soft fork in April 2019. The protocol upgrade brought improved validation speed and network propagation performance, leading to much shorter sync and initial block download times.
Source: Github
In the markets, DOGE exchange-traded volume has been dominated by the Tether (USDT) and Ethereum (ETH) pairs over the past 24 hours, with the Turkish Lira (TRY) also carrying substantial volume. The top volumes by exchange include HitBTC, Binance, and Huobi.
Over the past few years, DOGE has experienced a raft of exchange listings, including being added to Robinhood and Yahoo! Finance in July and August 2018, respectively. Additionally, DOGE/USDT pairs were added to Poloniex and Bittrex in August 2018 and September 2018, respectively. In May, 2019, DOGE was added to the Coinbase Wallet. In July, Binance listed DOGE/BNB, DOGE/BTC, DOGE/USDT, DOGE/PAX and DOGE/USDC trading pairs and OKEx added DOGE/USDT and DOGE/USDK trading pairs. Binance then delisted DOGE/PAX and DOGE/USDC pairs in September. In October, Binance.US and UpBit listed DOGE/USD and DOGE/BTC pairs, respectively.

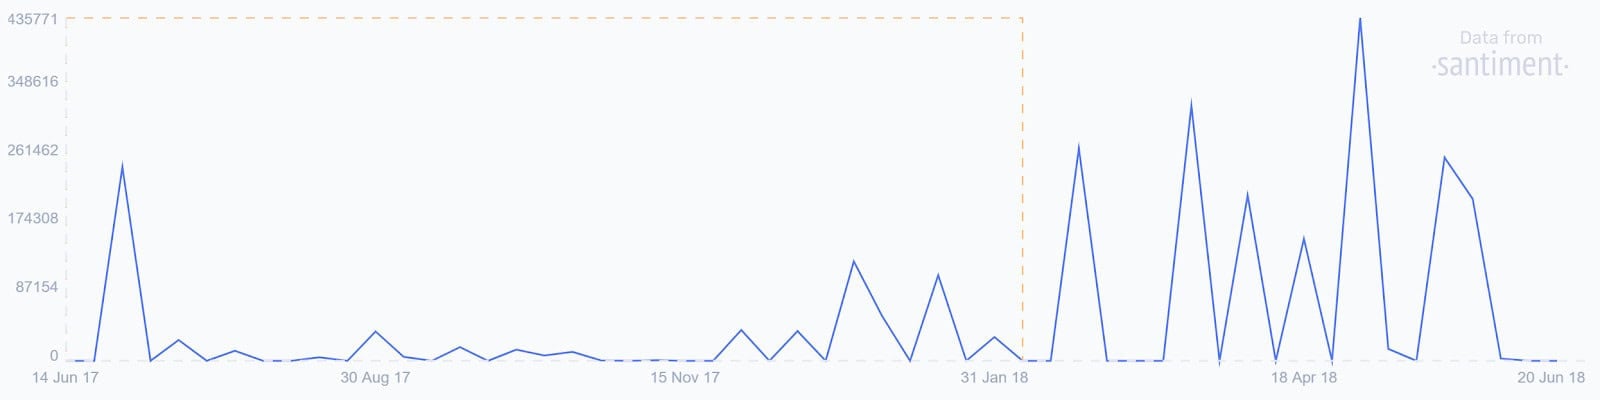
Worldwide Google Trends data for the term "Dogecoin" spiked to an all-time high in January 2018, mirroring a local high in price at that time. Overall, searches for “Dogecoin” remain down significantly from early 2018. A slow rise in searches for "Dogecoin" preceded both highs in September 2019 and March 2019, likely signaling interest from new market participants at that time. A 2015 study found a strong correlation between the Google Trends data and BTC price, while a May 2017 study concluded that when the U.S. Google "Bitcoin" searches increased dramatically, BTC price dropped.
Technical Analysis
As DOGE/BTC sits in a range of historic price lows, Volume Profile Visible Range, Ichimoku Cloud, Oscillators, and Exponential Moving Averages can be used to help assess the potential of a bullish reversal. Further background information on the technical analysis discussed below can be found here.
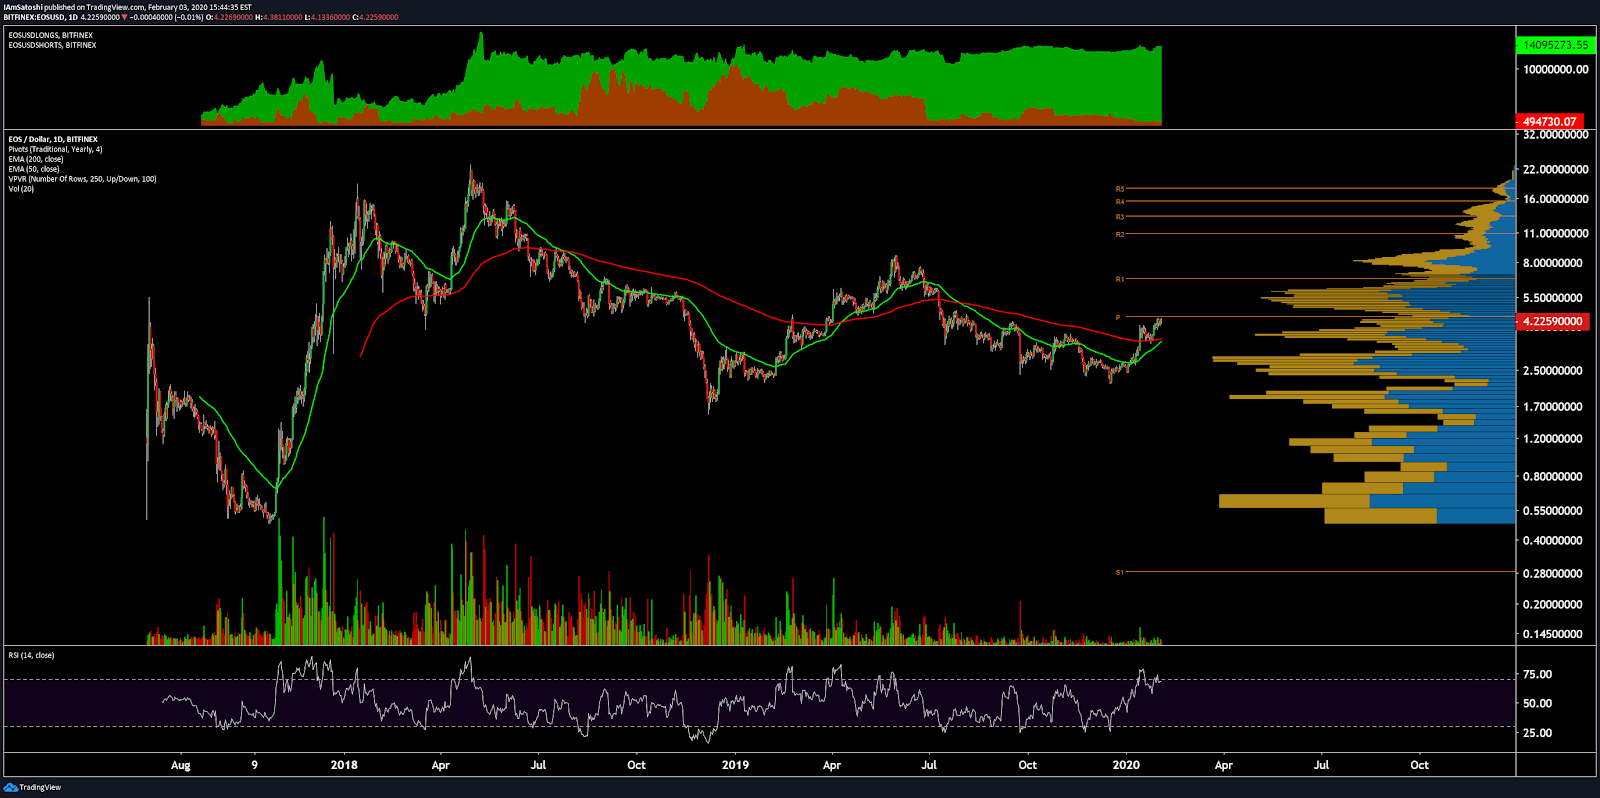
Historically, DOGE has not had any liquid USD pairs and has been dominated by the BTC pair. The DOGE/BTC weekly chart has shown a buy zone from 15-25 sats, and a sell zone of 100-120 sats. Currently, at a cycle low, the 26 sat price represents a low-risk, high-reward trading zone. Consequently, the Volume Profile Visible Range (VPVR) shows significant support within the 15-25 sat historic buy range with significant resistance at the 40 sat zone. Historically, DOGE retraces over the course of three to six weeks once a bottom has formed.
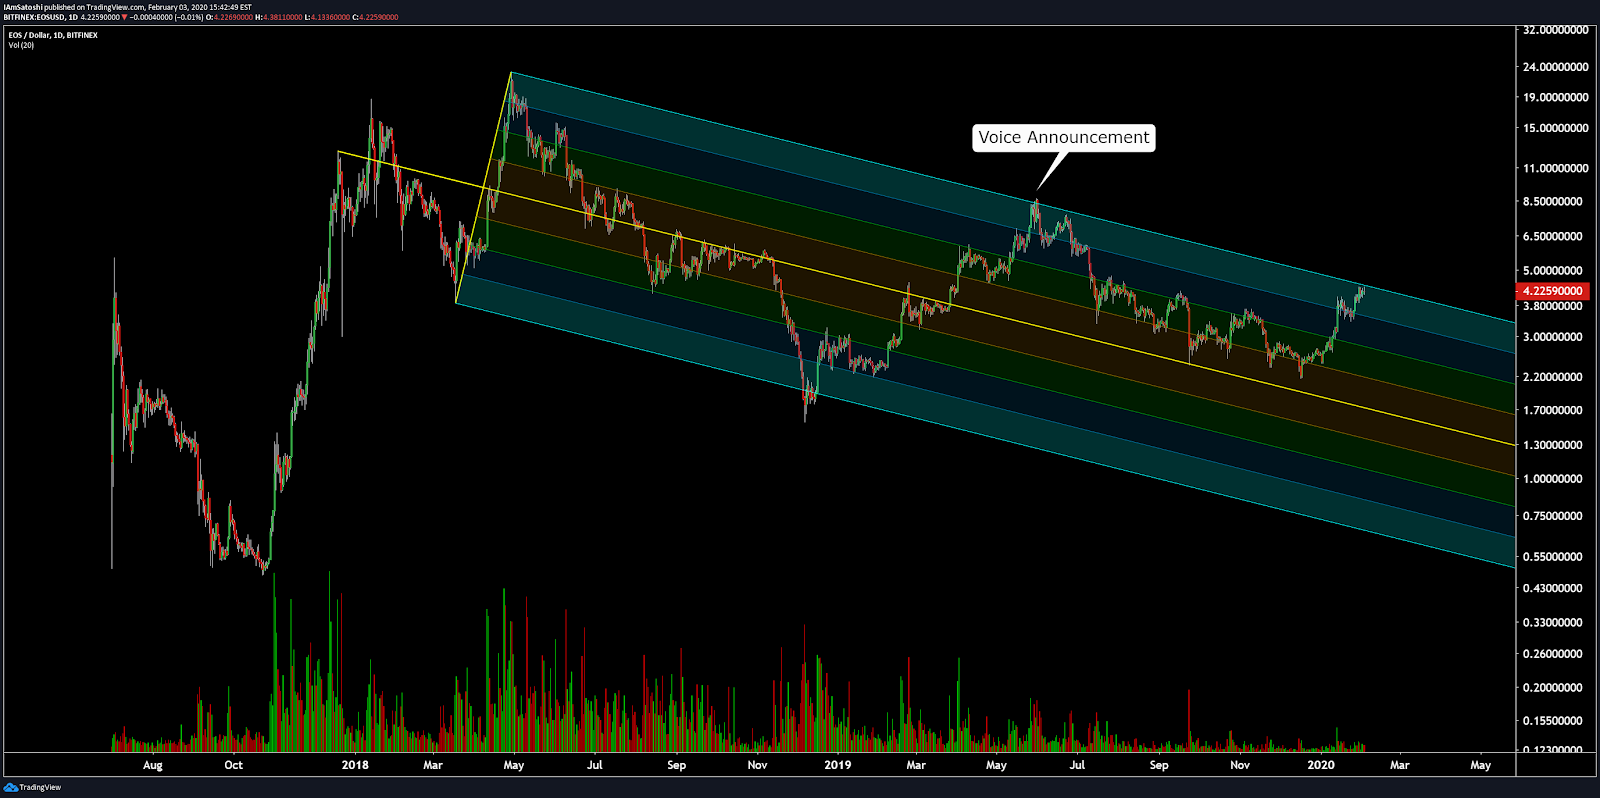
Turning to the Ichimoku Cloud, four metrics are used to determine if a trend exists; the current price in relation to the Cloud, the color of the Cloud (red for bearish, green for bullish), the Tenkan (T) and Kijun (K) cross, and the Lagging Span. The best entry always occurs when most of the signals flip from bearish to bullish, or vice versa.
The status of the current Cloud metrics on the daily time frame with doubled settings (20/60/120/30) are bearish; price is below the Cloud, the Cloud is bearish, the TK cross is bearish, and the Lagging Span is below Cloud and inside the current spot price.
A traditional long entry will not trigger until the current spot price is above the Cloud with a bullish TK cross. However, a potential edge to edge trade can trigger if the spot price returns to within the Cloud (yellow arrow), from 41 to 64 sats. There are no RSI divergences at this time.
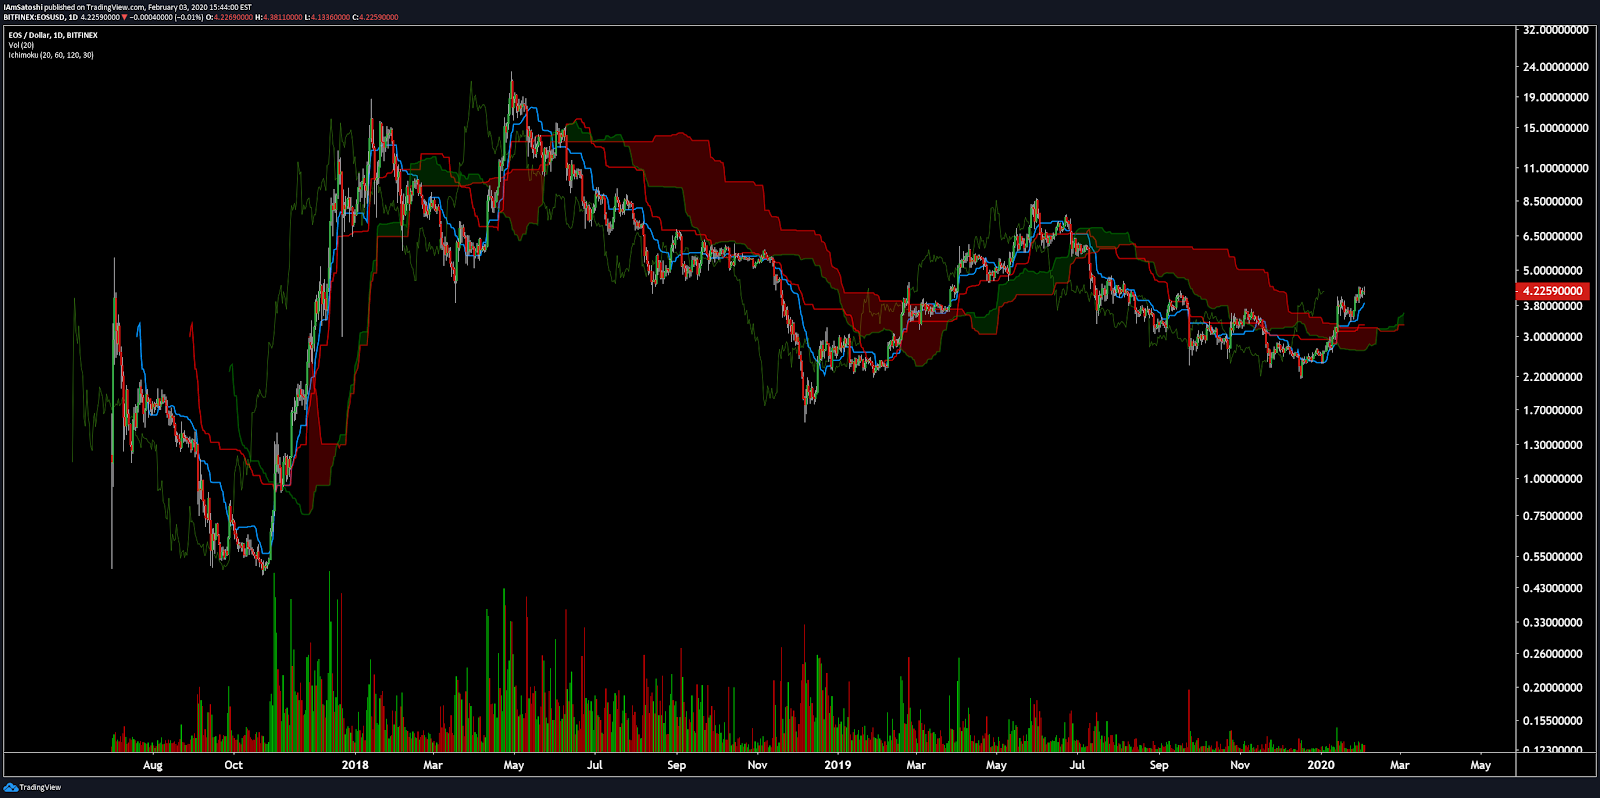
On the daily chart, the Cloud is neutral; price is below the Cloud, the Cloud is newly bearish, the TK cross is bearish, and the Lagging Span is below Cloud and in price. Again, a traditional long entry will not trigger until the current spot price is above the Cloud with a bullish TK cross.
The 50-day Exponential Moving Average (EMA) and 200-day EMA have been bearishly crossed for 373 days, with price recently testing 200-day EMA in November. A bullish 50/200 EMA cross with a bullish Kumo breakout will likely signify sustained bullish momentum.
Conclusion
After almost being left for dead in 2014, DOGE was saved by a merged mining initiative with LTC. The coin which was created as an experiment and flash-in-the-pan joke has stood the test of time due to its enduring position as a mascot for the community. Although dedicated protocol development has slowed to a halt, DOGE continues to serve as an important gateway and playground for the cryptocurrency curious.
Technicals for DOGE/BTC market suggests a near-term reversal as the spot price has continued to grind the historic low for several months. DOGE/BTC often performs best when BTC/USD enters a period of consolidation. Every rise in DOGE’s history was unable to consolidate for further upside, leading to a prolonged 200+ day downtrend. Any further lower lows on the DOGE/BTC pair will likely meet buyers who expect the high-reward, low-risk level to act as expected. A move above 33 sats should be seen as a leading bullish momentum indicator.
 Brave New Coin reaches 1M+ engaged crypto enthusiasts a month through our website, podcast, newsletters, and YouTube. Get your brand in front of key decision-makers and early adopters in 2026. Limited slots remaining! Find out more today!


